
简单4步,利用Prometheus Operator实现自定义指标监控
本文来自Rancher Labs
在过去的文章中,我们花了相当大的篇幅来聊关于监控的话题。这是因为当你正在管理Kubernetes集群时,一切都会以极快的速度发生变化。因此有一个工具来监控集群的健康状态和资源指标极为重要。
在Rancher 2.5中,我们引入了基于Prometheus Operator的新版监控,它可以提供Prometheus以及相关监控组件的原生Kubernetes部署和管理。Prometheus Operator可以让你监控集群节点、Kubernetes组件和应用程序工作负载的状态和进程。同时,它还能够通过Prometheus收集的指标来定义告警并且创建自定义仪表盘,通过Grafana可以轻松地可视化收集到的指标。你可以访问下列链接获取更多关于新版监控组件的细节:
https://rancher.com/docs/rancher/v2.x/en/monitoring-alerting/v2.5/
新版本的监控也采用prometheus-adapter,开发人员可以利用其基于自定义指标和HPA扩展他们的工作负载。
在本文中,我们将探索如何利用Prometheus Operator来抓取自定义指标并利用这些指标进行高级工作负载管理。
安装Prometheus
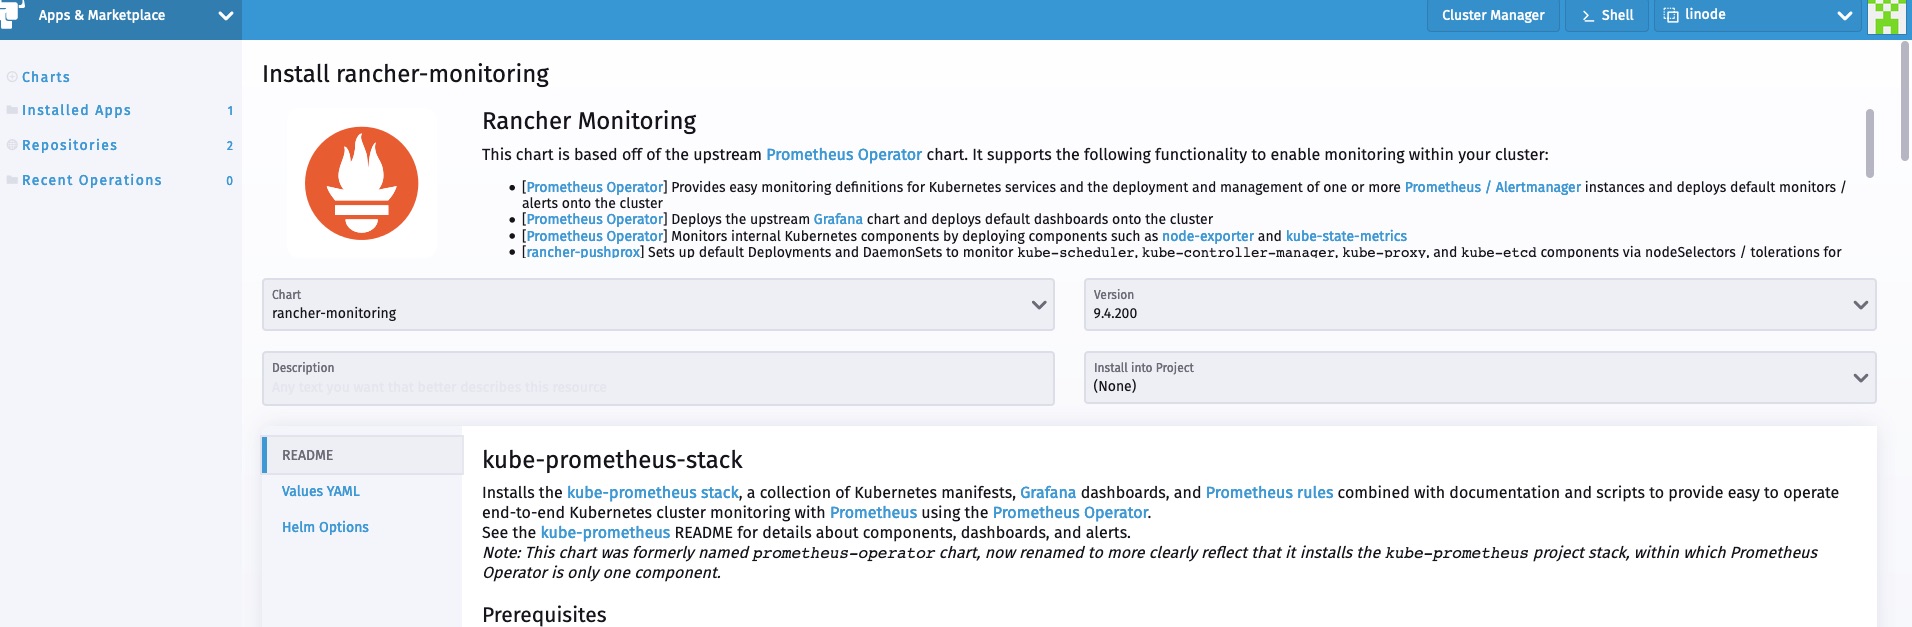
在Rancher 2.5中安装Prometheus极为简单。仅需访问Cluster Explorer -> Apps并安装rancher-monitoring即可。
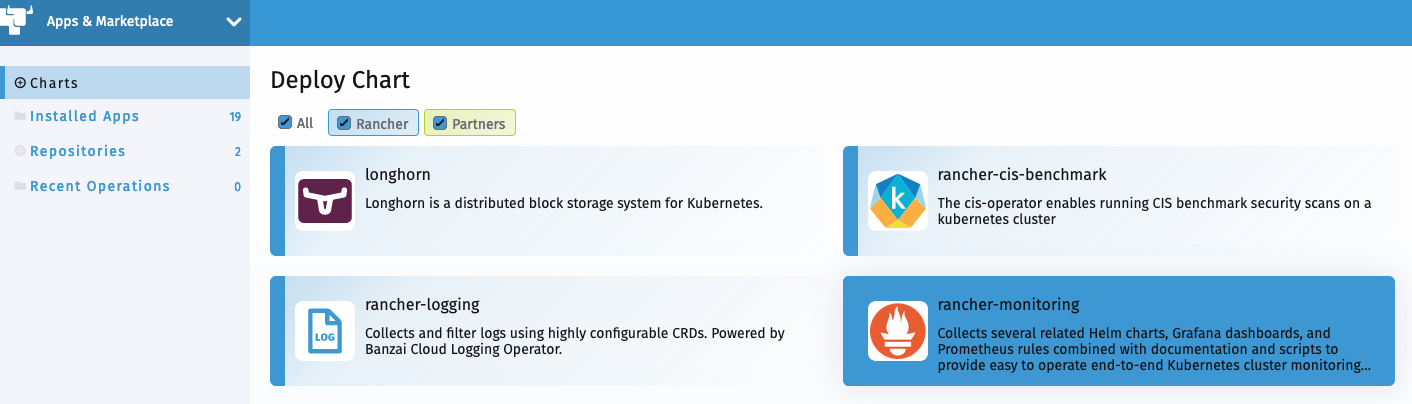
你需要了解以下默认设置:
-
prometheus-adapter将会作为chart安装的一部分启用 -
ServiceMonitorNamespaceSelector留为空,允许 Prometheus 在所有命名空间中收集 ServiceMonitors
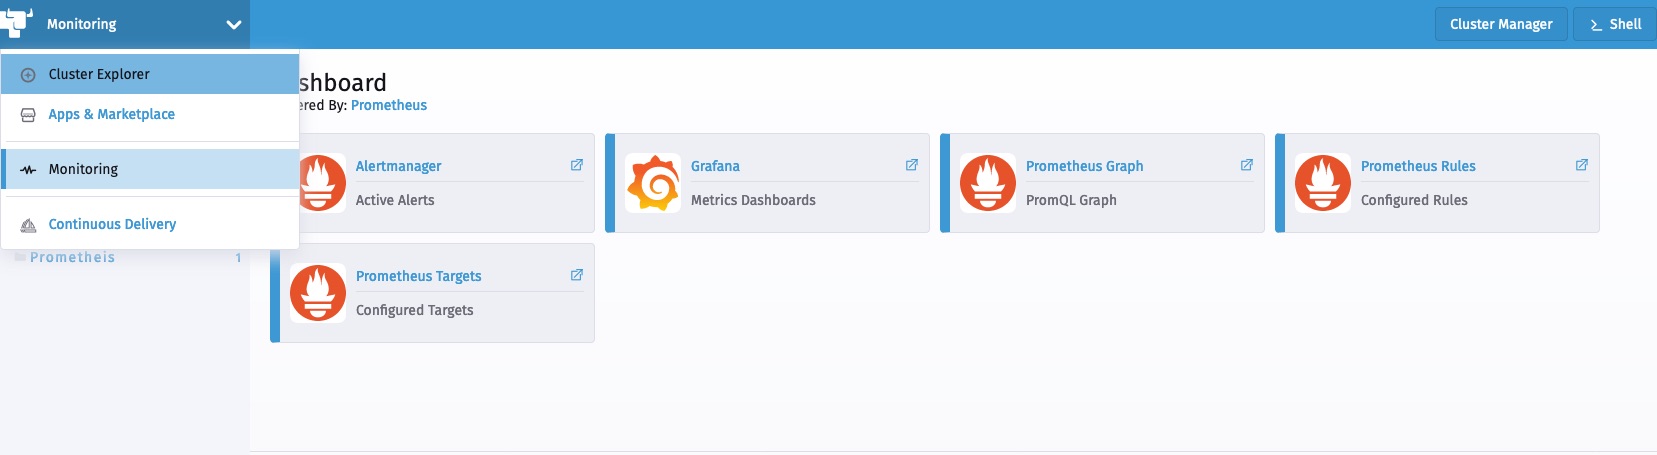
安装完成后,我们可以从Cluster Explorer访问监控组件。
部署工作负载
现在让我们部署一个从应用层暴露自定义指标的示例工作负载。该工作负载暴露了一个简单的应用程序,该应用程序已经使用Prometheus client_golang库进行了检测,并在/metric端点上提供了一些自定义指标。
它有两个指标:
-
http_requests_total
-
http_request_duration_seconds
以下manifest部署了工作负载、相关服务以及访问该工作负载的ingress:
apiVersion: apps/v1
kind: Deployment
metadata:
  labels:
    app.kubernetes.io/name: prometheus-example-app
  name: prometheus-example-app
spec:
  replicas: 1
  selector:
    matchLabels:
      app.kubernetes.io/name: prometheus-example-app
  template:
    metadata:
      labels:
        app.kubernetes.io/name: prometheus-example-app
    spec:
      containers:
      - name: prometheus-example-app
        image: gmehta3/demo-app:metrics
        ports:
        - name: web
          containerPort: 8080
---
apiVersion: v1
kind: Service
metadata:
  name: prometheus-example-app
  labels:
    app.kubernetes.io/name: prometheus-example-app
spec:
  selector:
    app.kubernetes.io/name: prometheus-example-app
  ports:
    - protocol: TCP
      port: 8080
      targetPort: 8080
      name: web
---
apiVersion: networking.k8s.io/v1beta1
kind: Ingress
metadata:
    name: prometheus-example-app
spec:
    rules:
    - host: hpa.demo
      http:
        paths:
        - path: /
          backend:
            serviceName: prometheus-example-app
            servicePort: 8080
部署ServiceMonitor
ServiceMonitor是一个自定义资源定义(CRD),可以让我们声明性地定义如何监控一组动态服务。
你可以访问以下链接查看完整的ServiceMonitor规范:
现在,我们来部署ServiceMonitor,Prometheus用它来收集组成prometheus-example-app Kubernetes服务的pod。
kind: ServiceMonitor
metadata:
  name: prometheus-example-app
spec:
  selector:
    matchLabels:
      app.kubernetes.io/name: prometheus-example-app
  endpoints:
  - port: web
如你所见,现在用户可以在Rancher监控中浏览ServiceMonitor。

不久之后,新的service monitor和服务相关联的pod应该会反映在Prometheus服务发现中。
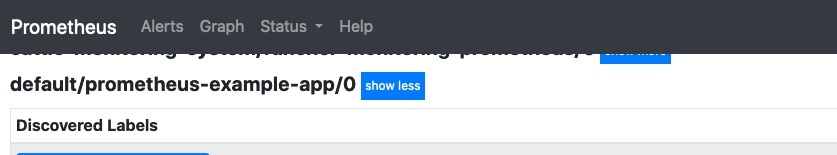
我们也能够在Prometheus中看到指标。

部署Grafana仪表盘
在Rancher 2.5中,监控可以让用户将Grafana仪表盘存储为cattle-dashboards命名空间中的ConfigMaps。
用户或集群管理员现在可以在这一命名空间中添加更多的仪表盘以扩展Grafana的自定义仪表盘。
Dashboard ConfigMap Example
apiVersion: v1
kind: ConfigMap
metadata:
  name: prometheus-example-app-dashboard
  namespace: cattle-dashboards
  labels:
    grafana_dashboard: "1"
data:
  prometheus-example-app.json: |
    {
    "annotations": {
        "list": [
        {
            "builtIn": 1,
            "datasource": "-- Grafana --",
            "enable": true,
            "hide": true,
            "iconColor": "rgba(0, 211, 255, 1)",
            "name": "Annotations & Alerts",
            "type": "dashboard"
        }
        ]
    },
    "editable": true,
    "gnetId": null,
    "graphTooltip": 0,
    "links": [],
    "panels": [
        {
        "aliasColors": {},
        "bars": false,
        "dashLength": 10,
        "dashes": false,
        "datasource": null,
        "fieldConfig": {
            "defaults": {
            "custom": {}
            },
            "overrides": []
        },
        "fill": 1,
        "fillGradient": 0,
        "gridPos": {
            "h": 9,
            "w": 12,
            "x": 0,
            "y": 0
        },
        "hiddenSeries": false,
        "id": 2,
        "legend": {
            "avg": false,
            "current": false,
            "max": false,
            "min": false,
            "show": true,
            "total": false,
            "values": false
        },
        "lines": true,
        "linewidth": 1,
        "nullPointMode": "null",
        "percentage": false,
        "pluginVersion": "7.1.5",
        "pointradius": 2,
        "points": false,
        "renderer": "flot",
        "seriesOverrides": [],
        "spaceLength": 10,
        "stack": false,
        "steppedLine": false,
        "targets": [
            {
            "expr": "rate(http_requests_total{code=\"200\",service=\"prometheus-example-app\"}[5m])",
            "instant": false,
            "interval": "",
            "legendFormat": "",
            "refId": "A"
            }
        ],
        "thresholds": [],
        "timeFrom": null,
        "timeRegions": [],
        "timeShift": null,
        "title": "http_requests_total_200",
        "tooltip": {
            "shared": true,
            "sort": 0,
            "value_type": "individual"
        },
        "type": "graph",
        "xaxis": {
            "buckets": null,
            "mode": "time",
            "name": null,
            "show": true,
            "values": []
        },
        "yaxes": [
            {
            "format": "short",
            "label": null,
            "logBase": 1,
            "max": null,
            "min": null,
            "show": true
            },
            {
            "format": "short",
            "label": null,
            "logBase": 1,
            "max": null,
            "min": null,
            "show": true
            }
        ],
        "yaxis": {
            "align": false,
            "alignLevel": null
        }
        },
        {
        "aliasColors": {},
        "bars": false,
        "dashLength": 10,
        "dashes": false,
        "datasource": null,
        "description": "",
        "fieldConfig": {
            "defaults": {
            "custom": {}
            },
            "overrides": []
        },
        "fill": 1,
        "fillGradient": 0,
        "gridPos": {
            "h": 8,
            "w": 12,
            "x": 0,
            "y": 9
        },
        "hiddenSeries": false,
        "id": 4,
        "legend": {
            "avg": false,
            "current": false,
            "max": false,
            "min": false,
            "show": true,
            "total": false,
            "values": false
        },
        "lines": true,
        "linewidth": 1,
        "nullPointMode": "null",
        "percentage": false,
        "pluginVersion": "7.1.5",
        "pointradius": 2,
        "points": false,
        "renderer": "flot",
        "seriesOverrides": [],
        "spaceLength": 10,
        "stack": false,
        "steppedLine": false,
        "targets": [
            {
            "expr": "rate(http_requests_total{code!=\"200\",service=\"prometheus-example-app\"}[5m])",
            "interval": "",
            "legendFormat": "",
            "refId": "A"
            }
        ],
        "thresholds": [],
        "timeFrom": null,
        "timeRegions": [],
        "timeShift": null,
        "title": "http_requests_total_not_200",
        "tooltip": {
            "shared": true,
            "sort": 0,
            "value_type": "individual"
        },
        "type": "graph",
        "xaxis": {
            "buckets": null,
            "mode": "time",
            "name": null,
            "show": true,
            "values": []
        },
        "yaxes": [
            {
            "format": "short",
            "label": null,
            "logBase": 1,
            "max": null,
            "min": null,
            "show": true
            },
            {
            "format": "short",
            "label": null,
            "logBase": 1,
            "max": null,
            "min": null,
            "show": true
            }
        ],
        "yaxis": {
            "align": false,
            "alignLevel": null
        }
        }
    ],
    "schemaVersion": 26,
    "style": "dark",
    "tags": [],
    "templating": {
        "list": []
    },
    "time": {
        "from": "now-15m",
        "to": "now"
    },
    "timepicker": {
        "refresh_intervals": [
        "5s",
        "10s",
        "30s",
        "1m",
        "5m",
        "15m",
        "30m",
        "1h",
        "2h",
        "1d"
        ]
    },
    "timezone": "",
    "title": "prometheus example app",
    "version": 1
    }
现在,用户应该能够在Grafana中访问prometheus example app的仪表盘。
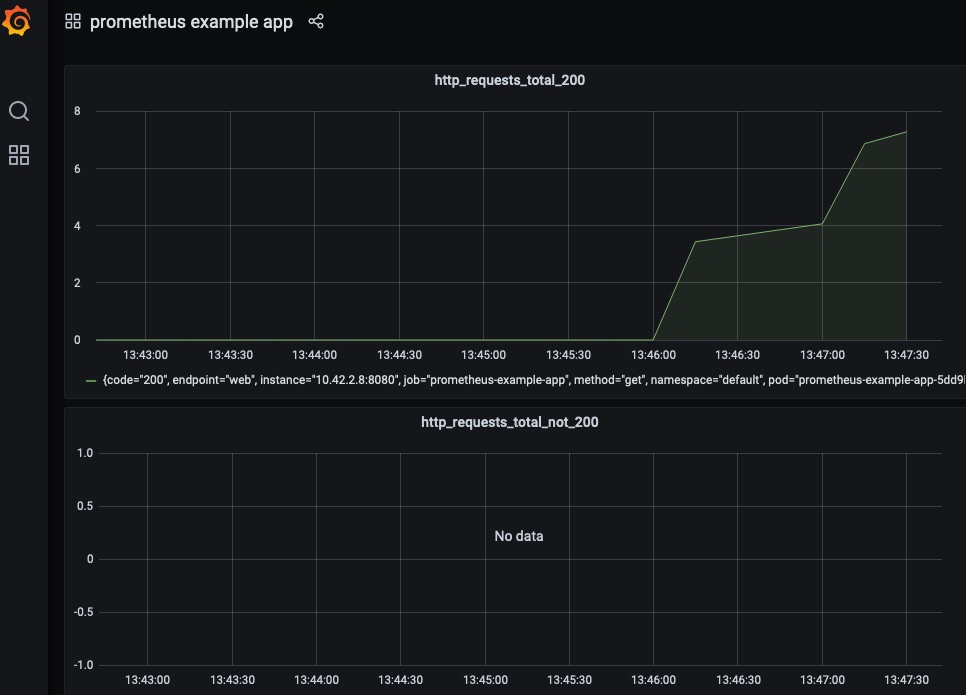
自定义指标的HPA
这一部分假设你已经将prometheus-adapter作为监控的一部分安装完毕了。实际上,在默认情况下,监控安装程序会安装prometheus-adapter。
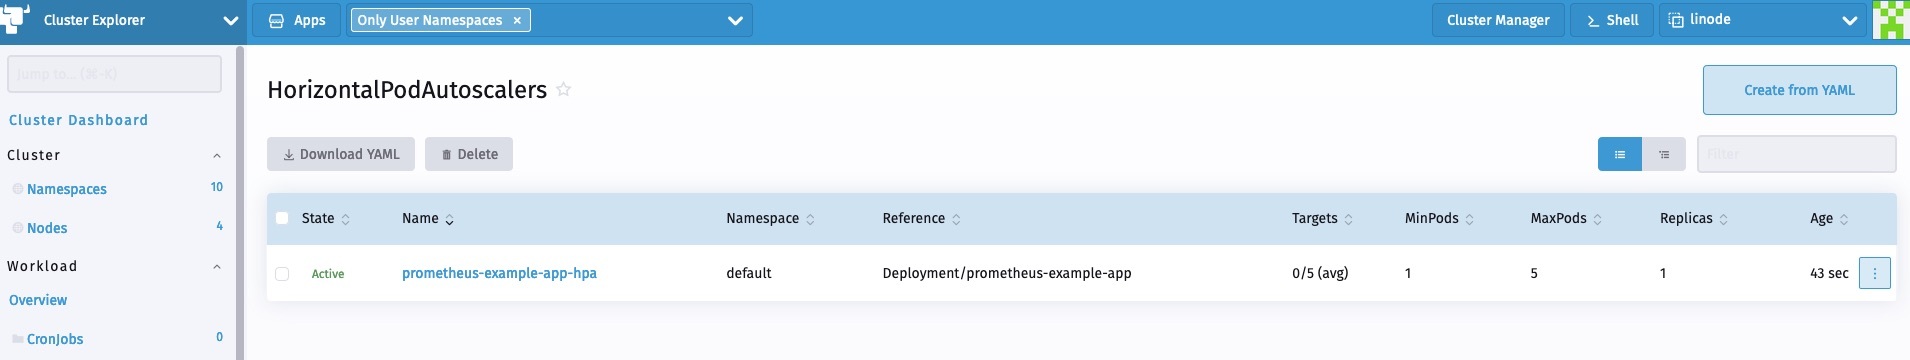
用户现在可以创建一个HPA spec,如下所示:
apiVersion: autoscaling/v2beta2
kind: HorizontalPodAutoscaler
metadata:
  name: prometheus-example-app-hpa
spec:
  scaleTargetRef:
    apiVersion: apps/v1
    kind: Deployment
    name: prometheus-example-app
  minReplicas: 1
  maxReplicas: 5
  metrics:
  - type: Object
    object:
        describedObject:
            kind: Service
            name: prometheus-example-app
        metric:
            name: http_requests
        target:
            averageValue: "5"
            type: AverageValue
你可以查看以下链接获取关于HPA的更多信息:
https://kubernetes.io/docs/tasks/run-application/horizontal-pod-autoscale/
我们将使用自定义的http_requests_total指标来执行pod自动伸缩。
现在我们可以生成一个样本负载来查看HPA的运行情况。我可以使用hey进行同样的操作。
hey -c 10 -n 5000 http://hpa.demo
总 结
在本文中,我们探讨了Rancher 2.5中新监控的灵活性。开发人员和集群管理员可以利用该堆栈来监控它们的工作负载,部署可视化,并利用Kubernetes内可用的高级工作负载管理功能。

 浙公网安备 33010602011771号