SpringCloud(十一)使用actuator和dashborad、turbine对微服务进行监控

@author:QYX 最近在赶开源项目,随缘搬运~

对Feign的支持

引入依赖(feign中已经继承了Hystrix)

在feign中开启配置

 feign:
  client:
    config:
      service-product: #需要调用的服务名称
        loggerLevel: FULL

自定义一个接口的实现类,这个实现类就是熔断触发的降级逻辑

 package com.qqq.fegin;
 
 import com.qqq.entity.Product;
 import org.springframework.stereotype.Component;
 
 @Component
 public class ProductFeignClientCallback implements ProductFeginClient {
     /**
      * 熔断降级方法
      * @param id
      * @return
      */
     @Override
     public Product findById(Long id) {
         Product product=new Product();
         product.setProductName("feign调用触发熔断降级方法");
         return product;
    }
 }
 

修改feignClient接口添加降级方法

 package com.qqq.fegin;
 
 import com.qqq.entity.Product;
 import org.springframework.cloud.openfeign.FeignClient;
 import org.springframework.web.bind.annotation.PathVariable;
 import org.springframework.web.bind.annotation.RequestMapping;
 import org.springframework.web.bind.annotation.RequestMethod;
 
 /**
  * @FeginClient
  * name:服务提供者的名称
  * fallback:配置熔断发送降级方法
  *         实现类
  * 声明需要调用的微服务名称
  *
  */
 
 @FeignClient(name = "service-product",fallback = ProductFeignClientCallback.class)
 public interface ProductFeginClient {
     /**
      * 配置需要调用的微服务接口
      */
     @RequestMapping(value = "/product/{id}",method = RequestMethod.GET)
     public Product findById(@PathVariable("id") Long id);
 }
 

Hystrix设置监控信息:

actuator

一、简介 spring-boot-starter-actuator模块是一个spring提供的监控模块。我们在开运行发过程中,需要实时和定时监控服务的各项状态和可用性。Spring Boot的spring-boot-starter-actuator 模块(健康监控)功能提供了很多监控所需的接口,可以对应用系统进行配置查看、相关功能统计等。

引入坐标

         <!--Hystrix的监控和dashborad控制台-->
         <dependency>
             <groupId>org.springframework.boot</groupId>
             <artifactId>spring-boot-starter-actuator</artifactId>
         </dependency>
         <dependency>
             <groupId>org.springframework.cloud</groupId>
             <artifactId>spring-cloud-starter-netflix-hystrix-dashboard</artifactId>
         </dependency>

在启动类上配置:

 //激活hystrix
 @EnableCircuitBreaker

暴露所有actuator监控的端点

 management:
  endpoints:
    web:
      exposure:
        include: '*'

在页面上进行访问:


http://localhost:9003/actuator/hystrix.stream

Hystrix Dashboard是什么:

Hystrix提供了对于微服务调用状态的监控信息,但是需要结合spring-boot-actuator模块一起使用。Hystrix Dashboard是Hystrix的一个组件,Hystrix Dashboard提供一个断路器的监控面板,可以使我们更好的监控服务和集群的状态,仅仅使用Hystrix Dashboard只能监控到单个断路器的状态,实际开发中还需要结合Turbine使用。

Hystrix Dashboard作用:

Hystrix Dashboard主要用来实时监控Hystrix的各项指标信息。通过Hystrix Dashboard反馈的实时信息,可以帮助我们快速发现系统中存在的问题。

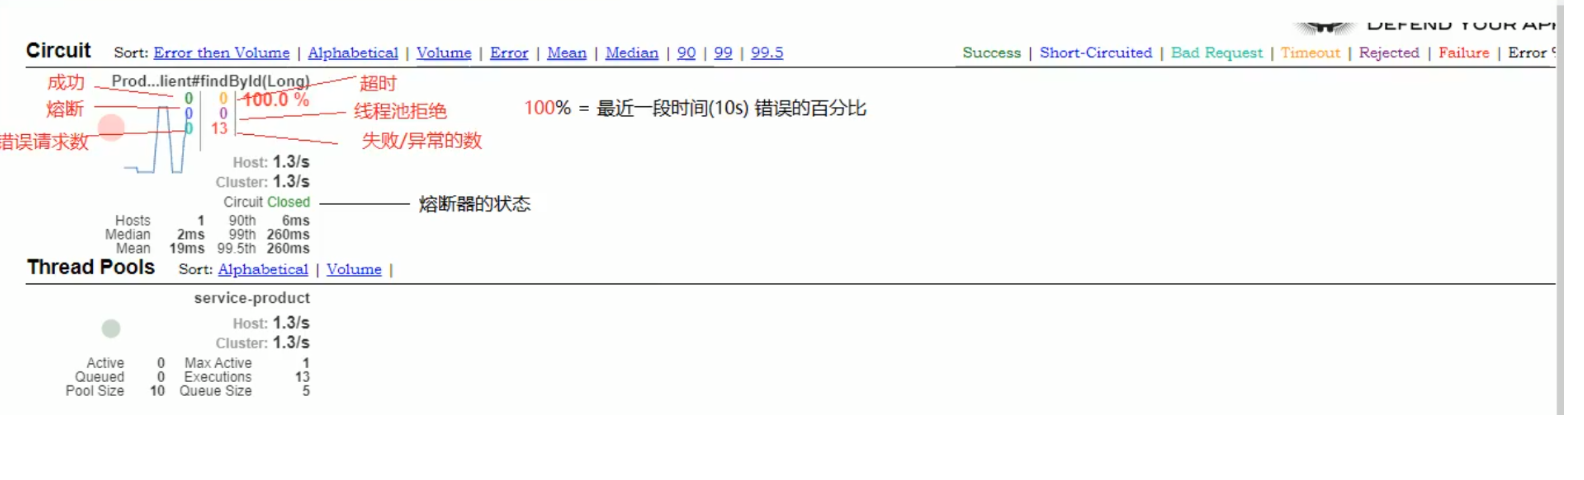
Hystrix Dashboard使用:

eg:使用基于Hystrix的提供者访问数据库表数据,每访问一次都会记录是否成功以及最近10s错误百分比、超时数、熔断数、线程拒绝数、错误请求数、失败/异常数、服务请求频率等相关信息

使用dashborad监控平台监控

引入坐标:

 <!--Hystrix的监控和dashborad控制台-->
 <dependency>
    <groupId>org.springframework.boot</groupId>
    <artifactId>spring-boot-starter-actuator</artifactId>
 </dependency>
 <dependency>
    <groupId>org.springframework.cloud</groupId>
    <artifactId>spring-cloud-starter-netflix-hystrix-dashboard</artifactId>
 </dependency>

在启动类上配置注解:

 //激活hystrix的web监控平台
 @EnableHystrixDashboard

输入网址:

localhost:9003/hystrix


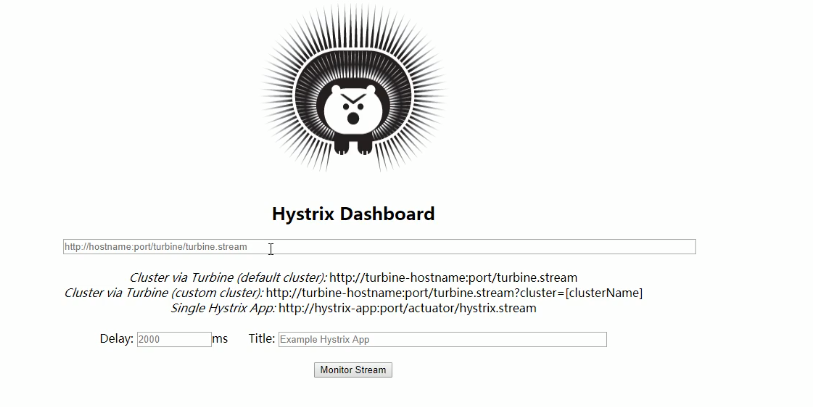
在文本框中输入要监控的spring-boot-actuator模块的地址:即上面的http://localhost:9003/actuator/hystrix.stream

开始监控。


Hystrix Turbine简介

看单个的Hystrix Dashboard的数据并没有什么多大的价值,要想看这个系统的Hystrix Dashboard数据就需要用到Hystrix Turbine。Hystrix Turbine将每个服务Hystrix Dashboard数据进行了整合。Hystrix Turbine的使用非常简单,只需要引入相应的依赖和加上注解和配置就可以了。

配置一个turbineServer


引入坐标

 <?xml version="1.0" encoding="UTF-8"?>
 <project xmlns="http://maven.apache.org/POM/4.0.0"
          xmlns:xsi="http://www.w3.org/2001/XMLSchema-instance"
          xsi:schemaLocation="http://maven.apache.org/POM/4.0.0 http://maven.apache.org/xsd/maven-4.0.0.xsd">
     <parent>
         <artifactId>spring_cloud_demo</artifactId>
         <groupId>cn.qyx</groupId>
         <version>1.0-SNAPSHOT</version>
     </parent>
     <modelVersion>4.0.0</modelVersion>
 
     <artifactId>hystrix_turbine</artifactId>
 
 <dependencies>
     <!--引入hystrix-->
     <dependency>
         <groupId>org.springframework.cloud</groupId>
         <artifactId>spring-cloud-starter-netflix-hystrix</artifactId>
     </dependency>
     <!--Hystrix的监控和dashborad控制台-->
     <dependency>
         <groupId>org.springframework.cloud</groupId>
         <artifactId>spring-cloud-starter-netflix-turbine</artifactId>
     </dependency>
     <dependency>
         <groupId>org.springframework.cloud</groupId>
         <artifactId>spring-cloud-starter-netflix-hystrix-dashboard</artifactId>
     </dependency>
 </dependencies>
 </project>

配置turbine

 server:
  port: 8031
 eureka:
  client:
    service-uri:
      defaultZone: http://localhost:9000/eureka/
  instance:
    prefer-ip-address: true
 turbine:
   #要监控的微服务列表用,多个用,分割
  app-config: service-order
   # 1. clusterNameExpression指定集群名称,默认表达式appName;此时:turbine.aggregator.clusterConfig需要配置想要监控的应用名称
   # 2. 当clusterNameExpression: default时,turbine.aggregator.clusterConfig可以不写,因为默认就是default
   # 3. 当clusterNameExpression: metadata['cluster']时,假设想要监控的应用配置了eureka.instance.metadata-map.cluster: ABC,
   #则需要配置,同时turbine.aggregator.clusterConfig: ABC
  cluster-name-expression: "'default'"

在启动类上使用@EnableHystrixDashboard和@EnableTurbine注解

 package com.itcast.TurbinA;
 
 import org.springframework.boot.SpringApplication;
 import org.springframework.boot.autoconfigure.SpringBootApplication;
 import org.springframework.cloud.netflix.hystrix.dashboard.EnableHystrixDashboard;
 import org.springframework.cloud.netflix.turbine.EnableTurbine;
 
 @SpringBootApplication
 //开启turbine
 @EnableHystrixDashboard
 @EnableTurbine
 public class TurbinApplication {
     public static void main(String[] args) {
         SpringApplication.run(TurbinApplication.class,args);
    }
 }


访问之前配置的端口

localhost:8031/hystrix


输入localhost:8031/turbine.stream查看监控信息


posted @ 2020-03-02 00:36  计算机的探索者  阅读(566)  评论(0编辑  收藏  举报