
QT从新手到入门系列2-曲线图制作
本篇的目标是实现一个可以动态刷新的曲线图,几乎是过去一个多月的qt学习落地的集大成者,下面逐步讲解一下
窗口选择
选择dialog,这样点击的时候可以直接在最上方,通过设置属性隐藏标题栏
setWindowFlags(Qt::Window | Qt::FramelessWindowHint)
窗口弹出位置&&设置窗口可移动属性
  trace_->setProperty("CanMove", true);
  QRect temp;
  // 使用mapToGlobal获取当前窗口位置,传给曲线图,实现曲线图可以跟随父窗口位置弹出
  temp.setRect(this->mapToGlobal(QPoint(0, 0)).x(), this->mapToGlobal(QPoint(0, 0)).y(), size().height(), size().width());
  trace_->ShowAt(temp, type);
定义不同类型,父窗口判断点击不同的label,打开不同的曲线图
bool MainWindow::eventFilter(QObject *target, QEvent *event) {
  switch (event->type()) {
  case QEvent::MouseButtonPress: {
    if (target == ui->t1) {
      ShowTrace(t1);
    }
    else if (target == ui->t2) {
      ShowTrace(t2);
    }
  }
  break;
  default:
    break;
  }

  return QWidget::eventFilter(target, event);
}
检测鼠标事件实现窗口移动
bool Trace::eventFilter(QObject *target, QEvent *event) {
    if(target == this) {
    QMouseEvent *mouse_event = static_cast<QMouseEvent *>(event);
    if (mouse_event->type() == QEvent::MouseButtonPress) {
      if (mouse_event->button() == Qt::LeftButton) {
        mouse_pressed_ = true;
        mouse_point_ = mouse_event->globalPos() - pos();
        return true;
      }
    }
    else if (mouse_event->type() == QEvent::MouseButtonRelease) {
      mouse_pressed_ = false;
      return true;
    }
    else if (mouse_event->type() == QEvent::MouseMove) {
      if (mouse_pressed_ && (mouse_event->buttons() & Qt::LeftButton)) {
        move(mouse_event->globalPos() - mouse_point_);
        return true;
      }
    }
  }
  return QObject::eventFilter(target, event);
}
曲线各种设置
  chart_ = new QChart();
  x_axis_ = new QValueAxis();
  y_axis_ = new QValueAxis();
  series1_ = new QLineSeries();
  series2_ = new QLineSeries();
  chart_->addSeries(series1_);
  chart_->addSeries(series2_);
  chart_->legend()->hide();
  // 背景不可见
  chart_->setBackgroundVisible(false);
  x_axis_->setGridLineVisible(false);
  x_axis_->setLineVisible(false);
  x_axis_->setLabelsVisible(false);
  x_axis_->setLineVisible(false);
  // 指定颜色
  QColor color;
  color.setRgb(238, 242, 248);
  x_axis_->setLabelsColor(color);
  x_axis_->setGridLineColor(qRgba(238, 242, 248, 0.24));
  y_axis_->setLabelsColor(color);
  y_axis_->setGridLineColor("#5f6166");
  y_axis_->setLineVisible(false);
  series1_->setUseOpenGL(true);
  // 设置系列颜色
  series1_->setColor("#0089FF");
  series2_->setUseOpenGL(true);
  series2_->setColor("#FF9B00");
  // 共用坐标
  chart_->setAxisX(x_axis_, series1_);
  chart_->setAxisY(y_axis_, series1_);
  chart_->setAxisX(x_axis_, series2_);
  chart_->setAxisY(y_axis_, series2_);
  ui->graphicsView->setChart(chart_);
  ui->graphicsView->setRenderHint(QPainter::Antialiasing);
  // 设置整个窗口阴影
  QGraphicsDropShadowEffect *shadow = new QGraphicsDropShadowEffect(this);
  shadow->setOffset(0, 12);
  QColor shadow_color;
  shadow_color.setRgbF(0, 0, 0, 0.24);
  shadow->setColor(shadow_color);
  shadow->setBlurRadius(32);
  ui->centerWidget->setGraphicsEffect(shadow);
demo效果

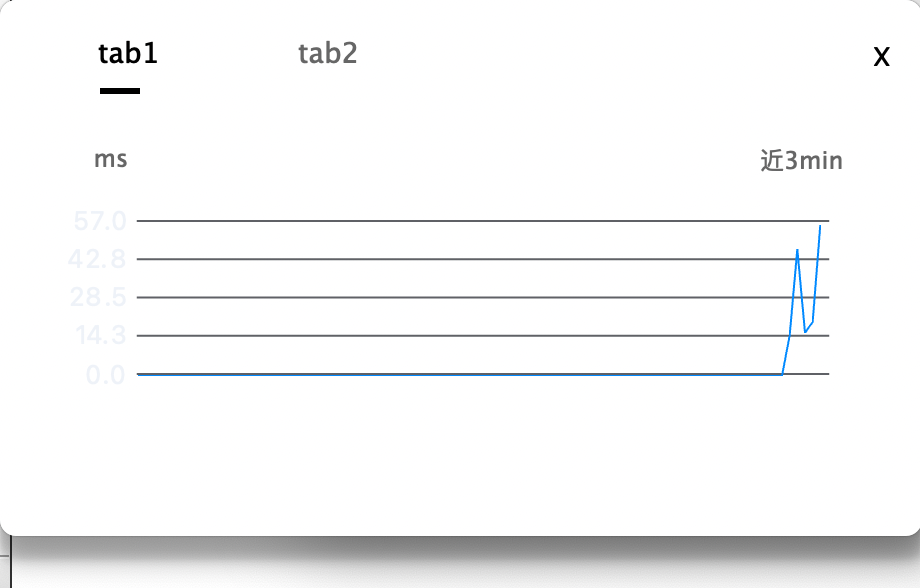
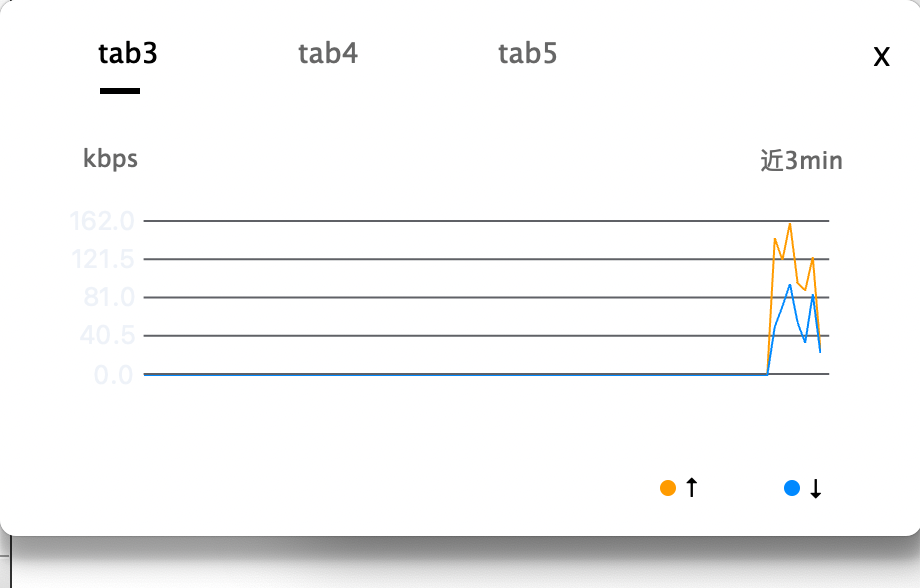
源码下载:https://files.cnblogs.com/files/qwj-sysu/Demo.zip
p

 浙公网安备 33010602011771号