

django——echarts(可视化)
如何使用echarts
echarts官网:https://www.echartsjs.com/zh/index.html
cdn:https://www.bootcdn.cn/echarts/
实现可视化的一般方式
- 服务器端处理:pyecharts
- 后端负责给数据,前端拿到数据,自己渲染: echarts
django使用echars
- 要引入echarts.mim.js 或者是使用cdn
- 从官网的实例 https://www.echartsjs.com/examples/zh/index.html 找一个合适的示例
- 页面中要定义一个标签,设置一下长宽
{% csrf_token %}
<div class="row">
    <div class="col-md-4 page-header">
        <h1>用例执行情况统计</h1>
        <div id="p1" style="max-width: 1000px;width: 900px;height:500px;max-height: 800px;"></div>
    </div>
</div>
- 将示例拷贝到我们前端页面,放在function函数
- 使用ajax将后端将数据库传递给前端,前端将数据替换到option的相对位置
里面的data数据需要从后端传过来
![]() js Code
js Code<script> function pieDoughnut(data) { var option = { tooltip: { trigger: 'item', formatter: '{a} <br/>{b}: {c} ({d}%)' }, legend: { orient: 'vertical', left: 10, data: data[0], }, series: [ { name: '访问来源', type: 'pie', radius: ['50%', '70%'], avoidLabelOverlap: false, label: { normal: { show: false, position: 'center' }, emphasis: { show: true, textStyle: { fontSize: '30', fontWeight: 'bold' } } }, labelLine: { normal: { show: false } }, data: data[1], } ] }; var myChart = echarts.init(document.getElementById('p1')); myChart.setOption(option); } window.onload = function () { $.ajax({ url: "/echarts_msg/", type: "POST", data: {"key": "value", "csrfmiddlewaretoken": $("[name='csrfmiddlewaretoken']").val()}, success: function (data) { pieDoughnut(data['pie_doughnut']); } }) } </script>
- 然后在django的view.py中写上如下内容:
![]() View.py Code
View.py Code1 from django.http import JsonResponse 2 import echartsMsg 3 4 5 # ————————— 可视化相关 ————————— 6 def pie_doughnut(): 7 # 它自己的数据,下面的是自己的数据,要做成它的数据结构 8 # value = '' 9 # name = '' 10 # l = [ 11 # {value: 335, name: '直接访问'}, # data 12 # {value: 310, name: '邮件营销'}, 13 # ] 14 15 legend_data = ["已执行", "未执行"] 16 series_data = [ 17 {"value": 0, "name": "已执行"}, 18 {"value": 0, "name": "未执行"} 19 ] 20 api_obj = models.API.objects.all() 21 for api in api_obj: 22 series_data[0]['value'] += api.case_set.filter(case_execute_status=1).count() 23 series_data[1]['value'] += api.case_set.filter(case_execute_status=1).count() 24 25 return legend_data, series_data 26 27 def echarts_msg(request): 28 if request.method == "GET": 29 return render(request, "echarts_msg.html") 30 else: 31 pie_doughnut = echartsMsg.pie_doughnut() 32 33 return JsonResponse({ 34 "pie_doughnut": pie_doughnut, 35 })


示例
在视图函数中处理好相关数据:
from django.shortcuts import render, redirect, HttpResponse
from django.http import JsonResponse
def test(request):
if request.method == "POST":
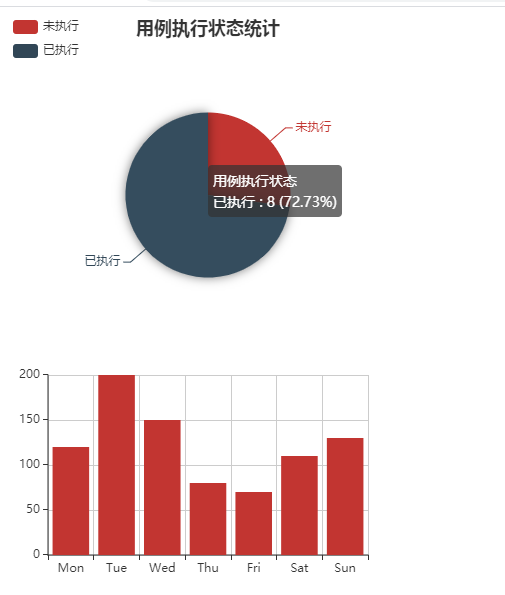
obj = ([{'value': 3, 'name': '未执行'}, {'value': 8, 'name': '已执行'}], ['未执行', '已执行'])
bar = [120, 200, 150, 80, 70, 110, 130]
return JsonResponse({"obj": obj, 'bar': bar})
else:
return render(request, 'test.html', )然后前端调用:
<!DOCTYPE html>
<html lang="en">
<head>
    {% load static %}
    <meta charset="UTF-8">
    <meta http-equiv="x-ua-compatible" content="IE=edge">
    <meta name="viewport" content="width=device-width, initial-scale=1">
    <title>Title</title>
</head>
<body>


<div id="Pie1" style="width: 400px;height:300px;"></div>
<div id="barSimple" style="width: 400px;height:300px;"></div>


</body>

<script src="https://cdn.bootcss.com/jquery/2.2.4/jquery.min.js"></script>
<script src="https://cdn.bootcss.com/echarts/3.0.0/echarts.min.js"></script>
<script>
    // 饼图
    function Pie1(data, ) {
        var myChart = echarts.init(document.getElementById('Pie1'));
        option = {
            title: {
                text: '用例执行状态统计',
                subtext: '',
                x: 'center'
            },
            tooltip: {
                trigger: 'item',
                formatter: "{a} <br/>{b} : {c} ({d}%)"
            },
            legend: {
                orient: 'vertical',
                left: 'left',
                data: data[1]
            },
            series: [
                {
                    name: '用例执行状态',
                    type: 'pie',
                    radius: '55%',
                    center: ['50%', '60%'],
                    data:data[0],
                    itemStyle: {
                        emphasis: {
                            shadowBlur: 10,
                            shadowOffsetX: 0,
                            shadowColor: 'rgba(0, 0, 0, 0.5)'
                        }
                    }
                }
            ]
        };
        myChart.setOption(option);


    }


    // 柱状图
    function barSimple(data) {
        var myChart = echarts.init(document.getElementById('barSimple'));
        option = {
            xAxis: {
                type: 'category',
                data: ['Mon', 'Tue', 'Wed', 'Thu', 'Fri', 'Sat', 'Sun']
            },
            yAxis: {
                type: 'value'
            },
            series: [{
                data: data,
                type: 'bar'
            }]
        };
        myChart.setOption(option)
    }

    window.onload = function () {
        $.ajax({
            url: "/test/",
            type:"POST",
            data: {"k1": "v1"},
            success: function (data) {
                // 饼图
                Pie1(data['obj']);
                // 柱状图
                barSimple(data['bar']);
                console.log(data)
            }
        })
    }
</script>
</html>
效果:

 浙公网安备 33010602011771号