
期末大作业
1.波士顿房价预测
# 线性回归模型:建立13个变量与房价之间的预测模型,并检测模型好坏
import numpy as np
from sklearn.datasets import load_boston
from sklearn.linear_model import LinearRegression
from sklearn.model_selection import train_test_split
import matplotlib.pyplot as plt
# 读取数据集
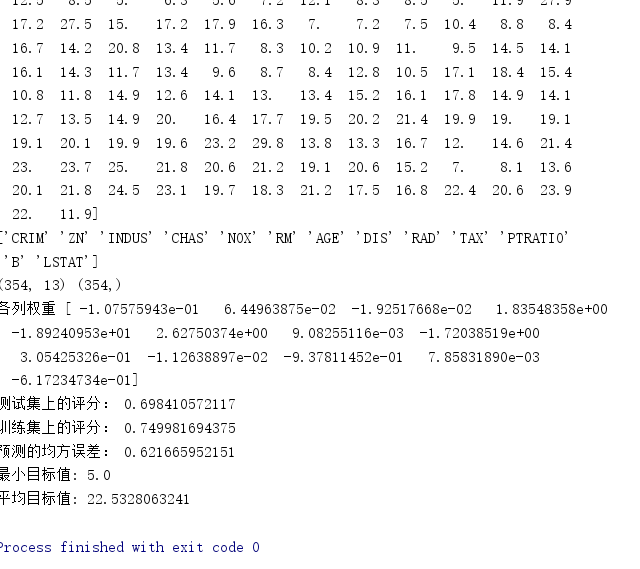
boston = load_boston()
print(boston.keys())
print(boston.target) # 房价数据
print(boston.feature_names) # 数据集特征
# 划分训练集与测试集
# 随机擦痒25%的数据构建测试样本,剩余作为训练样本
X_train, X_test, y_train, y_test = train_test_split(boston.data, boston.target, test_size=0.3) # random_state:是随机数的种子
print(X_train.shape, y_train.shape)
# 建立模型
LineR = LinearRegression()
LineR.fit(X_train, y_train)
# 检查模型好坏
x_predict = LineR.predict(X_test)
print("各列权重", LineR.coef_)
print("测试集上的评分:", LineR.score(X_test, y_test))
print("训练集上的评分:", LineR.score(X_train, y_train))
print("预测的均方误差:", np.mean(x_predict - y_test) ** 2)
print("最小目标值:", np.min(boston.target))
print("平均目标值:", np.mean(boston.target))
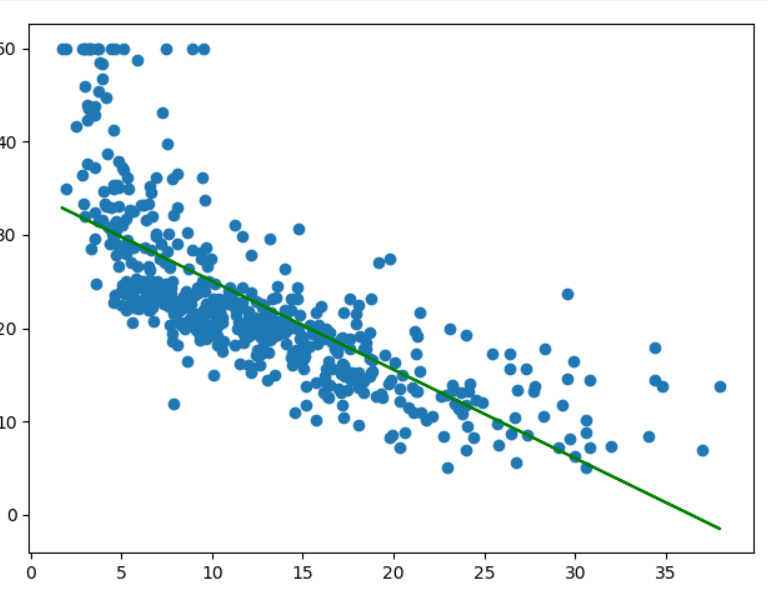
# 画图
X = boston.data[:, 12].reshape(-1, 1)
y = boston.target
plt.scatter(X, y)
LineR2 = LinearRegression()
LineR2.fit(X, y)
y_predict = LineR2.predict(X)
plt.plot(X, y_predict, 'g')
plt.show()
# 多项式回归模型:建立13个变量与房价之间的预测模型,并检测模型好坏
from sklearn.datasets import load_boston
from sklearn.linear_model import LinearRegression
from sklearn.model_selection import train_test_split
from sklearn.preprocessing import PolynomialFeatures
import matplotlib.pyplot as plt
# 读取数据集
boston = load_boston()
# 划分训练集与测试集
# 随机擦痒25%的数据构建测试样本,剩余作为训练样本
x_train, x_test, y_train, y_test = train_test_split(boston.data, boston.target, test_size=0.3) # random_state:是随机数的种子
x = x_train[:, 12].reshape(-1, 1)
poly = PolynomialFeatures(degree=2)
x_poly = poly.fit_transform(x)
# 建立多项式回归模型
lrp = LinearRegression()
lrp.fit(x_poly, y_train)
lr = LinearRegression()
lr.fit(x, y_train)
w = lr.coef_
b = lr.intercept_
# 预测
x_poly2 = poly.transform(x_test[:, 12].reshape(-1, 1))
y_ploy_predict = lrp.predict(x_poly2)
# 画图
plt.scatter(x_test[:, 12], y_test)
plt.plot(x, w * x + b, 'y')
plt.scatter(x_test[:, 12], y_ploy_predict, c='r')
plt.show()

2.新闻文本分类

#导包
import jieba
import os

# 导入停用词
stopword=open('D:\stopsCN.txt','r',encoding="utf-8").read()

#数据处理
def processing(tokens):
    # 去掉非字母汉字的字符
    tokens = "".join([char for char in tokens if char.isalpha()])
    # 结巴分词
    tokens = [token for token in jieba.cut(tokens,cut_all=True) if len(token) >=2]
    # 去掉停用词
    tokens = " ".join([token for token in tokens if token not in stopword])
    return tokens
#词频统计
def count(tokens):
    lifedict = {}
    for word in tokens:
        if len(word) == 1:
            continue
    else:
        lifedict[word] = lifedict.get(word, 0) + 1

    wordlist = list(lifedict.items())
    wordlist.sort(key=lambda x: x[1], reverse=True)#降序排序

#读取文件
all_txt=[]
all_target=[]
path = r'D:\0369'
files = os.listdir(path)
for root,dirs,files in os.walk(path):
    for file in files:
        filepath = os.path.join(root, file)  # 文件路径
        tokens=open(filepath,'r',encoding='utf-8').read()
        tokens=processing(tokens)
        all_txt.append(tokens)
        target = filepath.split('\\')[-2]#按文件夹获取特征名
        all_target.append(target)

#按6:4比例分为训练集和测试集
from sklearn.model_selection import train_test_split
x_train,x_test,y_train,y_test=train_test_split(all_txt,all_target,test_size=0.4,stratify=all_target)
#将其向量化
from sklearn.feature_extraction.text import TfidfVectorizer
vectorizer=TfidfVectorizer()
X_train=vectorizer.fit_transform(x_train)
X_test=vectorizer.transform(x_test)
#分类结果显示
from sklearn.naive_bayes import  MultinomialNB
mnb=MultinomialNB()
clf=mnb.fit(X_train,y_train)
#进行预测
y_predict = clf.predict(X_test)
# 输出模型精确度
from sklearn.model_selection import cross_val_score
from sklearn.metrics import classification_report
scores=cross_val_score(mnb,X_test,y_test,cv=4)
print("Accuracy:%.3f"%scores.mean())
# 输出模型评估报告
print("classification_report:\n",classification_report(y_predict,y_test))
y_nb_pred = clf.predict(X_test)

# 将预测结果和实际结果进行对比
import collections
import matplotlib.pyplot as plt
from pylab import mpl
mpl.rcParams['font.sans-serif'] = ['FangSong'] # 指定默认字体
mpl.rcParams['axes.unicode_minus'] = False # 解决保存图像是负号'-'显示为方块的问题

# 统计测试集和预测集的各类新闻个数
testCount = collections.Counter(y_test)
predCount = collections.Counter(y_predict)
print('实际:',testCount,'\n', '预测', predCount)

# 建立标签列表,实际结果列表,预测结果列表,
nameList = list(testCount.keys())
testList = list(testCount.values())
predictList = list(predCount.values())
x = list(range(len(nameList)))
print("新闻类别:",nameList,'\n',"实际:",testList,'\n',"预测:",predictList)


