使用串口绘制实时曲线 —— SerialChart
SerialChart:下载
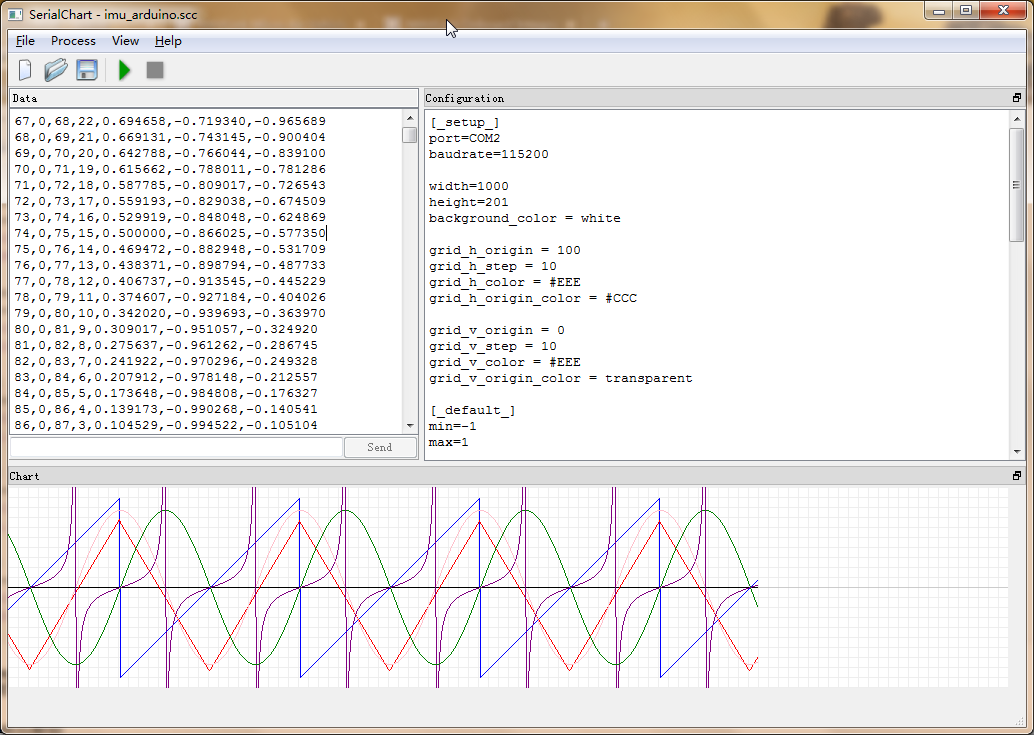
1. 实验效果
2. 串口程序
  while(1){
        if(++x>=180){
            y = 90;
            x = 0;
        }
        if(x>=90)    y++;
        else             y--;
        z = sin(x*Pi/90);
        p = cos(x*Pi/90);
        r = tan(x*Pi/90);
    printf("%d,%d,%d,%d,%f,%f,%f\n",t,0,x,y,z,p,r);
        delay_ms(50);
        t++;
    }
3. 数据格式
|
Interval |
, |
Dat1 |
, |
Dat2 |
, |
。。。 |
Datn |
, |
\n |
数据以帧为单位,其中Interval设为整形即可,用处是用来分辨当前数据是那一时刻的数据,你也可以用来显示,甚至不用Interval(把它当成一个通道的数据),例子中Interval的值设置为了transparent,即不显示。
Dat是你想用来显示的数据,最多支持多少没有测试,不够是够用了。
最后‘\n’代表着该帧的结束
总结一下
- 通过 ‘,’ 来区分不同通道数据,从前往后依次为通道“1...n”。
- 通道1,一般用来作为时间标志来确定那一时刻的数据,也可作序列号来确定丢包率。
- 通道2..n,根据自己需要配置
- 最后输出换行符 '\n' 作为帧结束标志
4. 配置
[_setup_]
port=COM2
baudrate=115200

width=1000
height=201
background_color = white

grid_h_origin = 100
grid_h_step = 10
grid_h_color = #EEE
grid_h_origin_color = #CCC

grid_v_origin = 0
grid_v_step = 10
grid_v_color = #EEE
grid_v_origin_color = transparent

[_default_]
min=-1
max=1

[interval]
color= transparent
min=0
max=500

[level]
color=black

[sawtooth]
color=blue
min=-10
max=190

[triangular]
color=red
min=-10
max=110

[sin]
color=green
min=-1.3
max=1.3

[cos]
color=pink
min=-1.3
max=1.3

[tan]
color=purple
min=-10
max=10

 浙公网安备 33010602011771号