SpringCloud Sleuth
简介
在这种大规模的分布式系统中,一个完整的系统是由多种不同的服务来共同支撑的,不同的系统可能分布在上千台服务器上,横跨多个数据中心,一旦系统出问题,此时问题的定位就比较麻烦。
分布式链路跟踪:
在微服务环境下,一次客户端请求,可能会引起数十次、上百次服务端服务之间的调用。一旦请求出问题了,我们需要考虑很多东西:
- 如何快速定位问题?
- 如果快速确定此次客户端调用,都涉及到哪些服务?
- 到底是哪一个服务出问题了?
要解决这些问题,就涉及到分布式链路追踪。
分布式链路追踪系统主要用来跟踪服务调用记录的,一般来说,一个分布式链路追踪系统,有三个部分: - 数据收集
- 数据存储
- 数据展示
Spring Cloud Sleuth(斯撸死)是SpringCloud提供的一套分布式链路跟踪系统
trace:从请求到达系统开始,到给请求做出响应,这样一个过程成为 trace
span:每次调用服务时,埋入的一个调用记录,成为 span
annotation:相当于 span 的语法,描述 span 所处的状态。
简单应用
首先创建一个项目,引入Spring Cloud Sleuth
<dependency>
    <groupId>org.springframework.boot</groupId>
    <artifactId>spring-boot-starter-web</artifactId>
</dependency>
<dependency>
    <groupId>org.springframework.cloud</groupId>
    <artifactId>spring-cloud-starter-sleuth</artifactId>
</dependency>
接下来创建一个HelloController,打印日志测试
@RestController
public class HelloController {
    RestTemplate restTemplate;

    public final static Logger logger = LoggerFactory.getLogger(HelloController.class);

    @GetMapping("/hello")
    public String hello(){
        logger.info("hello spring cloud sleuth");
        return "hello spring cloud sleuth";
    }
}
可以给当前服务配置一个名字,这个名字在输出的日志中会体现出来:
spring.application.name=javaboy-sleuth
启动应用,请求 /hello 接口,结果如下:
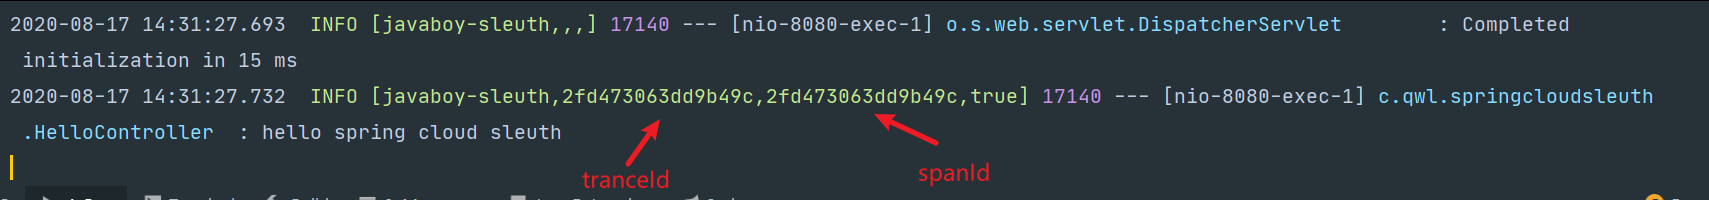
这个就是 Spring Cloud Sleuth 的输出。
再定义两个接口,在 hello2 中调用 hello3,形成调用链:
@SpringBootApplication
public class SpringCloudSleuthApplication {

    public static void main(String[] args) {
        SpringApplication.run(SpringCloudSleuthApplication.class, args);
    }
    @Bean
    RestTemplate restTemplate(){
        return new RestTemplate();
    }
}

@RestController
public class HelloController {
    @Autowired
    RestTemplate restTemplate;

    public final static Logger logger = LoggerFactory.getLogger(HelloController.class);

    @GetMapping("/hello")
    public String hello(){
        logger.info("hello spring cloud sleuth");
        return "hello spring cloud sleuth";
    }
    @GetMapping("/hello2")
    public String hello2() throws InterruptedException {
        logger.info("hello2");
        Thread.sleep(500);
        return restTemplate.getForObject("http://localhost:8080/hello3", String.class);
    }

    @GetMapping("/hello3")
    public String hello3() throws InterruptedException {
        logger.info("hello3");
        Thread.sleep(500);
        return "hello3";
    }
}
此时,访问 hello2,会先调用 hello3,拿到返回结果,会给 hello2。
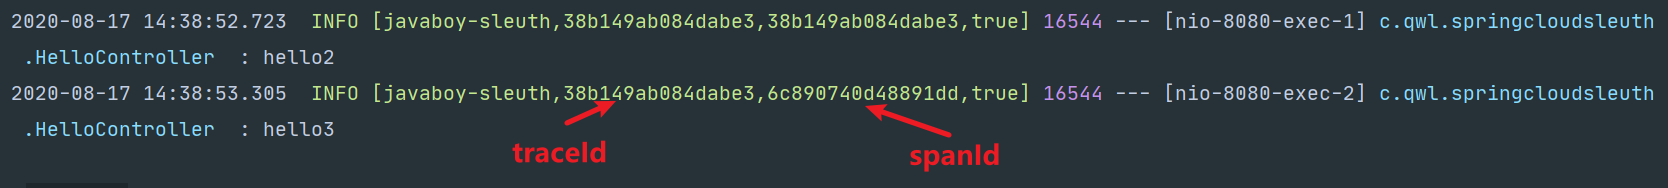
一个trace由多个span组成,一个trace相当于就是一个调用链,而一个span则是这个链中的每一次调用过程。
Spring Cloud Sleuth中也可以收集到异步任务中的信息
开启异步任务:
@SpringBootApplication
@EnableAsync
public class SpringCloudSleuthApplication {

    public static void main(String[] args) {
        SpringApplication.run(SpringCloudSleuthApplication.class, args);
    }
    @Bean
    RestTemplate restTemplate(){
        return new RestTemplate();
    }
}
/// 创建一个HelloService,提供一个异步任务方法;
public class HelloService {
    public final static Logger logger = LoggerFactory.getLogger(HelloController.class);

    @Async
    public String backgroundFun(){
        logger.info("backgroundFun");
        return "backgroundFun";
    }
}
再在HelloController中调用该异步方法:
  @GetMapping("/hello4")
  public String hello4(){
      logger.info("hello4");
      return helloService.backgroundFun();
  }
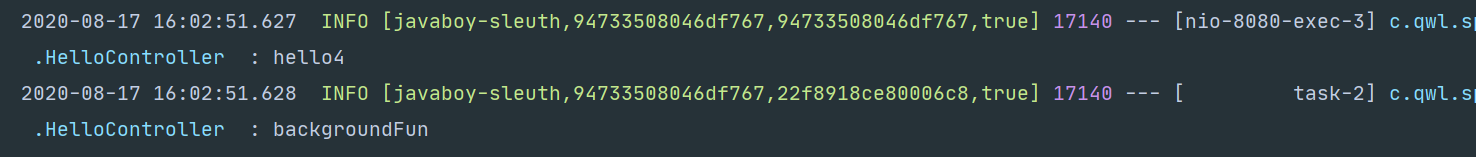
启动项目进行测试,发现Sleuth也打印出日志了,在异步方法中,异步任务是单独的spanid
Spring Cloud Sleuth 也可以手机定时任务的信息。
首先开启定时任务支持:
@SpringBootApplication
@EnableAsync
@EnableScheduling
public class SpringCloudSleuthApplication {

    public static void main(String[] args) {
        SpringApplication.run(SpringCloudSleuthApplication.class, args);
    }
    @Bean
    RestTemplate restTemplate(){
        return new RestTemplate();
    }
}
然后在HelloController,添加定时任务,去调用background方法
@Scheduled(cron = "0/10 * * * * ?")
public void sche1(){
    logger.info("start:");
    backgroundFun();
    logger.info("end:");
}
然后访问 hello4 接口进行测试。
在定时任务中,每一次定时任务都会产生一个新的 Trace,并且在调用过程中,SpanId 都是一致的,这个和普通的调用不一样。

 浙公网安备 33010602011771号