分布式存储系统之Ceph集群状态获取及ceph配置文件说明
 ceph -s主要输出有三类信息,一类是集群相关信息,比如集群id,健康状态;第二类是服务类相关信息,比如集群运行了几个mon节点,几个mgr节点,几个mds,osd和rgw;这些服务都处于什么样的状态等等;我们把这些信息称为集群运行状况,它可以让我们一目了然的了解到集群现有运行状况;第三类信息是数据存储类的信息;比如有多少个存储池,和pg数量;usage用来展示集群使用容量和剩余容量以及总容量;这里需要注意一点,集群显示的总磁盘大小,它不等于可以存储这么多对象数据;因为每一个对象数据都多个副本,所以真正能够存储对象数据的量应该根据副本的数量来计算;默认情况下,我们创建的存储都是副本型存储池,副本数量是3个(其中一个主,两个从),即每一个对象数据都会存储三份,所以真正能够存储对象数据的空间只有总空间的三分之一;
前文我们了解了Ceph的访问接口的启用相关话题,回顾请参考https://www.cnblogs.com/qiuhom-1874/p/16727620.html;今天我们来聊一聊获取ceph集群状态和ceph配置文件说明相关话题;
Ceph集群状态获取常用命令
1、ceph -s :该命令用于输出ceph集群系统状态信息

提示:ceph -s主要输出有三类信息,一类是集群相关信息,比如集群id,健康状态;第二类是服务类相关信息,比如集群运行了几个mon节点,几个mgr节点,几个mds,osd和rgw;这些服务都处于什么样的状态等等;我们把这些信息称为集群运行状况,它可以让我们一目了然的了解到集群现有运行状况;第三类信息是数据存储类的信息;比如有多少个存储池,和pg数量;usage用来展示集群使用容量和剩余容量以及总容量;这里需要注意一点,集群显示的总磁盘大小,它不等于可以存储这么多对象数据;因为每一个对象数据都多个副本,所以真正能够存储对象数据的量应该根据副本的数量来计算;默认情况下,我们创建的存储都是副本型存储池,副本数量是3个(其中一个主,两个从),即每一个对象数据都会存储三份,所以真正能够存储对象数据的空间只有总空间的三分之一;
获取集群的即时状态信息
2、获取pg的状态
[cephadm@ceph-admin ceph-cluster]$ ceph pg stat
304 pgs: 304 active+clean; 3.8 KiB data, 10 GiB used, 890 GiB / 900 GiB avail
[cephadm@ceph-admin ceph-cluster]$
3、获取存储池的状态
[cephadm@ceph-admin ceph-cluster]$ ceph osd pool stats
pool testpool id 1
  nothing is going on

pool rbdpool id 2
  nothing is going on

pool .rgw.root id 3
  nothing is going on

pool default.rgw.control id 4
  nothing is going on

pool default.rgw.meta id 5
  nothing is going on

pool default.rgw.log id 6
  nothing is going on

pool cephfs-metadatpool id 7
  nothing is going on

pool cephfs-datapool id 8
  nothing is going on

[cephadm@ceph-admin ceph-cluster]$
提示:如果后面没有跟指定的存储表示获取所有存储的状态;
4、获取存储池大小和空间使用情况
[cephadm@ceph-admin ceph-cluster]$ ceph df
GLOBAL:
    SIZE        AVAIL       RAW USED     %RAW USED
    900 GiB     890 GiB       10 GiB          1.13
POOLS:
    NAME                    ID     USED        %USED     MAX AVAIL     OBJECTS
    testpool                1          0 B         0       281 GiB           0
    rbdpool                 2        389 B         0       281 GiB           5
    .rgw.root               3      1.1 KiB         0       281 GiB           4
    default.rgw.control     4          0 B         0       281 GiB           8
    default.rgw.meta        5          0 B         0       281 GiB           0
    default.rgw.log         6          0 B         0       281 GiB         175
    cephfs-metadatpool      7      2.2 KiB         0       281 GiB          22
    cephfs-datapool         8          0 B         0       281 GiB           0
[cephadm@ceph-admin ceph-cluster]$
提示:ceph df输出的内容主要分两大段,第一段是global,全局存储空间用量情况;size表示总空间大小,avail表示剩余空间大小;RAW USED表示已用到原始存储空间;%RAW USED表示已用原始空间占比重空间的比例;第二段是相关存储空间使用情况;其中MAX AVAIL表示对应存储池能够使用的最大容量;OBJECTS表示该存储池中对象的个数;
获取存储空间用量详细情况
[cephadm@ceph-admin ceph-cluster]$ ceph df detail
GLOBAL:
    SIZE        AVAIL       RAW USED     %RAW USED     OBJECTS
    900 GiB     890 GiB       10 GiB          1.13        214
POOLS:
    NAME                    ID     QUOTA OBJECTS     QUOTA BYTES     USED        %USED     MAX AVAIL     OBJECTS     DIRTY     READ        WRITE       RAW USED
    testpool                1      N/A               N/A                 0 B         0       281 GiB           0        0          2 B         2 B          0 B
    rbdpool                 2      N/A               N/A               389 B         0       281 GiB           5        5         75 B        19 B      1.1 KiB
    .rgw.root               3      N/A               N/A             1.1 KiB         0       281 GiB           4        4         66 B         4 B      3.4 KiB
    default.rgw.control     4      N/A               N/A                 0 B         0       281 GiB           8        8          0 B         0 B          0 B
    default.rgw.meta        5      N/A               N/A                 0 B         0       281 GiB           0        0          0 B         0 B          0 B
    default.rgw.log         6      N/A               N/A                 0 B         0       281 GiB         175      175      7.2 KiB     4.8 KiB          0 B
    cephfs-metadatpool      7      N/A               N/A             2.2 KiB         0       281 GiB          22       22          0 B        45 B      6.7 KiB
    cephfs-datapool         8      N/A               N/A                 0 B         0       281 GiB           0        0          0 B         0 B          0 B
[cephadm@ceph-admin ceph-cluster]$
5、检查OSD和MON的状态
[cephadm@ceph-admin ceph-cluster]$ ceph osd stat
10 osds: 10 up, 10 in; epoch: e99
[cephadm@ceph-admin ceph-cluster]$ ceph osd dump
epoch 99
fsid 7fd4a619-9767-4b46-9cee-78b9dfe88f34
created 2022-09-24 00:36:13.639715
modified 2022-09-25 12:33:15.111283
flags sortbitwise,recovery_deletes,purged_snapdirs
crush_version 25
full_ratio 0.95
backfillfull_ratio 0.9
nearfull_ratio 0.85
require_min_compat_client jewel
min_compat_client jewel
require_osd_release mimic
pool 1 'testpool' replicated size 3 min_size 2 crush_rule 0 object_hash rjenkins pg_num 16 pgp_num 16 last_change 42 flags hashpspool stripe_width 0
pool 2 'rbdpool' replicated size 3 min_size 2 crush_rule 0 object_hash rjenkins pg_num 64 pgp_num 64 last_change 81 flags hashpspool,selfmanaged_snaps stripe_width 0 application rbd
        removed_snaps [1~3]
pool 3 '.rgw.root' replicated size 3 min_size 2 crush_rule 0 object_hash rjenkins pg_num 8 pgp_num 8 last_change 84 owner 18446744073709551615 flags hashpspool stripe_width 0 application rgw
pool 4 'default.rgw.control' replicated size 3 min_size 2 crush_rule 0 object_hash rjenkins pg_num 8 pgp_num 8 last_change 87 owner 18446744073709551615 flags hashpspool stripe_width 0 application rgw
pool 5 'default.rgw.meta' replicated size 3 min_size 2 crush_rule 0 object_hash rjenkins pg_num 8 pgp_num 8 last_change 89 owner 18446744073709551615 flags hashpspool stripe_width 0 application rgw
pool 6 'default.rgw.log' replicated size 3 min_size 2 crush_rule 0 object_hash rjenkins pg_num 8 pgp_num 8 last_change 91 owner 18446744073709551615 flags hashpspool stripe_width 0 application rgw
pool 7 'cephfs-metadatpool' replicated size 3 min_size 2 crush_rule 0 object_hash rjenkins pg_num 64 pgp_num 64 last_change 99 flags hashpspool stripe_width 0 application cephfs
pool 8 'cephfs-datapool' replicated size 3 min_size 2 crush_rule 0 object_hash rjenkins pg_num 128 pgp_num 128 last_change 99 flags hashpspool stripe_width 0 application cephfs
max_osd 10
osd.0 up   in  weight 1 up_from 67 up_thru 96 down_at 66 last_clean_interval [64,65) 192.168.0.71:6802/1361 172.16.30.71:6802/1361 172.16.30.71:6803/1361 192.168.0.71:6803/1361 exists,up bf3649af-e3f4-41a2-a5ce-8f1a316d344e
osd.1 up   in  weight 1 up_from 68 up_thru 96 down_at 66 last_clean_interval [64,65) 192.168.0.71:6800/1346 172.16.30.71:6800/1346 172.16.30.71:6801/1346 192.168.0.71:6801/1346 exists,up 7293a12a-7b4e-4c86-82dc-0acc15c3349e
osd.2 up   in  weight 1 up_from 67 up_thru 96 down_at 66 last_clean_interval [60,65) 192.168.0.72:6800/1389 172.16.30.72:6800/1389 172.16.30.72:6801/1389 192.168.0.72:6801/1389 exists,up 96c437c5-8e82-4486-910f-9e98d195e4f9
osd.3 up   in  weight 1 up_from 67 up_thru 96 down_at 66 last_clean_interval [60,65) 192.168.0.72:6802/1406 172.16.30.72:6802/1406 172.16.30.72:6803/1406 192.168.0.72:6803/1406 exists,up 4659d2a9-09c7-49d5-bce0-4d2e65f5198c
osd.4 up   in  weight 1 up_from 71 up_thru 96 down_at 68 last_clean_interval [59,66) 192.168.0.73:6802/1332 172.16.30.73:6802/1332 172.16.30.73:6803/1332 192.168.0.73:6803/1332 exists,up de019aa8-3d2a-4079-a99e-ec2da2d4edb9
osd.5 up   in  weight 1 up_from 71 up_thru 96 down_at 68 last_clean_interval [58,66) 192.168.0.73:6800/1333 172.16.30.73:6800/1333 172.16.30.73:6801/1333 192.168.0.73:6801/1333 exists,up 119c8748-af3b-4ac4-ac74-6171c90c82cc
osd.6 up   in  weight 1 up_from 69 up_thru 96 down_at 68 last_clean_interval [59,66) 192.168.0.74:6800/1306 172.16.30.74:6800/1306 172.16.30.74:6801/1306 192.168.0.74:6801/1306 exists,up 08d8dd8b-cdfe-4338-83c0-b1e2b5c2a799
osd.7 up   in  weight 1 up_from 69 up_thru 96 down_at 68 last_clean_interval [60,65) 192.168.0.74:6802/1301 172.16.30.74:6802/1301 172.16.30.74:6803/1301 192.168.0.74:6803/1301 exists,up 9de6cbd0-bb1b-49e9-835c-3e714a867393
osd.8 up   in  weight 1 up_from 73 up_thru 96 down_at 66 last_clean_interval [59,65) 192.168.0.75:6800/1565 172.16.30.75:6800/1565 172.16.30.75:6801/1565 192.168.0.75:6801/1565 exists,up 63aaa0b8-4e52-4d74-82a8-fbbe7b48c837
osd.9 up   in  weight 1 up_from 73 up_thru 96 down_at 66 last_clean_interval [59,65) 192.168.0.75:6802/1558 172.16.30.75:6802/1558 172.16.30.75:6803/1558 192.168.0.75:6803/1558 exists,up 6bf3204a-b64c-4808-a782-434a93ac578c
[cephadm@ceph-admin ceph-cluster]$
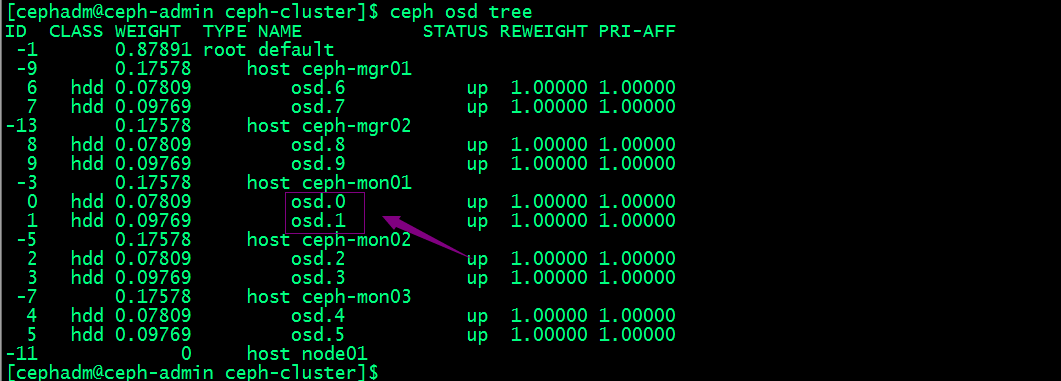
除了上述命令来检查osd状态,我们还可以根据OSD在CRUSH MPA中的位置查看osd
[cephadm@ceph-admin ceph-cluster]$ ceph osd tree
ID  CLASS WEIGHT  TYPE NAME           STATUS REWEIGHT PRI-AFF
 -1       0.87891 root default
 -9       0.17578     host ceph-mgr01
  6   hdd 0.07809         osd.6           up  1.00000 1.00000
  7   hdd 0.09769         osd.7           up  1.00000 1.00000
 -3       0.17578     host ceph-mon01
  0   hdd 0.07809         osd.0           up  1.00000 1.00000
  1   hdd 0.09769         osd.1           up  1.00000 1.00000
 -5       0.17578     host ceph-mon02
  2   hdd 0.07809         osd.2           up  1.00000 1.00000
  3   hdd 0.09769         osd.3           up  1.00000 1.00000
 -7       0.17578     host ceph-mon03
  4   hdd 0.07809         osd.4           up  1.00000 1.00000
  5   hdd 0.09769         osd.5           up  1.00000 1.00000
-11       0.17578     host node01
  8   hdd 0.07809         osd.8           up  1.00000 1.00000
  9   hdd 0.09769         osd.9           up  1.00000 1.00000
[cephadm@ceph-admin ceph-cluster]$
提示:从上面的输出信息我们可以看到每台主机上osd编号情况,以及每个OSD的权重;
检查mon节点状态
[cephadm@ceph-admin ceph-cluster]$ ceph mon stat
e3: 3 mons at {ceph-mon01=192.168.0.71:6789/0,ceph-mon02=192.168.0.72:6789/0,ceph-mon03=192.168.0.73:6789/0}, election epoch 18, leader 0 ceph-mon01, quorum 0,1,2 ceph-mon01,ceph-mon02,ceph-mon03
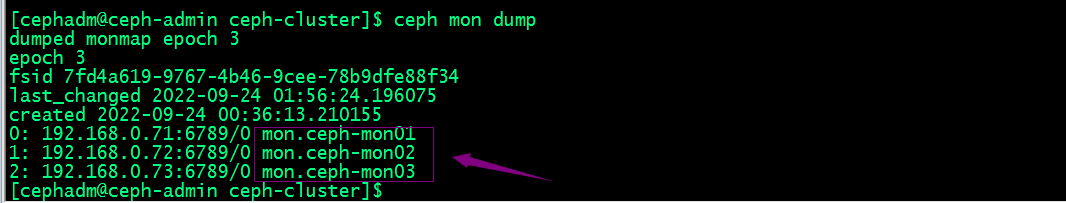
[cephadm@ceph-admin ceph-cluster]$ ceph mon dump
dumped monmap epoch 3
epoch 3
fsid 7fd4a619-9767-4b46-9cee-78b9dfe88f34
last_changed 2022-09-24 01:56:24.196075
created 2022-09-24 00:36:13.210155
0: 192.168.0.71:6789/0 mon.ceph-mon01
1: 192.168.0.72:6789/0 mon.ceph-mon02
2: 192.168.0.73:6789/0 mon.ceph-mon03
[cephadm@ceph-admin ceph-cluster]$
提示:上述两条命令都能显示出集群有多少个mon节点,以及对应节点的ip地址和监听端口,以及mon节点编号等信息;ceph mon stat除了能显示有多少mon节点和mon的详细信息外,它还显示领导节点的编号,以及选举次数;
查看仲裁状态
[cephadm@ceph-admin ceph-cluster]$ ceph quorum_status
{"election_epoch":18,"quorum":[0,1,2],"quorum_names":["ceph-mon01","ceph-mon02","ceph-mon03"],"quorum_leader_name":"ceph-mon01","monmap":{"epoch":3,"fsid":"7fd4a619-9767-4b46-9cee-78b9dfe88f34","modified":"2022-09-24 01:56:24.196075","created":"2022-09-24 00:36:13.210155","features":{"persistent":["kraken","luminous","mimic","osdmap-prune"],"optional":[]},"mons":[{"rank":0,"name":"ceph-mon01","addr":"192.168.0.71:6789/0","public_addr":"192.168.0.71:6789/0"},{"rank":1,"name":"ceph-mon02","addr":"192.168.0.72:6789/0","public_addr":"192.168.0.72:6789/0"},{"rank":2,"name":"ceph-mon03","addr":"192.168.0.73:6789/0","public_addr":"192.168.0.73:6789/0"}]}}
[cephadm@ceph-admin ceph-cluster]$
使用管理套接字查询集群状态
Ceph的管理套接字接口常用于查询守护进程,套接字默认保存 于/var/run/ceph目录,此接口的使用不能以远程方式进程,只能在对应节点上使用;
命令的使用格式:ceph --admin-daemon /var/run/ceph/socket-name 命令;比如获取帮助信息 ceph --admin-daemon /var/run/ceph/socket-name help
[root@ceph-mon01 ~]# ceph --admin-daemon /var/run/ceph/ceph-osd.0.asok help
{
    "calc_objectstore_db_histogram": "Generate key value histogram of kvdb(rocksdb) which used by bluestore",
    "compact": "Commpact object store's omap. WARNING: Compaction probably slows your requests",
    "config diff": "dump diff of current config and default config",
    "config diff get": "dump diff get <field>: dump diff of current and default config setting <field>",
    "config get": "config get <field>: get the config value",
    "config help": "get config setting schema and descriptions",
    "config set": "config set <field> <val> [<val> ...]: set a config variable",
    "config show": "dump current config settings",
    "config unset": "config unset <field>: unset a config variable",
    "dump_blacklist": "dump blacklisted clients and times",
    "dump_blocked_ops": "show the blocked ops currently in flight",
    "dump_historic_ops": "show recent ops",
    "dump_historic_ops_by_duration": "show slowest recent ops, sorted by duration",
    "dump_historic_slow_ops": "show slowest recent ops",
    "dump_mempools": "get mempool stats",
    "dump_objectstore_kv_stats": "print statistics of kvdb which used by bluestore",
    "dump_op_pq_state": "dump op priority queue state",
    "dump_ops_in_flight": "show the ops currently in flight",
    "dump_osd_network": "Dump osd heartbeat network ping times",
    "dump_pgstate_history": "show recent state history",
    "dump_reservations": "show recovery reservations",
    "dump_scrubs": "print scheduled scrubs",
    "dump_watchers": "show clients which have active watches, and on which objects",
    "flush_journal": "flush the journal to permanent store",
    "flush_store_cache": "Flush bluestore internal cache",
    "get_command_descriptions": "list available commands",
    "get_heap_property": "get malloc extension heap property",
    "get_latest_osdmap": "force osd to update the latest map from the mon",
    "get_mapped_pools": "dump pools whose PG(s) are mapped to this OSD.",
    "getomap": "output entire object map",
    "git_version": "get git sha1",
    "heap": "show heap usage info (available only if compiled with tcmalloc)",
    "help": "list available commands",
    "injectdataerr": "inject data error to an object",
    "injectfull": "Inject a full disk (optional count times)",
    "injectmdataerr": "inject metadata error to an object",
    "list_devices": "list OSD devices.",
    "log dump": "dump recent log entries to log file",
    "log flush": "flush log entries to log file",
    "log reopen": "reopen log file",
    "objecter_requests": "show in-progress osd requests",
    "ops": "show the ops currently in flight",
    "perf dump": "dump perfcounters value",
    "perf histogram dump": "dump perf histogram values",
    "perf histogram schema": "dump perf histogram schema",
    "perf reset": "perf reset <name>: perf reset all or one perfcounter name",
    "perf schema": "dump perfcounters schema",
    "rmomapkey": "remove omap key",
    "set_heap_property": "update malloc extension heap property",
    "set_recovery_delay": "Delay osd recovery by specified seconds",
    "setomapheader": "set omap header",
    "setomapval": "set omap key",
    "smart": "probe OSD devices for SMART data.",
    "status": "high-level status of OSD",
    "trigger_deep_scrub": "Trigger a scheduled deep scrub ",
    "trigger_scrub": "Trigger a scheduled scrub ",
    "truncobj": "truncate object to length",
    "version": "get ceph version"
}
[root@ceph-mon01 ~]#
比如获取mon01的版本信息
[root@ceph-mon01 ~]# ceph --admin-daemon /var/run/ceph/ceph-mon.ceph-mon01.asok version
{"version":"13.2.10","release":"mimic","release_type":"stable"}
[root@ceph-mon01 ~]#
获取osd的状态信息
[root@ceph-mon01 ~]# ceph --admin-daemon /var/run/ceph/ceph-osd.0.asok status
{
    "cluster_fsid": "7fd4a619-9767-4b46-9cee-78b9dfe88f34",
    "osd_fsid": "bf3649af-e3f4-41a2-a5ce-8f1a316d344e",
    "whoami": 0,
    "state": "active",
    "oldest_map": 1,
    "newest_map": 114,
    "num_pgs": 83
}
[root@ceph-mon01 ~]#
进程的运行时配置
我们可以使用ceph daemon命令来动态的配置ceph进程,即不停服务动态配置进程;
比如,获取osd.0的公网地址
[root@ceph-mon01 ~]# ceph daemon osd.0 config get public_addr
{
    "public_addr": "192.168.0.71:0/0"
}
[root@ceph-mon01 ~]#
获取帮助信息:命令格式:ceph daemon {daemon-type}.{id} help
[root@ceph-mon01 ~]# ceph daemon osd.1 help
{
    "calc_objectstore_db_histogram": "Generate key value histogram of kvdb(rocksdb) which used by bluestore",
    "compact": "Commpact object store's omap. WARNING: Compaction probably slows your requests",
    "config diff": "dump diff of current config and default config",
    "config diff get": "dump diff get <field>: dump diff of current and default config setting <field>",
    "config get": "config get <field>: get the config value",
    "config help": "get config setting schema and descriptions",
    "config set": "config set <field> <val> [<val> ...]: set a config variable",
    "config show": "dump current config settings",
    "config unset": "config unset <field>: unset a config variable",
    "dump_blacklist": "dump blacklisted clients and times",
    "dump_blocked_ops": "show the blocked ops currently in flight",
    "dump_historic_ops": "show recent ops",
    "dump_historic_ops_by_duration": "show slowest recent ops, sorted by duration",
    "dump_historic_slow_ops": "show slowest recent ops",
    "dump_mempools": "get mempool stats",
    "dump_objectstore_kv_stats": "print statistics of kvdb which used by bluestore",
    "dump_op_pq_state": "dump op priority queue state",
    "dump_ops_in_flight": "show the ops currently in flight",
    "dump_osd_network": "Dump osd heartbeat network ping times",
    "dump_pgstate_history": "show recent state history",
    "dump_reservations": "show recovery reservations",
    "dump_scrubs": "print scheduled scrubs",
    "dump_watchers": "show clients which have active watches, and on which objects",
    "flush_journal": "flush the journal to permanent store",
    "flush_store_cache": "Flush bluestore internal cache",
    "get_command_descriptions": "list available commands",
    "get_heap_property": "get malloc extension heap property",
    "get_latest_osdmap": "force osd to update the latest map from the mon",
    "get_mapped_pools": "dump pools whose PG(s) are mapped to this OSD.",
    "getomap": "output entire object map",
    "git_version": "get git sha1",
    "heap": "show heap usage info (available only if compiled with tcmalloc)",
    "help": "list available commands",
    "injectdataerr": "inject data error to an object",
    "injectfull": "Inject a full disk (optional count times)",
    "injectmdataerr": "inject metadata error to an object",
    "list_devices": "list OSD devices.",
    "log dump": "dump recent log entries to log file",
    "log flush": "flush log entries to log file",
    "log reopen": "reopen log file",
    "objecter_requests": "show in-progress osd requests",
    "ops": "show the ops currently in flight",
    "perf dump": "dump perfcounters value",
    "perf histogram dump": "dump perf histogram values",
    "perf histogram schema": "dump perf histogram schema",
    "perf reset": "perf reset <name>: perf reset all or one perfcounter name",
    "perf schema": "dump perfcounters schema",
    "rmomapkey": "remove omap key",
    "set_heap_property": "update malloc extension heap property",
    "set_recovery_delay": "Delay osd recovery by specified seconds",
    "setomapheader": "set omap header",
    "setomapval": "set omap key",
    "smart": "probe OSD devices for SMART data.",
    "status": "high-level status of OSD",
    "trigger_deep_scrub": "Trigger a scheduled deep scrub ",
    "trigger_scrub": "Trigger a scheduled scrub ",
    "truncobj": "truncate object to length",
    "version": "get ceph version"
}
[root@ceph-mon01 ~]#
提示:ceph daemon获取某个进程的信息时,需要在对应主机上用root执行命令;
动态设置进程参数有两种方式,一种是通过mon向对应进程发送配置,一种是通过admin socket发送配置给进程
通过mon向对应进程发送配置命令格式: ceph tell {daemon-type}.{daemon id or *} injectargs --{name} {value} [--{name} {value}]
[cephadm@ceph-admin ceph-cluster]$ ceph tell osd.1 injectargs '--debug-osd 0/5'
[cephadm@ceph-admin ceph-cluster]$
提示:这种方式可以在集群任意主机上执行;
通过admin socket的方式发送配置命令格式:ceph daemon {daemon-type}.{id} set {name} {value}
[root@ceph-mon01 ~]# ceph daemon  osd.0 config set debug_osd 0/5
{
    "success": ""
}
[root@ceph-mon01 ~]#
提示:这种方式只能在进程所在主机上执行;
停止或重启Ceph集群步骤
停止ceph集群步骤
1、告知Ceph集群不要将OSD标记为out,命令:ceph osd set noout
[cephadm@ceph-admin ceph-cluster]$ ceph osd set noout
noout is set
[cephadm@ceph-admin ceph-cluster]$
2、按如下顺序停止守护进程和节点:停止存储客户端--->网关,如rgw--->元数据服务器,MDS---> Ceph OSD---> Ceph Manager--->Ceph Monitor;然后关闭对应主机;
启动ceph集群步骤
1、以与停止过程相关的顺序启动节点:Ceph Monitor--->Ceph Manager--->Ceph OSD--->元数据服务器,MDS--->网关,如rgw---->存储客户端;
2、删除noout标志,命令ceph osd unset noout
[cephadm@ceph-admin ceph-cluster]$ ceph osd unset noout
noout is unset
[cephadm@ceph-admin ceph-cluster]$
提示:集群重新启动起来,需要将noout标记取消,以免但真正有osd故障时,能够将osd及时下线,避免将对应存取数据的操作调度到对应osd上进行操作而引发的故障;
ceph是一个对象存储集群,在生产环境中,如有不慎可能导致不可预估的后果,所以停止和启动顺序都非常重要;上述过程主要是尽量减少丢失数据的几率,但不保证一定不丢数据;
Ceph配置文件ceph.conf说明
[cephadm@ceph-admin ceph-cluster]$ cat /etc/ceph/ceph.conf
[global]
fsid = 7fd4a619-9767-4b46-9cee-78b9dfe88f34
mon_initial_members = ceph-mon01
mon_host = 192.168.0.71
public_network = 192.168.0.0/24
cluster_network = 172.16.30.0/24
auth_cluster_required = cephx
auth_service_required = cephx
auth_client_required = cephx

[cephadm@ceph-admin ceph-cluster]$
提示:ceph.conf配置文件严格遵守ini配置文件风格的语法和格式;其中井号‘#’和冒号‘;’用于注释;ceph.conf主要有[global]、[osd]、[mon]、[client]这4个配置段组成;其中global配置段适用于全局配置,即各组件的公共配置;【osd】配置段作用范围是集群所有osd都生效的配置;【mon】作用范围是集群所以mon都生效的配置;【client】作用范围是所有客户端,比如rbd、rgw;
mon和osd的独有配置段
上面的【osd】和【mon】配置段都是针对所有osd和mon生效,如果我们只想配置单独某一个osd或mon该怎么配置呢?ceph.conf中我们使用[type.ID]来表示某一个osd或mon的配置;比如,我们只想配置osd.0,则我们可以在配置段里写[osd.0]来表示该段配置只针对osd.0生效;同样mon也是同样的逻辑,不同于osd的是,mon的ID不是数字;我们可以使用ceph mon dump来查看mon的ID;
获取osd的编号
提示:osd的编号都是数字,从0开始;
ceph.conf配置段生效优先级
如果以上公共配置段里的配置和专用配置段的配置重复,则专用配置段覆盖公共配置段里的配置,即专用配置段里的配置生效;配置生效优先级顺序为:【global】小于【osd】、【mon】、【client】;【osd】小于【osd.ID】,【mon】小于【mon.a】;总之配置段作用范围越小,越优先生效;
ceph配置文件生效优先级
ceph启动时会按如下顺序查找配置文件
1、$CEPH_CONF:该环境变量所指定的配置文件;
2、-c path/path :命令行使用-c选项指定的配置文件路径;
3、/etc/ceph/ceph.conf:默认配置文件路径
4、~/.ceph/config:当前用户家目录下.ceph/config文件
5、./ceph.conf :当前用户所在目录下的ceph.conf文件
配置文件生效顺序是$CEPH_CONF---->-c path/path ---->/etc/ceph/ceph.conf---->~/.ceph/config---->./ceph.conf ;
Ceph配置文件常用的元参数
ceph配置文件支持用元参数来替换对应配置信息,比如$cluster就表示当前Ceph集群的名称;$type表示当前服务的类型名称;比如osd、mon;$id表示守护进程的标识符,比如以osd.0来说,它的标识符就是0;$host表示守护进程所在主机的主机名;$name表示当前服务的类型名称和进程标识符的组合;即$name=$type.$id;

 浙公网安备 33010602011771号