综合案例 --- 音频可视化
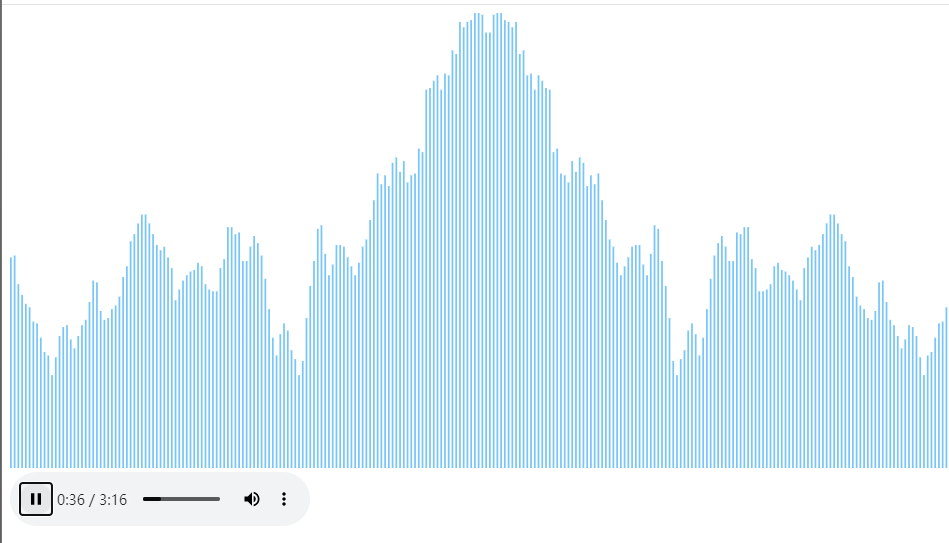
1. 效果图
2. 知识点
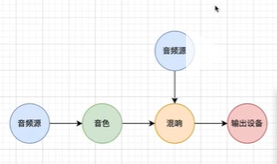
1. 音频节点
就是音频处理中的一个环节, 源节点表示音频数据的来源, 一个音频的所有处理流程就是音频上下文
2. 频谱分析

3. 代码实现
index.html
<!DOCTYPE html>
<html lang="en">
<head>
    <meta charset="UTF-8">
    <title>Title</title>
    <link rel="stylesheet" href="./index.css">
</head>
<body>
<canvas></canvas>
<audio src="./1.mp3" controls></audio>
<script src="./index.js"></script>
</body>
</html>
index.js
const audioEle = document.querySelector("audio");
const cvs = document.querySelector("canvas");
console.log(cvs)
const ctx = cvs.getContext("2d")

// 初始化 canvas 的尺寸
function initCvs() {
    cvs.width = window.innerWidth * devicePixelRatio;
    cvs.height = (window.innerHeight / 2) * devicePixelRatio;
}

initCvs()

let isInit = false
let dataArray, analyser

audioEle.addEventListener("play", function () {
    // 初始化
    if (isInit) return;

    // 初始化
    const audCtx = new AudioContext();  // 创建一个音频上下文
    const source = audCtx.createMediaElementSource(audioEle); // 创建一个音频源节点
    analyser = audCtx.createAnalyser()  // 创建一个分析器节点

    analyser.fftSize = 512;  // 设置做快速傅里叶变换的窗口大小, 默认2048, 必须是2的n次幂
    dataArray = new Uint8Array(analyser.frequencyBinCount) // 创建字节数组,用于接收分析器节点的分析数据


    source.connect(analyser);  // 将源节点连接到分析器节点
    analyser.connect(audCtx.destination);  // 将分析器节点连接到输出设备节点
    isInit = true;
});

// 把分析出的波形, 绘制到 canvas 上
function draw() {
    requestAnimationFrame(draw);  // 随着音乐的播放, 不断绘制

    // 清空画布
    const {width, height} = cvs;
    ctx.clearRect(0, 0, width, height);

    // 让分析器节点分析出数据到数组中
    if(!isInit) return;
    analyser.getByteFrequencyData(dataArray)
    const len = dataArray.length / 2;   // 由于很多高音部分,人的耳朵是听不到的, 所以要放大两倍
    const barWidth = width / len / 2;  // 每条的宽度, 后面要画对称图形, 所以 再除以2
    ctx.fillStyle = "#78C5F7"  // 画笔颜色
    for (let i = 0; i < len; i++) {
        const data = dataArray[i];
        const barHeight = data / 255 * height;  // 每条的高度
        const x1 = i * barWidth + width / 2;   // 右半边横坐标
        const x2 = width / 2 - (i + 1) * barWidth; // 左半边横坐标
        const y = height - barHeight; // 纵坐标
        ctx.fillRect(x1, y, barWidth - 2, barHeight);  // 开始画制, -2 是为了中间有点缝隙
        ctx.fillRect(x2, y, barWidth - 2, barHeight);  // 开始画制
    }
}

draw()
python防脱发技巧

 浙公网安备 33010602011771号