python中使用keras训练mnist模型,用yellowbrick绘制模型的confusion_matrix(混淆矩阵)可视化
代码如下:
  1 import lmdb
  2 import numpy as np
  3 import tensorflow as tf
  4 import binascii
  5 import caffe
  6 import matplotlib.pyplot as plt
  7 import PIL.Image
  8 from io import BytesIO
  9
 10 import keras
 11 from keras import Sequential
 12 from keras.layers import Dense, Flatten, Dropout, MaxPool2D, Conv2D
 13 from keras.layers.normalization import BatchNormalization
 14
 15 from sklearn.metrics import confusion_matrix
 16 from sklearn.preprocessing import LabelEncoder
 17 from yellowbrick.style.palettes import color_sequence
 18 from yellowbrick.style import find_text_color
 19
 20
 21 cmap = color_sequence("YlOrRd")
 22
 23 with open('/workspace/jobs/20200114-013226-34ca/val.txt', 'r') as f:
 24     l = f.readlines()
 25
 26 y_test = []
 27 for i in l:
 28     y_test.append(int(i.split(' ')[1][0]))
 29
 30 y = np.array(y_test)
 31 labels = np.unique(y)
 32
 33 env_db = lmdb.open('/workspace/jobs/20200114-013226-34ca/val_db')
 34
 35 input_ids = []
 36 input_data = []
 37
 38 with env_db.begin() as txn:
 39     cursor = txn.cursor()
 40
 41     for key, value in cursor:
 42         datum = caffe.proto.caffe_pb2.Datum()
 43         datum.ParseFromString(value)
 44         s = BytesIO()
 45         s.write(datum.data)
 46         s.seek(0)
 47         img = PIL.Image.open(s)
 48         img = np.array(img)
 49         img = img.flatten()
 50
 51         input_ids.append(key)
 52         input_data.append(img)
 53
 54 y_train = np.asarray(input_data)
 55 y_train = y_train.reshape(-1, 28, 28, 1)
 56
 57 # keras mnist network
 58 model = Sequential()
 59 model.add(Conv2D(32, kernel_size=(3, 3),activation='relu',kernel_initializer='he_normal',input_shape=(28,28,1)))
 60 model.add(Conv2D(32, kernel_size=(3, 3),activation='relu',kernel_initializer='he_normal'))
 61 model.add(MaxPool2D((2, 2)))
 62 model.add(Dropout(0.20))
 63 model.add(Conv2D(64, (3, 3), activation='relu',padding='same',kernel_initializer='he_normal'))
 64 model.add(Conv2D(64, (3, 3), activation='relu',padding='same',kernel_initializer='he_normal'))
 65 model.add(MaxPool2D(pool_size=(2, 2)))
 66 model.add(Dropout(0.25))
 67 model.add(Conv2D(128, (3, 3), activation='relu',padding='same',kernel_initializer='he_normal'))
 68 model.add(Dropout(0.25))
 69 model.add(Flatten())
 70 model.add(Dense(128, activation='relu'))
 71 model.add(BatchNormalization())
 72 model.add(Dropout(0.25))
 73
 74 model.add(Dense(10, activation='softmax'))
 75
 76 model.compile(loss='mse',
 77               optimizer=keras.optimizers.RMSprop(),
 78               metrics=['accuracy'])
 79
 80 y2 = keras.utils.to_categorical(y, 10)
 81 model.fit(y_train, y2, epochs=100, batch_size=32)
 82
 83 y_pred = model.predict_classes(y_train)
 84
 85 yp = np.asarray(y)
 86 if yp.dtype.kind in {"i", "u"}:
 87     idx = yp
 88 else:
 89     idx = LabelEncoder().fit_transform(yp)
 90 y_true = np.asarray(labels)[idx]
 91
 92 yp = np.asarray(y_pred)
 93 if yp.dtype.kind in {"i", "u"}:
 94     idx = yp
 95 else:
 96     idx = LabelEncoder().fit_transform(yp)
 97 y_pred = np.asarray(labels)[idx]
 98
 99 c_m = confusion_matrix(y_true, y_pred, labels=labels)
100
101 print("c_m >>>>>>> \n", c_m)
102
103 class_count = dict(zip(*np.unique(y_true, return_counts=True)))
104 selected_class_counts = []
105 for c in labels:
106     try:
107         selected_class_counts.append(class_count[c])
108     except KeyError:
109         selected_class_counts.append(0)
110 class_counts = np.array(selected_class_counts)
111
112 cm_display = c_m[::-1, ::]
113 n_classes = len(labels)
114 X, Y = np.arange(n_classes + 1), np.arange(n_classes + 1)
115
116 ax = plt.gca()
117
118 ax.set_ylim(bottom=0, top=cm_display.shape[0])
119 ax.set_xlim(left=0, right=cm_display.shape[1])
120
121 xticklabels = labels
122 yticklabels = labels[::-1]
123 ticks = np.arange(n_classes) + 0.5
124
125 ax.set(xticks=ticks, yticks=ticks)
126 ax.set_xticklabels(xticklabels, rotation="vertical")
127 ax.set_yticklabels(yticklabels)
128
129 edgecolors = []
130
131 for x in X[:-1]:
132     for y in Y[:-1]:
133         value = cm_display[x, y]
134         svalue = "{:0.0f}".format(value)
135
136         base_color = cmap(value / cm_display.max())
137         text_color = find_text_color(base_color)
138
139         if cm_display[x, y] == 0:
140             text_color = "0.75"
141
142         cx, cy = x + 0.5, y + 0.5
143         ax.text(
144             cy,
145             cx,
146             svalue,
147             va="center",
148             ha="center",
149             color=text_color
150         )
151         lc = "k" if xticklabels[x] == yticklabels[y] else "w"
152         edgecolors.append(lc)
153
154 vmin = 0.00001
155 vmax = cm_display.max()
156
157 ax.pcolormesh(
158     X,
159     Y,
160     cm_display,
161     vmin=vmin,
162     vmax=vmax,
163     edgecolor=edgecolors,
164     cmap=cmap,
165     linewidth="0.01",
166 )
167
168 # plt.show()
169 plt.savefig("/data/domon/confusion_matrix.png")
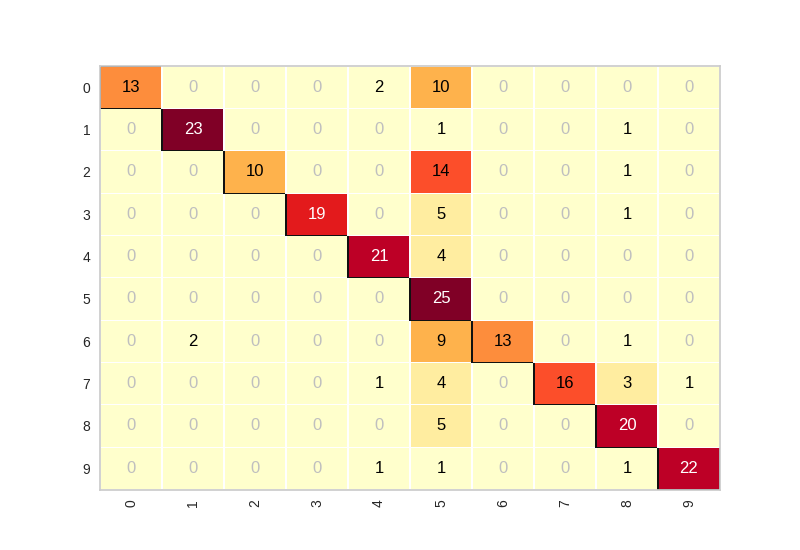
其实yellowbrick中有api可以直接实现,以上代码为拆解源码,实现自定义网络与自定义数据集来实现混淆矩阵的模型可视化。
yellowbrick实现如下:
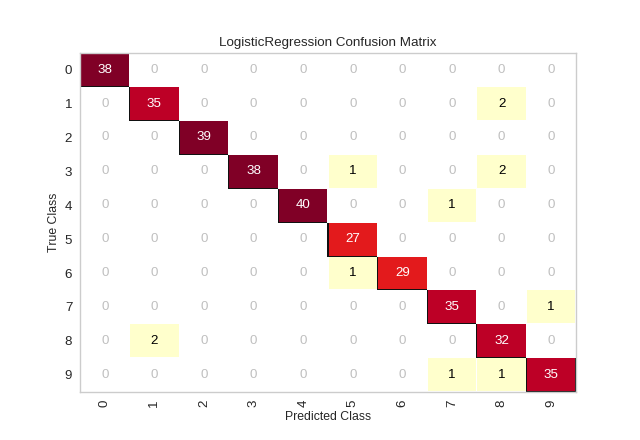
from sklearn.datasets import load_digits
from sklearn.model_selection import train_test_split as tts
from sklearn.linear_model import LogisticRegression
from yellowbrick.classifier import ConfusionMatrix

# 将特征为8*8的像素图像转为单个特征数组X,标签为y
digits = load_digits()
X = digits.data
y = digits.target

X_train, X_test, y_train, y_test = tts(X, y, test_size =0.2, random_state=11)

model = LogisticRegression(multi_class="auto", solver="liblinear")

# 创建混淆矩阵模型
cm = ConfusionMatrix(model, classes=[0,1,2,3,4,5,6,7,8,9])

# 训练模型
cm.fit(X_train, y_train)

# score方法内对测试数据进行预测,并从scikit-learn创建confusion_matrix图像
cm.score(X_test, y_test)

# 显示图片
cm.show()
yellowbrick混淆矩阵可视化结果:
自定义-混淆矩阵可视化结果(模型 epochs=50,测试图片数量:250张):
有需要改进的地方请提示,谢谢!

 浙公网安备 33010602011771号