
line_profiler,Python代码性能分析库
工作中某些函数运行特别慢,但用普通的性能分析工具只能看到函数级别的统计,无法定位到具体哪行代码是性能瓶颈。line_profiler,它能精确到每一行代码的执行时间,让性能优化工作变得简单高效。
通过使用line_profiler,可以:
- 精确定位代码瓶颈
- 量化优化效果
安装和配置
pip install line_profiler -i http://mirrors.aliyun.com/pypi/simple/ --trusted-host mirrors.aliyun.com
安装完成后,会得到两个命令行工具:kernprof和line_profiler。kernprof用于收集性能数据,而line_profiler用于分析结果。
基本用法
line_profiler的使用方法非常优雅。只需要用@profile装饰器标记要分析的函数:
from line_profiler.explicit_profiler import profile


@profile
def slow_function():
    result = []
    for i in range(10000):
        result.append(i ** 2)
    return sum(result)


if __name__ == '__main__':
    slow_function()
在命令行运行:
kernprof -l -v test.py
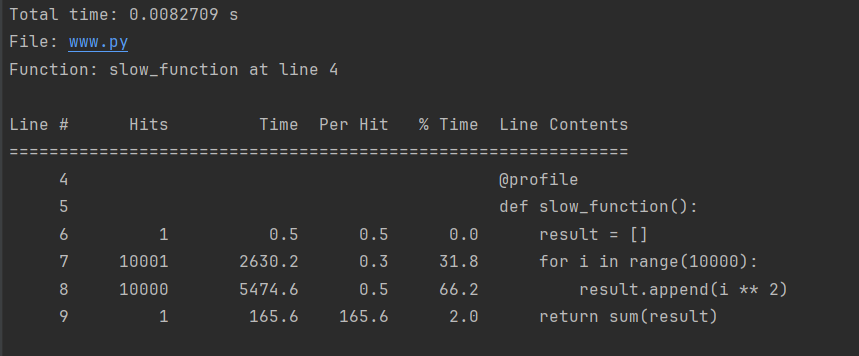
Total time:当前函数的时间消耗,单位是秒。
File:当前函数所在文件名。
Function:当前函数的函数名以及在文件中的位置。
Line #:代码所在行号。
Hits:在执行过程中,该行代码执行次数,即命中数。
Time:在执行过程中,该行代码执行的总时间,默认单位是微秒。
Per Hit:在执行过程中,平均每次执行该行代码所耗时间,默认单位是微秒。
% Time:执行该行代码所耗总时间占执行当前函数所耗总时间的百分比。
Line Contents:该行代码的内容。
高级功能
1. 动态分析:除了装饰器方式,还可以在运行时动态分析代码
from line_profiler import LineProfiler


def slow_function():
    for i in range(100):
        sum([i ** 2 for i in range(100)])


profiler = LineProfiler()
profiler_wrapper = profiler(slow_function)
profiler_wrapper()
profiler.print_stats()
2. 多函数分析:可以同时分析多个函数的性能:
from line_profiler import LineProfiler


def func1():
    for i in range(10):
        sum([i ** 2 for i in range(10)])


def func2():
    for i in range(20):
        sum([i ** 2 for i in range(20)])


profiler = LineProfiler()
profiler.add_function(func1)
profiler.add_function(func2)
# 运行并分析 func1
profiler.runcall(func1)
profiler.runcall(func2)
# 打印统计信息
profiler.print_stats()

 浙公网安备 33010602011771号