

Applied Nonparametric Statistics-lec10
Ref:https://onlinecourses.science.psu.edu/stat464/print/book/export/html/14
估计CDF
The Empirical CDF
绘制empirical cdf的图像:
x = c(4, 0, 3, 2, 2)
plot.ecdf(x)

Kolmogorov-Smirnov test
testing the "sameness" of two independent samples from a continuous distribution
大的p-value可以说明不同,但小的p-value不能说明相同
样本数量较小时,p-value可能偏大
> x = c(4, 0, 3, 2, 2)
> plot.ecdf(x)
> plot(ecdf(x))
> ecdf(x)
Empirical CDF
Call: ecdf(x)
 x[1:4] =      0,      2,      3,      4
> ks.test(x, y="pnorm", mean(x), sd(x))

        One-sample Kolmogorov-Smirnov test

data:  x
D = 0.24637, p-value = 0.9219
alternative hypothesis: two-sided

Warning message:
In ks.test(x, y = "pnorm", mean(x), sd(x)) :
  Kolmogorov - Smirnov检验里不应该有连结
Ps:
在R中,与正态分布相关的有四个函数。dnorm是pdf,pnorm是cdf,qnorm是the inverse cumulative density function (quantiles)
rnorm是randomly generated numbers
关于qnorm,它给定一个概率,返回cdf对应的值。如果使用标准正态分布的,那么给定一个概率,返回的就是Z-score
dnorm(x, mean = 0, sd = 1, log = FALSE)
pnorm(q, mean = 0, sd = 1, lower.tail = TRUE, log.p = FALSE)
qnorm(p, mean = 0, sd = 1, lower.tail = TRUE, log.p = FALSE)
rnorm(n, mean = 0, sd = 1)
Density Estimation
> x
[1] 4 0 3 2 2
> density(x)

Call:
        density.default(x = x)

Data: x (5 obs.);       Bandwidth 'bw' = 0.4868

       x                 y
 Min.   :-1.4604   Min.   :0.001837
 1st Qu.: 0.2698   1st Qu.:0.059033
 Median : 2.0000   Median :0.141129
 Mean   : 2.0000   Mean   :0.144277
 3rd Qu.: 3.7302   3rd Qu.:0.205314
 Max.   : 5.4604   Max.   :0.351014
> plot(density(x))


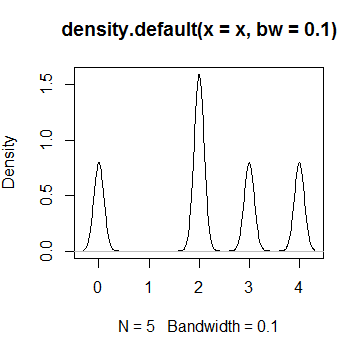
如果在density(x)里面加上bandwidth参数,那么图片会发生变化,如上图所示。

 浙公网安备 33010602011771号