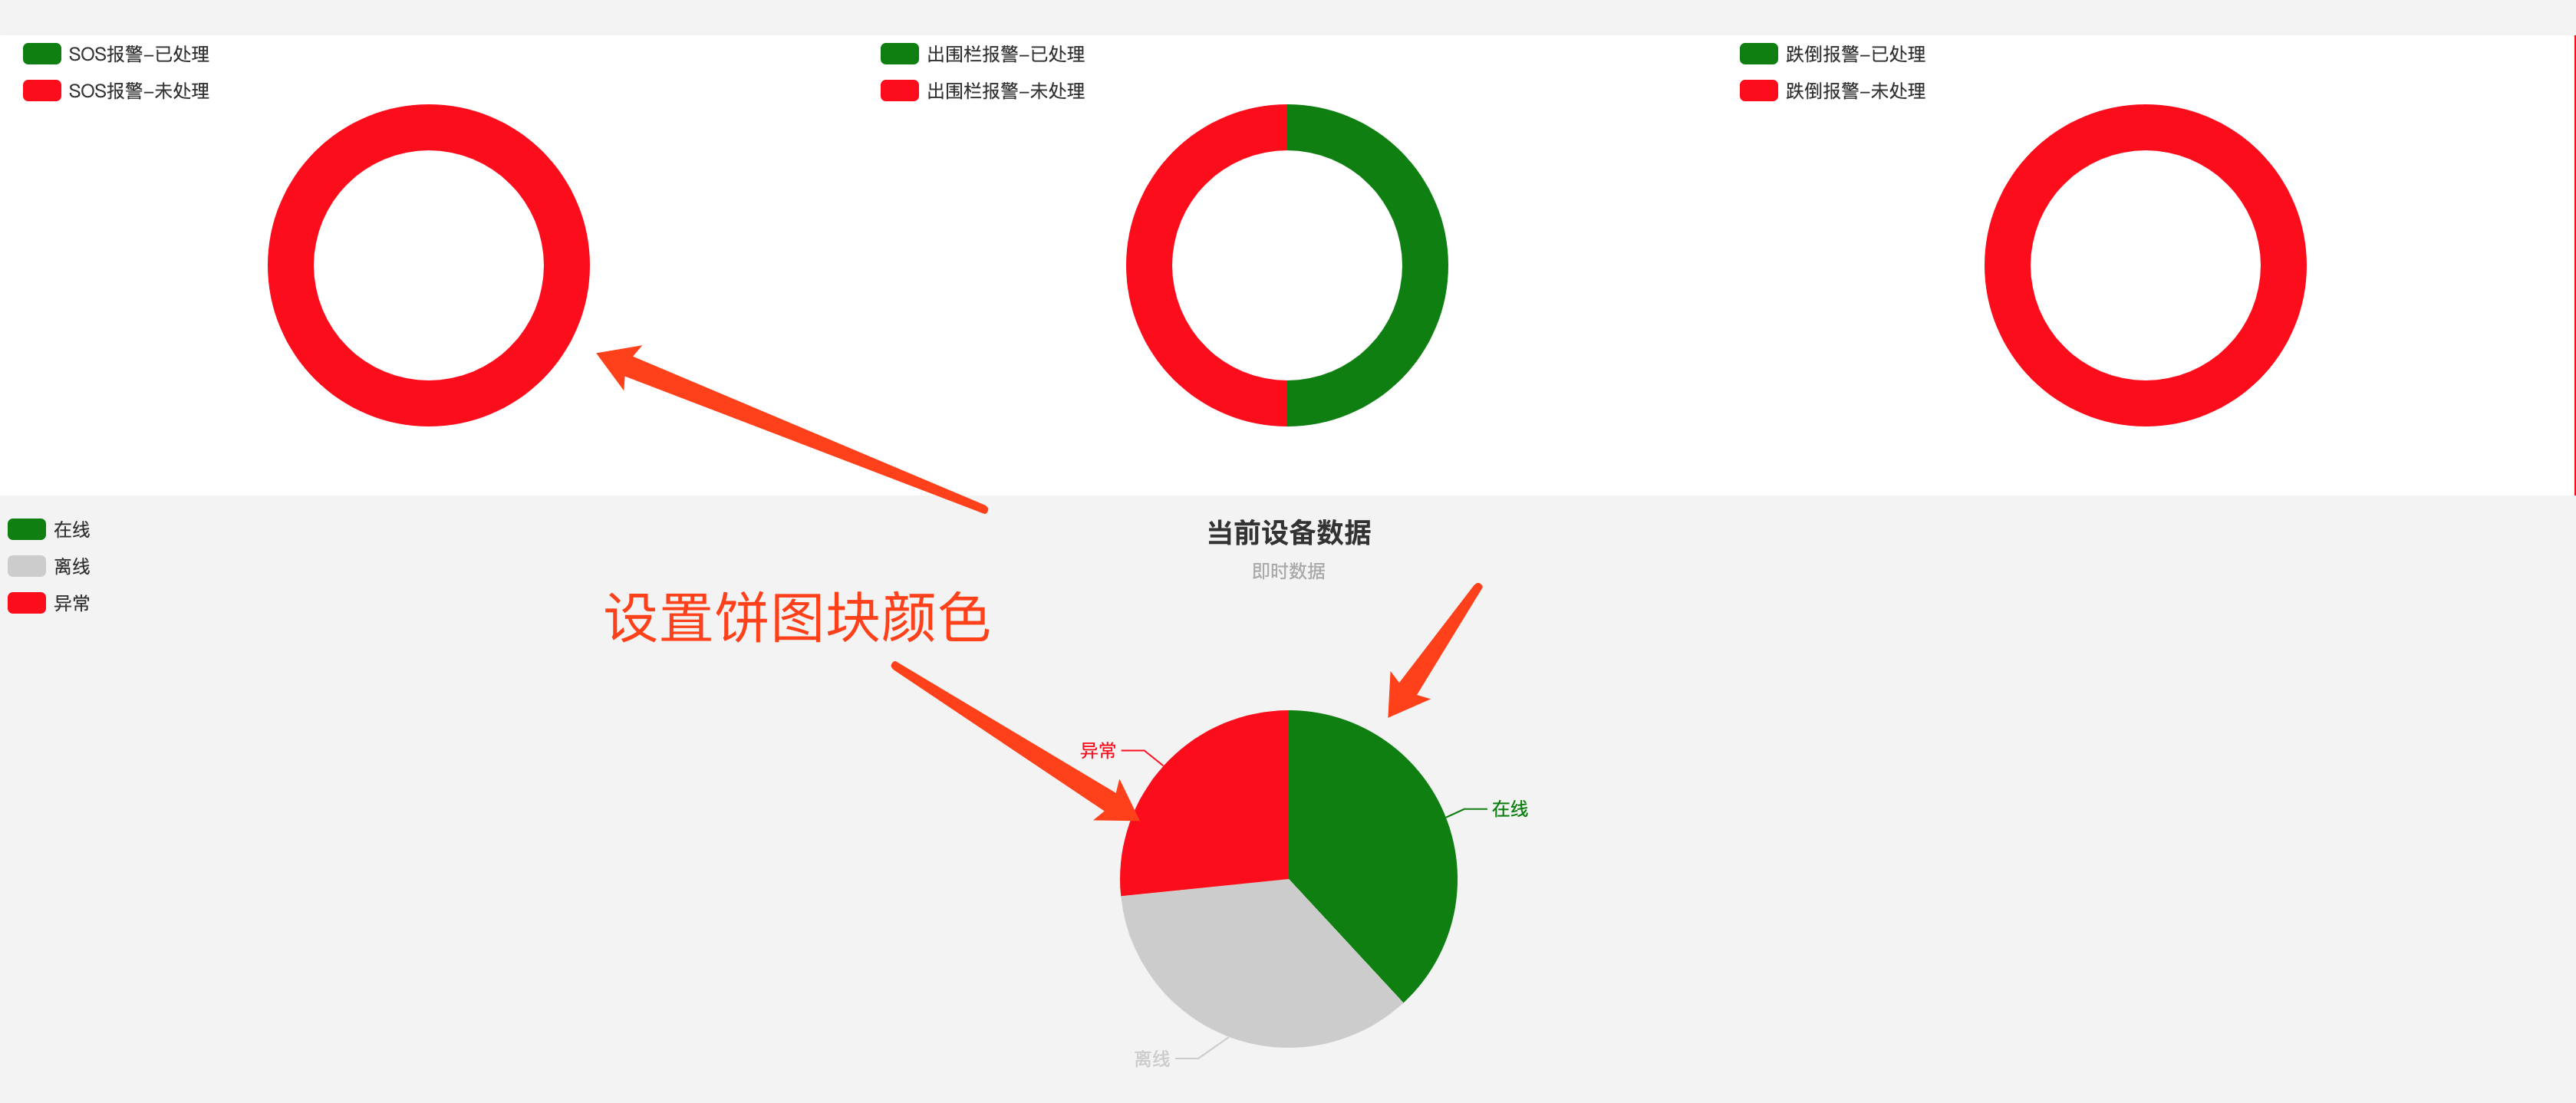
echarts pie饼图块颜色设置


 上代码:


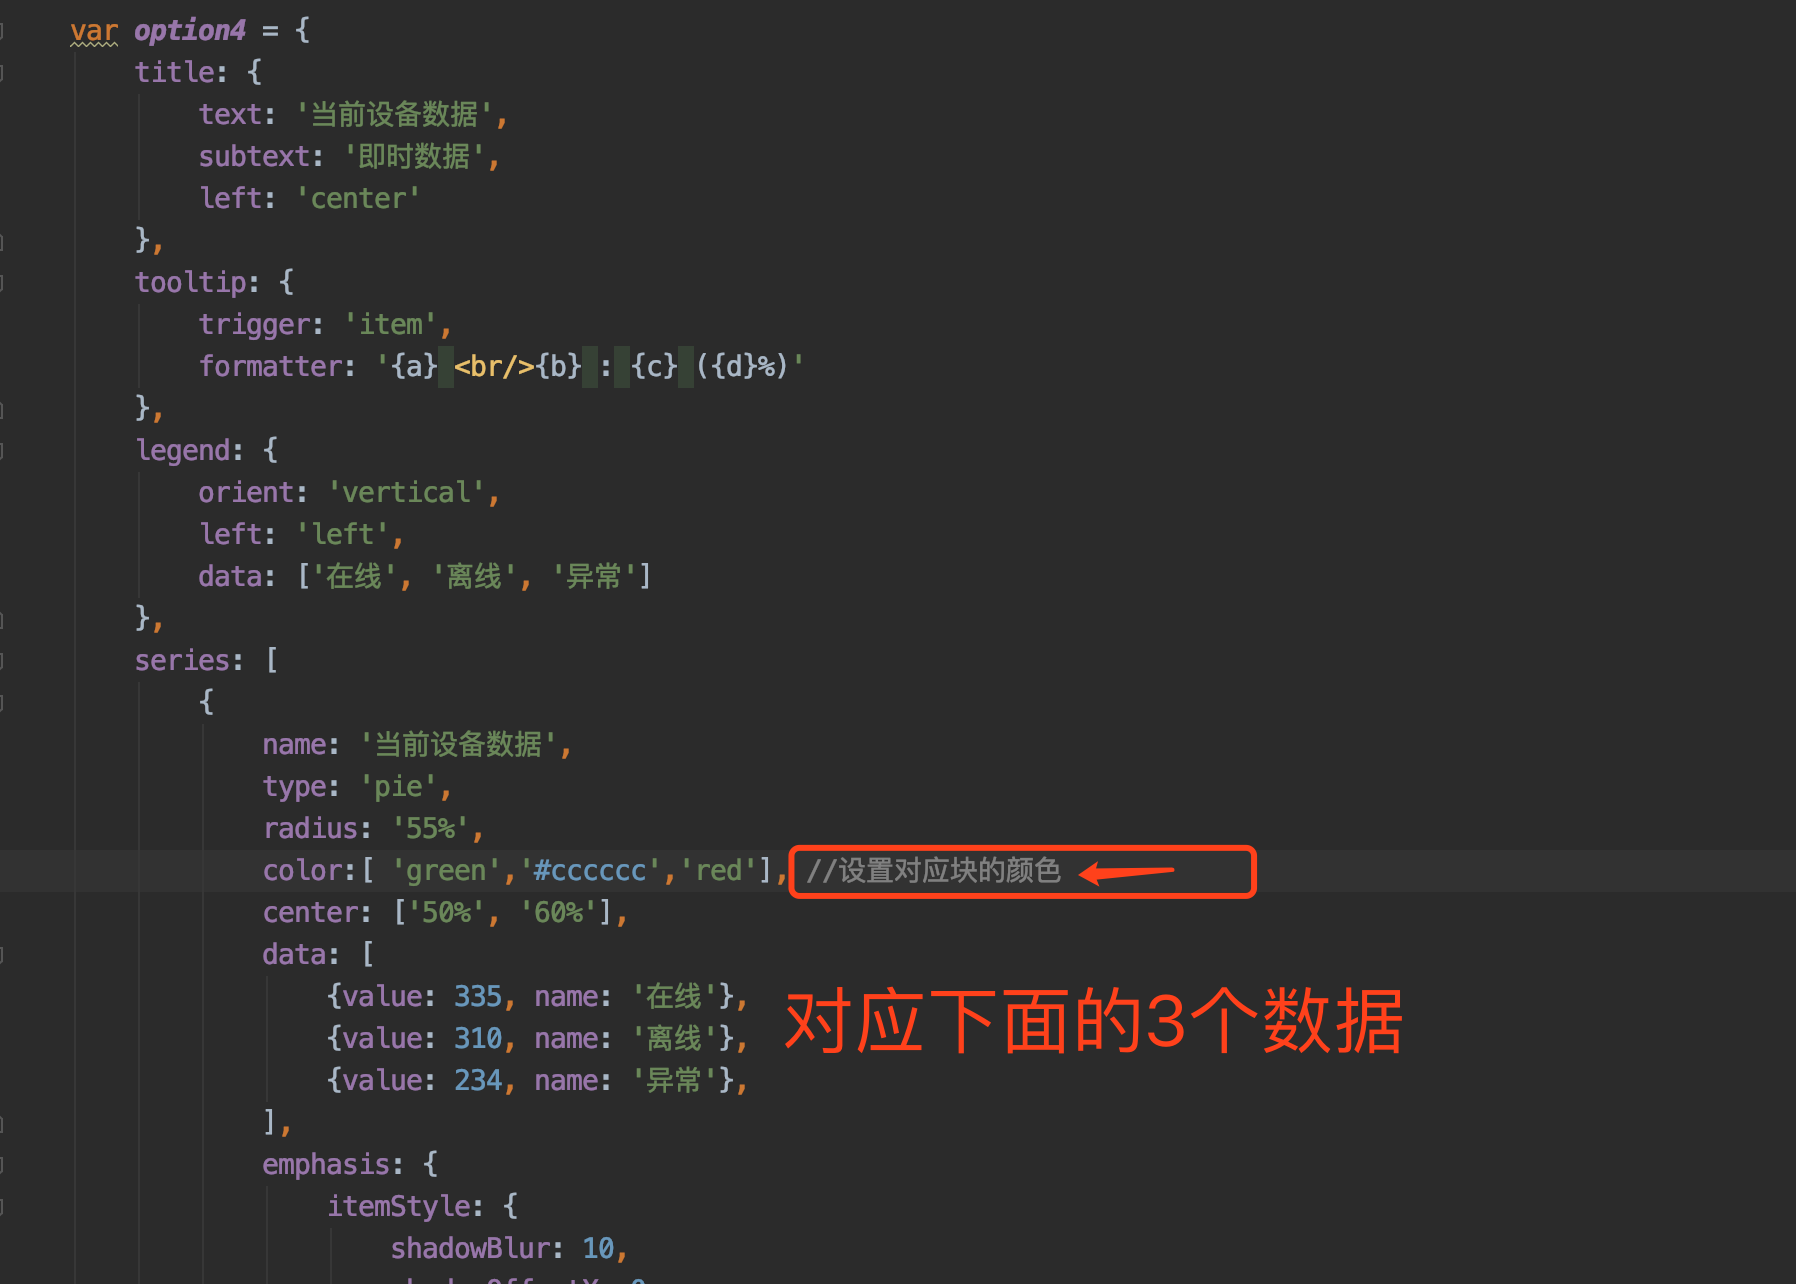
 var option = {
            tooltip: {
                trigger: 'item',
                formatter: '{a} <br/>{b}: {c} ({d}%)'
            },
            legend: {
                orient: 'vertical',
                left: 10,
                data: array
            },
            series: [
                {
                    name: '报警数据统计',
                    type: 'pie',
                    color:[ 'green','red'], //设置对应块的数据
                    radius: ['50%', '70%'],
                    avoidLabelOverlap: false,
                    label: {
                        normal: {
                            show: false,
                            position: 'center'
                        },
                        emphasis: {
                            show: true,
                            textStyle: {
                                fontSize: '16',
                                fontWeight: 'bold'
                            }
                        }
                    },
                    labelLine: {
                        normal: {
                            show: false
                        }
                    },
                    data:data
                }
            ]
        };
        var myChart = echarts.init(document.getElementById(id));
        myChart.setOption(option);
posted @ 2020-01-13 13:16  php+人工智障  阅读(3363)  评论(0编辑  收藏  举报