中间件测试
mysql测试
mysql需要安装一个测试工具sysbench
操作系统需要是centos7
路径:

tar xf sysbench.tar.gz
 yum install  ./*.rpm
这个工具安装完成之后会在/usr/share/sysbench生成很多lua脚本提供压力测试
[root@iZbp1hvphr2ekyo7x52pibZ ~]# sysbench --help
  sysbench 使用语法如下:
       sysbench [options]... [testname] [command]
  其中:
  options 为参数选项
  testname 指定基准测试 oltp*.lua 脚本
  command 是要执行什么样的操作
  下面对这三部分分别进行说明
  1. command 命令
    sysbench 的 command 是控制命令,包含以下几个选项:
    prepare, prewarm, run, cleanup, help
    其中:
    prepare 表示测试前准备,主要创建表,生成初始测试数据
    prewarm 表示测试前进行预热
    run 表示执行测试,根据各种测试场景进行测试
    cleanup 表示测试完后清理测试数据
    help 获取帮助文档

  2. testname 测试选项
    sysbench 的 testname 是表示要测试的场景,目前 sysbench 自带的针对 mysql
    oltp 测试场景有如下几种:
oltp_delete.lua 删除测试
oltp_insert.lua 插入测试
oltp_point_select.lua 主键查询测试
oltp_read_only.lua 只读测试
oltp_read_write.lua 读写测试
oltp_update_index.lua 更新索引测试
oltp_update_non_index.lua 更新非索引测试
oltp_write_only.lua 只写测试
select_random_points.lua 随机多个查询(in 里面多个查询条件)
select_random_ranges.lua 随机范围查询(between … and …)

  3. options 选项
  sysbench 的 options 里面包含测试需要的各种参数,包括初始化、预热、运行以及不同测试场景中需要的参数,具体如下:
  1)  通用选项
    选项 描述 默认值
--threads=N 线程数 默认为1
--events=N 请求数限制,0 代表无限制 默认为0
--time=N 测试执行时长(单位:秒)限制 默认为10
--forced-shutdown=STRING 超过--time 后,强制中断测试(off 代表不启用,on代表启用)默认为off
--thread-stack-size=SIZE 每个线程的堆栈大小(k、M、G 单位都可)默认为64K
--report-interval=N 每 N 秒输出一份中间统计结果, 0 表示不输出中间统计结果 默认为0
--tx-rate=N 已经废弃,被--rate 取代 0
--max-requests=N 已经废弃,被--events 取代 0
--max-time=N 已经废弃,被--time 取代 0
--num-threads=N 已经废弃,被--threads 取代 1

  2)  伪随机数发生器
    选项 描述 默认值
--rand-type=STRING 随机数分布(uniform、gaussian、special、pareto)默认为special
--rand-spec-iter=N 用于数字生成的迭代次数 默认为12
--rand-spec-pct 被当作 special 值所占百分比 默认1
--rand-spec-res=N 多少比例的 special 值被使用 默认为75
--rand-seed=N 随机发生器种子,为 0 时,使用当前时间作为随机种子 默认为0
--rand-pareto-h=N 是用 pareto 分布时的 h 参数 默认为0.2

  3) 日志选项
    日志选项
    选项 描述 默认值
--verbosity=N 信息级别(5-debug、0-关键信息) 默认为3
--percentile=N 取百分比段位延迟进行统计计算(1-100) 默认为95
--histogram[=on|off] 在报告中打印延迟直方图 off

  4)  数据库选项
    通用数据库选项
    选项 描述 默认值
    --db-driver=STRING
    指定数据库驱动,默认安装支持:
      mysql - MySQL driver
      pgsql - PostgreSQL driver
    --db-ps-mode=STRING prepare 语句使用(auto、disable) 默认为auto
    --db-debug[=on|off] 是否打印数据库特有的调试信息 默认为off

  mysql 选项
  选项 描述 默认值
--mysql-host=[LIST,...] mysql 主机 localhost
--mysql-port=[LIST,...] mysql 端口 3306
--mysql-socket=[LIST,...] mysql 本地 socket 路径
--mysql-user=STRING mysql 测试用户 sbtest
--mysql-password=STRING mysql 测试用户密码
--mysql-db=STRING mysql 测试库名 sbtest
--mysql-ssl[=on|off] 如果客户端支持,是否使用 SSL 连接 Off
--mysql-ssl-cipher=STRING 使用 SSL 连接的特定密码
--mysql-compression[=on|off] 如果客户端支持,是否使用压缩 Off
--mysql-debug[=on|off] 追踪所有客户端的调用 Off
--mysql-ignore-errors=[LIST,...] 忽略错误列表(比如 1213,1020,1205,或者 all)
--mysql-dry-run[=on|off] 只运行,假装所有的客户端调用都执行成功,实际并没有执行它们 默认为off

  oltp 选项
  选项 描述 默认值
--test=STRING 指定 oltp 测试的 lua 脚本:
--table-size 单表记录数,取代--oltp-table-size 10000
--range-size 范围查询时的范围 100
--tables 表数量,取代--oltp-tables-count 1
--point-selects 主键查询测试时,每事务查询语句数 10
--simple-ranges 简单范围查询,每事务查询语句数 1
--sum-ranges 每个事务中 sum()查询语句数 1
--order-ranges 每个事务中 order by 查询语句数 1
--distinct-ranges 每个事务中 distinct 查询语句数 1
--index-updates 每个事务中更新索引语句数 1
--non-index-updates 每个事务中更新非索引字段语句数 1
--delete-inserts 每个事务中 delete/insert 语句数 1
--range-selects 是否开启所有的范围查询 true
--auto-inc 是否使用自增列 true
--skip-trx 不显式开启事务,所有查询使用autocommit 模式 false
--secondary 是否使用二级索引代替主键索引 false
--create-secondary 除了主键索引外,是否创建二级索引 True
--mysql-storage-engine mysql 存储引擎 innodb
1、创建数据库
mysql -hxxx -p123456
create database test;
2、执行创建表命令:
cd /usr/share/sysbench

sysbench oltp_common --threads=4 --tables=10 --table_size=1000000 --mysql-host=10.111.5.119 --mysql-user=root --mysql-password=123456 --mysql-db=test prepare
--threads=4: 表示线程数
--tables=10:表示创建十个表
--table_size=1000000:表示每张表插入1000000条数据
--mysql-db=test:数据库的db是test,注意需要提前创建
prepare:固定关键字
[root@master01 sysbench]# sysbench oltp_common --threads=4 --tables=10 --table_size=1000000 --mysql-host=10.101.27.73 --mysql-user=root --mysql-password=123456 --mysql-db=test prepare
sysbench 1.0.17 (using system LuaJIT 2.0.4)
Initializing worker threads...
Creating table 'sbtest4'...
Creating table 'sbtest3'...
Creating table 'sbtest2'...
Creating table 'sbtest1'...
Inserting 1000000 records into 'sbtest1'
Inserting 1000000 records into 'sbtest2'
Inserting 1000000 records into 'sbtest3'
Inserting 1000000 records into 'sbtest4'
Creating a secondary index on 'sbtest4'...
Creating a secondary index on 'sbtest3'...
Creating a secondary index on 'sbtest1'...
Creating a secondary index on 'sbtest2'...
Creating table 'sbtest8'...
Creating table 'sbtest7'...
Inserting 1000000 records into 'sbtest8'
Inserting 1000000 records into 'sbtest7'
Creating table 'sbtest5'...
Inserting 1000000 records into 'sbtest5'
Creating table 'sbtest6'...
Inserting 1000000 records into 'sbtest6'
Creating a secondary index on 'sbtest8'...
Creating a secondary index on 'sbtest7'...
Creating a secondary index on 'sbtest6'...
Creating a secondary index on 'sbtest5'...
Creating table 'sbtest10'...
Inserting 1000000 records into 'sbtest10'
Creating table 'sbtest9'...
Inserting 1000000 records into 'sbtest9'
Creating a secondary index on 'sbtest10'...
Creating a secondary index on 'sbtest9'...
查看表数据
mysql> show tables;
+----------------+
| Tables_in_test |
+----------------+
| sbtest1        |
| sbtest10       |
| sbtest2        |
| sbtest3        |
| sbtest4        |
| sbtest5        |
| sbtest6        |
| sbtest7        |
| sbtest8        |
| sbtest9        |
+----------------+
10 rows in set (0.00 sec)
mysql> select count(*) from sbtest1;
+----------+
| count(*) |
+----------+
|  1000000 |
+----------+
执行压力测试
[root@master02 sysbench]# sysbench oltp_read_write.lua --threads=120  --tables=10  --time=600 --mysql-ignore-errors=all  --forced-shutdown=off --table-size=1000000 --mysql-user=root --mysql-password=123456 --mysql-host=10.101.27.73  --mysql-db=test  run
sysbench 1.0.17 (using system LuaJIT 2.0.4)
Running the test with following options:
Number of threads: 120
Initializing random number generator from current time

Initializing worker threads...
Threads started!
SQL statistics:
    queries performed:
        read:                            265076
        write:                           75718
        other:                           37863
        total:                           378657
    transactions:                        18929  (31.47 per sec.)
    queries:                             378657 (629.50 per sec.)
    ignored errors:                      5      (0.01 per sec.)
    reconnects:                          0      (0.00 per sec.)
General statistics:
    total time:                          601.5196s
    total number of events:              18929
Latency (ms):
         min:                                  582.96
         avg:                                 3812.68
         max:                                21221.49
         95th percentile:                     6247.39
         sum:                             72170251.91
Threads fairness:
    events (avg/stddev):           157.7417/1.98
    execution time (avg/stddev):   601.4188/0.12


加上配置优化后
innodb_buffer_pool_size = 2G
join_buffer_size = 4M

重新执行
[root@master02 sysbench]# sysbench oltp_read_write.lua --threads=120  --tables=10  --time=600 --mysql-ignore-errors=all  --forced-shutdown=off --table-size=1000000 --mysql-user=root --mysql-password=123456 --mysql-host=10.101.27.73  --mysql-db=test  run
sysbench 1.0.17 (using system LuaJIT 2.0.4)
Running the test with following options:
Number of threads: 120
Initializing random number generator from current time

Initializing worker threads...
Threads started!
SQL statistics:
    queries performed:
        read:                            434098
        write:                           124007
        other:                           62008
        total:                           620113
    transactions:                        31001  (51.27 per sec.)
    queries:                             620113 (1025.60 per sec.)
    ignored errors:                      6      (0.01 per sec.)
    reconnects:                          0      (0.00 per sec.)
General statistics:
    total time:                          604.6309s
    total number of events:              31001
Latency (ms):
         min:                                  329.26
         avg:                                 2330.89
         max:                                16063.02
         95th percentile:                     4768.67
         sum:                             72259842.56
Threads fairness:
    events (avg/stddev):           258.3417/2.39
    execution time (avg/stddev):   602.1654/1.86


SQL statistics:
    queries performed:                   执行的SQL查询:
        read:                            读请求次数
        write:                           写请求次数
        other:                           其它请求次数
        total:                           总请求次数
    transactions:                        执行的事务总数   (每秒事务数.)
    queries:                             执行的查询总次数   (每秒查询次数.)
    ignored errors:                      忽略错误数      (每秒忽略错误次数.)
    reconnects:                          数据库重连次数      (每秒重连次数.)

General statistics:
    total time:                          总运行时间,以秒为单位
    total number of events:              总执行事件数

Latency (毫秒为单位):
         min:                                  最小请求响应时间
         avg:                                  平均请求响应时间
         max:                                  最大请求响应时间
         95th percentile:                      95%的请求响应时间
         sum:                                  总请求响应时间

Threads fairness:
    events (avg/stddev):           执行的事件总数(平均每个线程执行的事件总数/标准差)
    execution time (avg/stddev):   执行耗时(平均每个线程执行事件耗时/标准差)
redis 性能测试
redis 性能测试咱们容器内有自带的工具可以使用
bash-4.4# nohup redis-benchmark  -h redis-sentinel-service -p 26379 -c 1000 -d 100 -n 1000000 --csv -t set,get &
bash-4.4# tail  -f nohup.out
"SET","17420.69"  #最终测试结果
"GET","14394.91"  #最终测试结果
[1]+  Done                    nohup redis-benchmark -h redis-sentinel-service -p 26379 -c 1000 -d 100 -n 1000000 --csv -t set,get
es压测
依赖信息:
需要java1.8+环境
需要安装jmeter
压测目标
一般要压测es的读写。
es的读写操作都有对应的restapi接口。
这里以下2个读写接口为例,说明压测过程
#写操作(写入某数据)
#/pressure/_doc,在索引pressure下创建数据
POST /pressure/_doc
{
  "uuid":"1",
  "name":"user1"
}
#读操作(读取某索引下某类型的所有数据)
#/pressure/_search,读取索引pressure下的所有数据。
GET /pressure/_search
压测结构说明
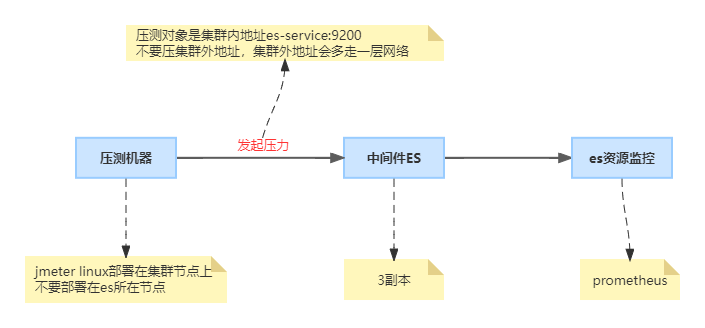
Jmeter linux部署
百度jmete部署即可找到教程,jmeter是开源工具,网上资料很多
(linux上部署java和jmeter,因为jmeter是基于java的,所以linux上需要部署java)
具体安装步骤:
1、安装1.8+ java
2、部署。。。。。
2、安装jmeter :
1、下载JMeter安装包,拷贝到linux机器上,安装包下载地址:https://jmeter.apache.org/download_jmeter.cgi

2、新建目录jmeter,并将压缩包解压到该目录

3、添加环境变量:
export JMETER_HOME=xxx  #实际jmeter文件夹目录
export PATH=$JMETER_HOME/bin:$PATH
export CLASSPATH=$JMETER_HOME/lib/ext/ApacheJMeter_core.jar:$JMETER_HOME/lib/jorphan.jar:$CLASSPATH
添加完成之后执行source命令,使得profile文件立即生效
jmeter -v :验证环境变量配置是否成功
jmeter es读写压测脚本
有些es有用户名密码,有些es无用户名密码,所以这里提供2个jmx脚本,根据自己的需要选择对应jmx文件即可。
1、脚本里有对es信息做参数化(es协议、地址、端口、用户名、密码、压测用到的es索引),实际压测时,按照es实际配置修改参数value即可。
2、脚本里包含es读写接口(常用的写入数据和查询数据接口),如果客户对压测业务有明确要求(比如压测创建索引的接口),替换 实际接口内容即可。
3、压测es读接口时,需要把es写接口禁用(即jmx中 es写接口后面的enable设为false,true代表启用,false代表禁用)
4、压测es写接口时,需要把es读接口禁用(即jmx中 es读接口后面的enable设为false)
5、jmx脚本里,有对线程数、压测持续时间参数化(P_vuser、duration),实际执行压测时,按需修改线程数和持续压测时间即可。
jmeter 执行压测
按照实际修改jmx脚本后,即可执行压测。
压测执行命令:
jmeter -n -t xxx.jmx
# xxx.jmx是脚本名称。
# 执行后,会在当前目录产生压测结果文件./result_${P_vuser}_${P_time}.jtl ,${P_vuser}是引用的线程数,${P_time}是引用的压测开始时间,这个文件名已在脚本里定义好,便于识别压测结果对应得压测场景
查看压测结果
将每次压测后的jtl文件取到本地,打开windows中的jmeter ui ,添加聚合报告,在聚合报告里选择改jtl查看压测结果,包括平均响应时间、吞吐量等。
每次压测后,需要观察es资源使用情况(通过paas平台的监控页面),判断es资源是否到了瓶颈(一般资源到了80%左右可能就存在瓶颈了)
kafka压测
1. 创建topic命令
 kubectl --limits=cpu=1000m,memory=512Mi -n middleware run kafka-topics -it --image=172.22.44.231/system_containers/kafka:2.13-2.6.0 --rm=true --restart=Never -- /opt/kafka/bin/kafka-topics.sh --zookeeper zookeeper-service:2181/middleware/kafka --topic bbb12-3 --create --partitions 12 --replication-factor 3

2. 消息发送命令
kubectl --limits=cpu=2000m,memory=1024Mi -n middleware run kafka-producer -it --image=172.22.44.231/system_containers/kafka:2.13-2.6.0 --rm=true --restart=Never -- /opt/kafka/bin/kafka-producer-perf-test.sh --topic bbb12-3 --throughput 400000 --num-records 50000000 --record-size 100 --producer-props bootstrap.servers=10.111.178.226:29092 acks=all


/opt/kafka/bin/kafka-producer-perf-test.sh:Kafka 生产者性能测试脚本的路径。
--topic bbb12-3:指定 Kafka 主题名称为 bbb12-3。
--throughput 400000:指定生产者的吞吐量为 400000 消息/秒。即在每秒内发送的消息数。
--num-records 50000000:指定发送的总消息数为 50000000 条。
--record-size 100:指定消息的大小为 100 字节。
--producer-props bootstrap.servers=localpv-kafka-all-broker-svc.wolf:29092 acks=all:指定 Kafka 生产者的属性,其中 bootstrap.servers 指定了 Kafka 集群中至少一个 Broker 的地址和端口,acks=all 表示要求所有副本都确认消息后才算发送成功
压测结果
[root@master01 tmp]# kubectl --limits=cpu=1000m,memory=1024Mi -n middleware run kafka-producer -it --image=172.22.44.231/system_containers/kafka:2.13-2.6.0 --rm=true --restart=Never -- /opt/kafka/bin/kafka-producer-perf-test.sh --topic bbb12-3 --throughput 400000 --num-records 5000000 --record-size 100 --producer-props bootstrap.servers=kafka-1-all-svc.middleware:29092 acks=all
If you don't see a command prompt, try pressing enter.
61836 records sent, 12367.2 records/sec (1.18 MB/sec), 775.6 ms avg latency, 1688.0 ms max latency.
146074 records sent, 29209.0 records/sec (2.79 MB/sec), 3155.7 ms avg latency, 3996.0 ms max latency.
244636 records sent, 48927.2 records/sec (4.67 MB/sec), 5248.0 ms avg latency, 6489.0 ms max latency.
264475 records sent, 52895.0 records/sec (5.04 MB/sec), 6092.8 ms avg latency, 6326.0 ms max latency.
275575 records sent, 55115.0 records/sec (5.26 MB/sec), 5655.3 ms avg latency, 5807.0 ms max latency.
235320 records sent, 47064.0 records/sec (4.49 MB/sec), 5860.5 ms avg latency, 6211.0 ms max latency.
274836 records sent, 54956.2 records/sec (5.24 MB/sec), 5989.9 ms avg latency, 6303.0 ms max latency.
232064 records sent, 46403.5 records/sec (4.43 MB/sec), 6172.6 ms avg latency, 6418.0 ms max latency.
259146 records sent, 51808.5 records/sec (4.94 MB/sec), 5953.2 ms avg latency, 6404.0 ms max latency.
273059 records sent, 54600.9 records/sec (5.21 MB/sec), 5737.3 ms avg latency, 5851.0 ms max latency.
253523 records sent, 50684.3 records/sec (4.83 MB/sec), 5887.3 ms avg latency, 6100.0 ms max latency.
292595 records sent, 58495.6 records/sec (5.58 MB/sec), 5436.0 ms avg latency, 5956.0 ms max latency.
271284 records sent, 54246.0 records/sec (5.17 MB/sec), 5462.0 ms avg latency, 5642.0 ms max latency.
276759 records sent, 55351.8 records/sec (5.28 MB/sec), 5493.6 ms avg latency, 5686.0 ms max latency.
269803 records sent, 53960.6 records/sec (5.15 MB/sec), 5556.6 ms avg latency, 5649.0 ms max latency.
273948 records sent, 54789.6 records/sec (5.23 MB/sec), 5468.4 ms avg latency, 5626.0 ms max latency.
280904 records sent, 56180.8 records/sec (5.36 MB/sec), 5578.8 ms avg latency, 5676.0 ms max latency.
268916 records sent, 53783.2 records/sec (5.13 MB/sec), 5485.6 ms avg latency, 5662.0 ms max latency.
277056 records sent, 55400.1 records/sec (5.28 MB/sec), 5605.3 ms avg latency, 5734.0 ms max latency.
5000000 records sent, 50282.082483 records/sec (4.80 MB/sec), 5520.37 ms avg latency, 6489.00 ms max latency, 5600 ms 50th, 6293 ms 95th, 6358 ms 99th, 6430 ms 99.9th.
pod "kafka-producer" deleted
rabbitmq压测
需要上传perf-test-2.19.0.jar包
需要java1.8+环境
路径:
## rabbmitmq
集群100个队列 每个队列100个生产者,200个消费者,消息大小2000bytes
1.在节点上安装Jre环境
2.上传perf-test-2.19.0.jar文件到测试目录
执行如下命令
java -jar perf-test-2.19.0.jar --queue-pattern 'perf-test-%d' \
  --queue-pattern-from 1 --queue-pattern-to 100 \
  --producers 100 --consumers 200 --rate 100 --size 2000 -z 30 -h amqp://guest:123456@10.105.149.133:5672

集群100个队列 每个队列100个生产者,200个消费者,消息大小4000bytes
java -jar perf-test-2.19.0.jar --queue-pattern 'perf-test-%d' \
  --queue-pattern-from 1 --queue-pattern-to 100 \
  --producers 100 --consumers 200 --rate 100 --size 4000 -z 30 -h amqp://guest:123456@10.105.149.133:5672
集群100个队列 每个队列100个生产者,200个消费者,消息大小8000bytes
java -jar perf-test-2.19.0.jar --queue-pattern 'perf-test-%d' \
  --queue-pattern-from 1 --queue-pattern-to 100 \
  --producers 100 --consumers 200 --rate 100 --size 8000 -z 30 -h amqp://guest:123456@10.105.149.133:5672


  集群100个队列 每个队列200个生产者,400个消费者,消息大小2000bytes


  java -jar perf-test-2.19.0.jar --queue-pattern 'perf-test-%d' \
  --queue-pattern-from 1 --queue-pattern-to 100 \
  --producers 100 --consumers 200 --rate 200 --size 8000 -z 30
-h amqp://guest:111111@192.168.4.120:48262 amqp://guest:123456@10.105.149.133:5672

5.2高并发
5.2.1集群100个队列 每个队列100个生产者,200个消费者,消息大小2000bytes
java -jar perf-test-2.19.0.jar --queue-pattern 'perf-test-%d' \
  --queue-pattern-from 1 --queue-pattern-to 100 \
  --producers 100 --consumers 200 --rate 500 --size 2000 -z 30 \
-h amqp://guest:123456@10.105.149.133:5672
5.3疲劳测试
100个队列,100个生产者,200个消费者,消息大小2000bytes
java -jar perf-test-2.19.0.jar --queue-pattern 'perf-test-%d' \
 --queue-pattern-from 1 --queue-pattern-to 100 \
 --producers 100 --consumers 200 --producer-random-start-delay 1800 --rate 100 --size 2000 -z 3600 -h amqp://guest:123456@10.105.149.133:5672
每一条执行完成之后主要参考如下内容:
test stopped (Reached time limit)
id: test-172734-335, sending rate avg: 8536 msg/s
id: test-172734-335, receiving rate avg: 7936 msg/s
id: test-172734-335, consumer latency min/median/75th/95th/99th 3185/3687682/7265020/11240053/13105129 µs # 这个单位是微秒
消息达到50ms以内合格

 浙公网安备 33010602011771号