命令工具篇
监控linux系统性能的工具 — htop
htop作为top的最佳替代选择 - 支持鼠标点,搜索杀死进程,排序等,功能相当强大
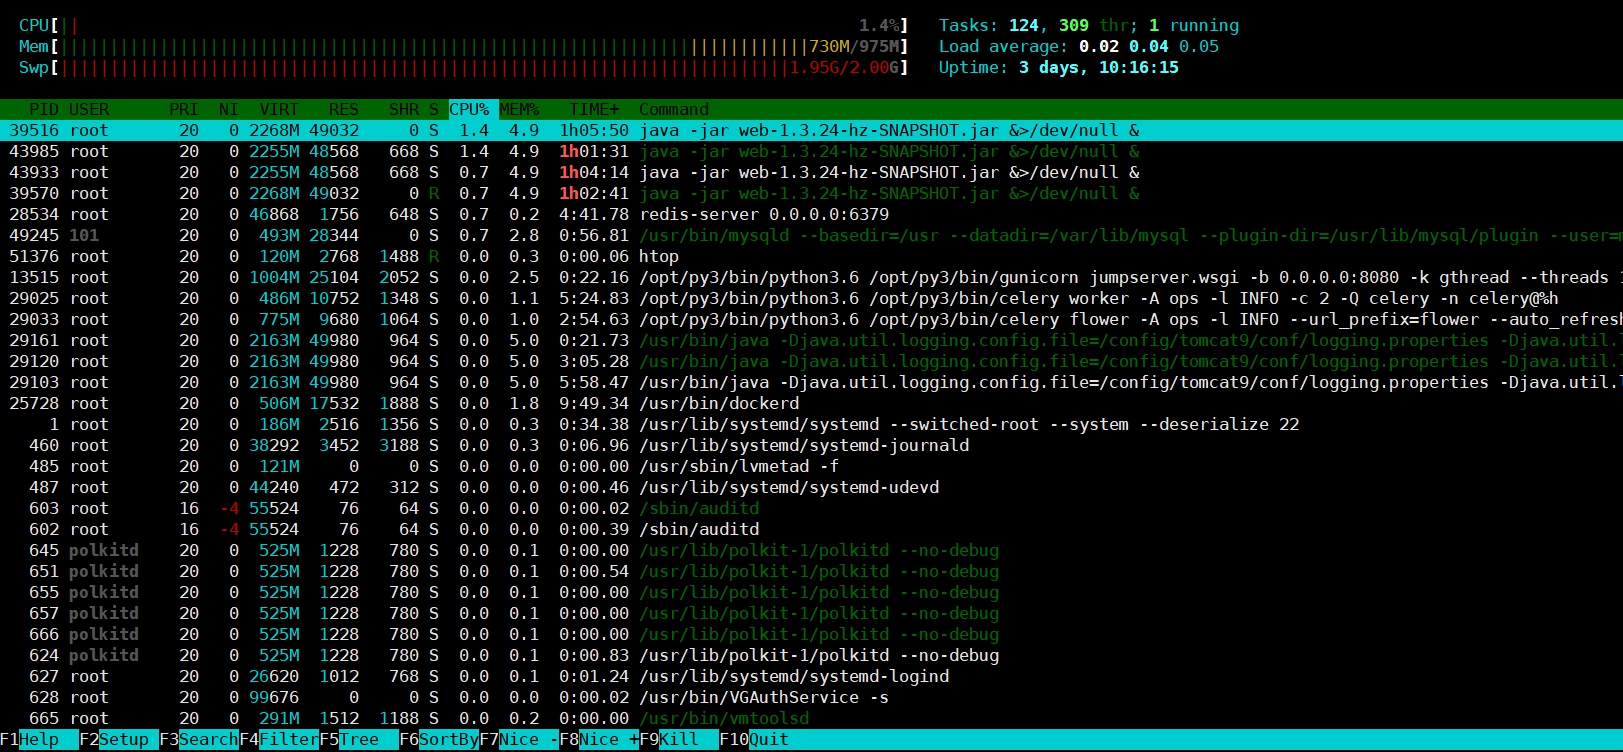
USER:进程所有者的用户名

PRI:进程的优先级别

NI:进程的优先级别数值

VIRT:进程占用的虚拟内存值

RES:进程占用的物理内存值

SHR:进程使用的共享内存值

S:进程的状态,其中S表示休眠,R表示正在运行,Z表示僵死状态,N表示该进程优先值是负数

%CPU:该进程占用的CPU使用率

%MEM:该进程占用的物理内存和总内存的百分比

TIME+:该进程启动后占用的总的CPU时间,指该进程使用cpu多长时间,如果是多核cpu,进程占用时间的累加的

COMMAND:进程启动的启动命令名称
按照属性排序输出:按F6
会出现这几个选项
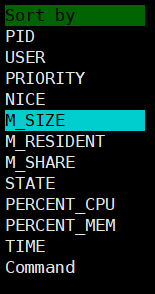
然后键盘上下选中要排序的项,回车即可,一般用来快速排查占用内容过高的进程
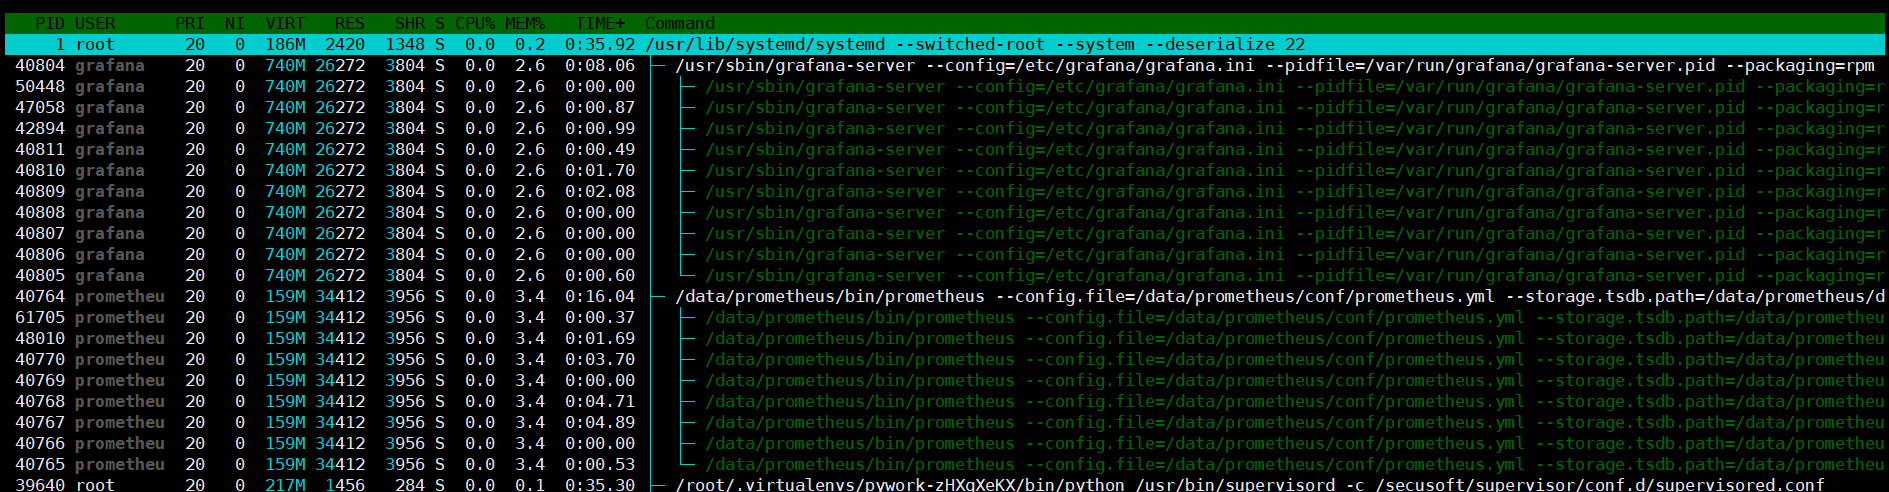
列出子进程的树状图:按F5
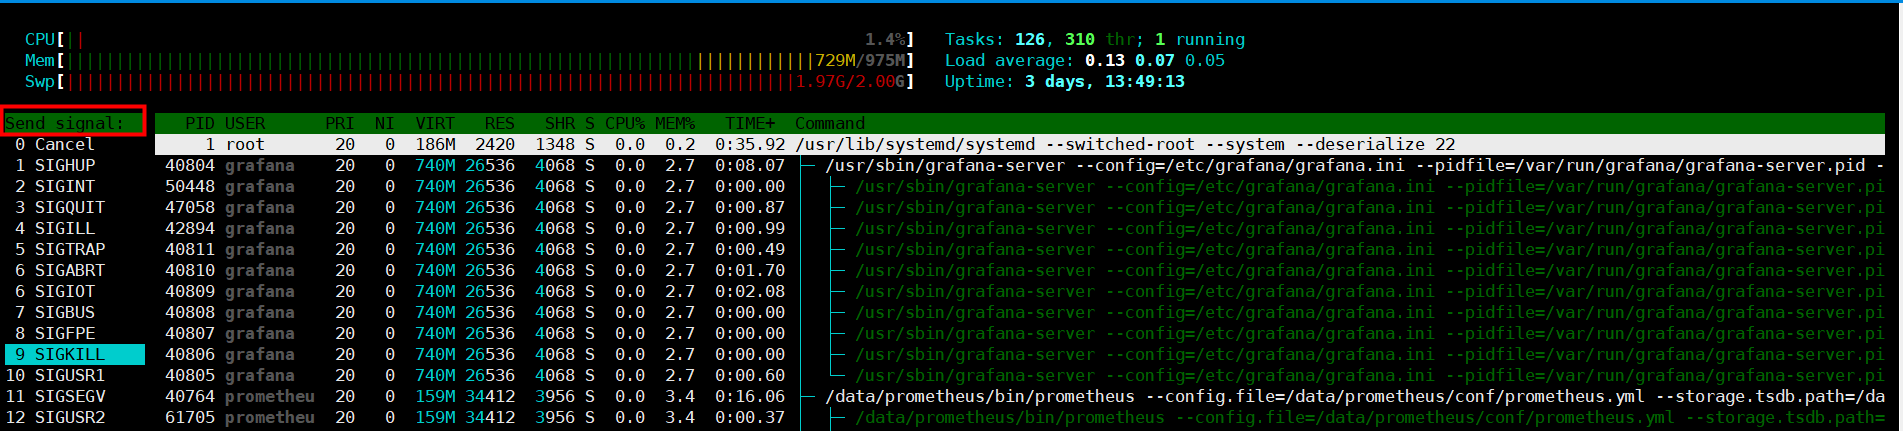
查找进程,并发送信号: 按F4查找选中进程,再按F9发送信号,列入9是发送kill命令
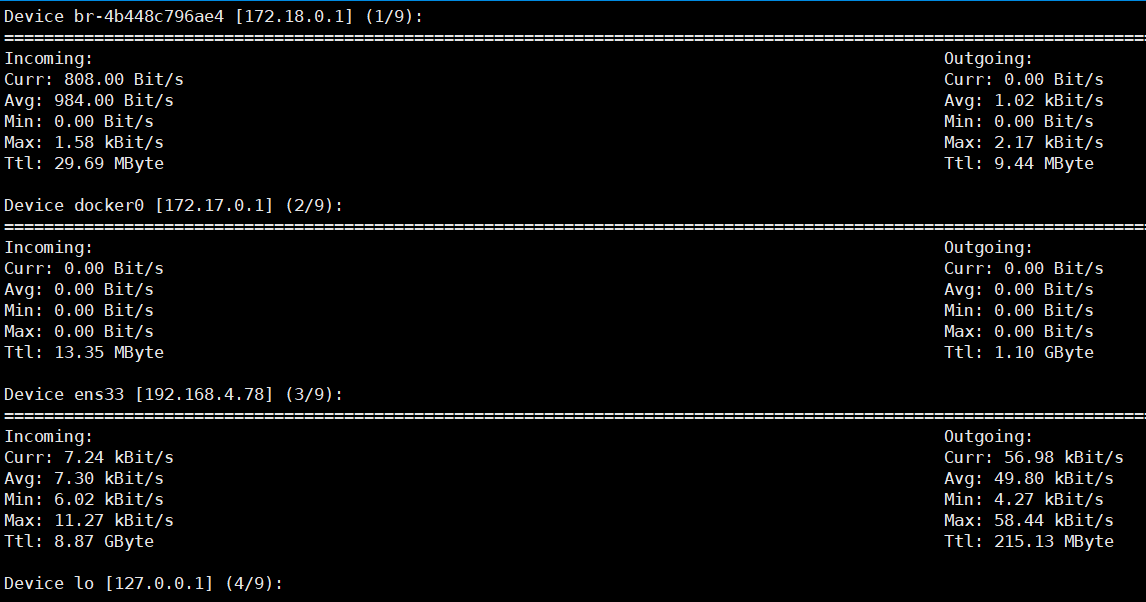
监控网卡流量的工具 - nload
可以查看每个网卡进出口的实时带宽
系统启动异常诊断 - dmesg
此部分分析比较复杂,不展示了
查看内存使用情况 - free
[root ~]# free
              total        used        free      shared  buff/cache   available
Mem:        1016168      323924      190452         356      501792      531800
Swap:             0           0           0
虚拟内存统计 - vmstat
[root ~]# vmstat
procs -----------memory---------- ---swap-- -----io---- -system-- ------cpu-----
 r  b   swpd   free   buff  cache   si   so    bi    bo   in   cs us sy id wa st
 2  0      0 204020  79036 667532    0    0     5    18  101   58  1  0 99  0  0
CPU信息统计 - mpstat
[root ~]# mpstat
Linux 3.10.0-957.5.1.el7.x86_64 (iZ8vba0s66jjlfmo601w4xZ)       05/30/2019      _x86_64_        (1 CPU)

01:51:54 AM  CPU    %usr   %nice    %sys %iowait    %irq   %soft  %steal  %guest  %gnice   %idle
01:51:54 AM  all    0.71    0.00    0.17    0.04    0.00    0.00    0.00    0.00    0.00   99.07
查看进程使用内存状况 - pmap
[root ~]# ps
  PID TTY          TIME CMD
 4581 pts/0    00:00:00 bash
 5664 pts/0    00:00:00 ps
[root ~]# pmap 4581
4581:   -bash
0000000000400000    884K r-x-- bash
00000000006dc000      4K r---- bash
00000000006dd000     36K rw--- bash
00000000006e6000     24K rw---   [ anon ]
0000000001de0000    400K rw---   [ anon ]
00007f82fe805000     48K r-x-- libnss_files-2.17.so
00007f82fe811000   2044K ----- libnss_files-2.17.so
...
报告设备CPU和I/O统计信息 - iostat
[root ~]# iostat
Linux 3.10.0-693.11.1.el7.x86_64 (iZwz97tbgo9lkabnat2lo8Z)      06/26/2018      _x86_64_       (1 CPU)
avg-cpu:  %user   %nice  %system  %iowait(cpu等待输入输出完成时间占比)  %steal   %idle(cpu空闲时间占比)
           0.79    0.00    0.20    0.04                                0.00   98.97
Device:            tps    kB_read/s    kB_wrtn/s    kB_read    kB_wrtn
vda               0.85         6.78        21.32    2106565    6623024
vdb               0.00         0.01         0.00       2088          0
几乎可以输出所有linux工作报告 - **sar
sar和iostat属于sysstat工具包下的工具,下载方式都是下载sysstat即可。

查看设备使用情况
[root@localhost ~]# sar -d 1 -p
Linux 3.10.0-862.el7.x86_64 (localhost) 	05/09/2020 	_x86_64_	(1 CPU)

09:29:02 AM       DEV       tps  rd_sec/s  wr_sec/s  avgrq-sz  avgqu-sz     await     svctm     %util
09:29:03 AM       sda      2.08    133.33      0.00     64.00      0.00      0.50      0.50      0.10
09:29:03 AM       sr0      0.00      0.00      0.00      0.00      0.00      0.00      0.00      0.00
09:29:03 AM centos-root      0.00      0.00      0.00      0.00      0.00      0.00      0.00      0.00
09:29:03 AM centos-swap     16.67    133.33      0.00      8.00      0.01      0.50      0.06      0.10


tps:每秒从物理磁盘I/O的次数.多个逻辑请求会被合并为一个I/O磁盘请求,一次传输的大小是不确定的.
rd_sec/s:每秒读扇区的次数.
wr_sec/s:每秒写扇区的次数.
avgrq-sz:平均每次设备I/O操作的数据大小(扇区).
avgqu-sz:磁盘请求队列的平均长度.
await:从请求磁盘操作到系统完成处理,每次请求的平均消耗时间,包括请求队列等待时间,单位是毫秒(1秒=1000毫秒).
svctm:系统处理每次请求的平均时间,不包括在请求队列中消耗的时间.
%util:I/O请求占CPU的百分比,比率越大,说明越饱,一般巡检主要看这个值的报告
查看cpu使用情况
[root@localhost ~]# sar -u 1
Linux 3.10.0-862.el7.x86_64 (localhost) 	05/09/2020 	_x86_64_	(1 CPU)

09:36:27 AM     CPU     %user     %nice   %system   %iowait    %steal     %idle
09:36:28 AM     all      1.04      0.00      1.04      0.00      0.00     97.92
09:36:29 AM     all      1.03      0.00      0.00      0.00      0.00     98.97
09:36:30 AM     all      0.00      0.00      0.00      0.00      0.00    100.00
09:36:31 AM     all      0.00      0.00      1.03      0.00      0.00     98.97
09:36:32 AM     all      1.03      0.00      1.03      0.00      0.00     97.94

%user:     CPU处在用户模式下的时间百分比。
%system:CPU处在系统模式下的时间百分比。
%iowait:   CPU等待输入输出完成时间的百分比。
%idle:       CPU空闲时间百分比。
显示索引节点、文件和其他内核表的状态
[root@localhost ~]# sar -v
Linux 3.10.0-862.el7.x86_64 (localhost) 	05/09/2020 	_x86_64_	(1 CPU)

09:20:02 AM dentunusd   file-nr  inode-nr    pty-nr
09:30:01 AM      5024      3776     32552         7
09:40:01 AM      5070      3776     32555         7
Average:         5047      3776     32554         7

dentunusd:在缓冲目录条目中没有使用的条目数量.
file-nr:被系统使用的文件句柄数量.
inode-nr:使用的索引节点数量.
pty-nr:使用的pty数量
**如果遇到"Too many open files in system"的错误时,可能是file-nr句柄数据量太高,可以在sysctl.conf中修改fs.file-max值
常用监控
(1) sar -b 5 5 // IO传送速率
(2) sar -B 5 5 // 页交换速率
(3) sar -c 5 5 // 进程创建的速率
(4) sar -d 5 5 // 块设备的活跃信息
(5) sar -n DEV 5 5 // 网路设备的状态信息
(6) sar -n SOCK 5 5 // SOCK的使用情况
(7) sar -n ALL 5 5 // 所有的网络状态信息
(8) sar -P ALL 5 5 // 每颗CPU的使用状态信息和IOWAIT统计状态
(9) sar -q 5 5 // 队列的长度(等待运行的进程数)和负载的状态
(10) sar -r 5 5 // 内存和swap空间使用情况
(11) sar -R 5 5 // 内存的统计信息(内存页的分配和释放、系统每秒作为BUFFER使用内存页、每秒被cache到的内存页)
(12) sar -u 5 5 // CPU的使用情况和IOWAIT信息(同默认监控)
(13) sar -v 5 5 // inode, file and other kernel tablesd的状态信息
(14) sar -w 5 5 // 每秒上下文交换的数目
(15) sar -W 5 5 // SWAP交换的统计信息(监控状态同iostat 的si so)
(16) sar -x 2906 5 5 // 显示指定进程(2906)的统计信息,信息包括:进程造成的错误、用户级和系统级用户CPU的占用情况、运行在哪颗CPU上
(17) sar -y 5 5 // TTY设备的活动状态
其他监控工具和监控对象,就附上几张大神总结的图:

Beautiful is better than ugly.
Explicit is better than implicit.
Simple is better than complex.
Complex is better than complicated.
Flat is better than nested.
Sparse is better than dense.
Readability counts.
Special cases aren't special enough to break the rules.
Although practicality beats purity.
Errors should never pass silently.
Unless explicitly silenced.
In the face of ambiguity, refuse the temptation to guess.
There should be one-- and preferably only one --obvious way to do it.
Although that way may not be obvious at first unless you're Dutch.
Now is better than never.
Although never is often better than *right* now.
If the implementation is hard to explain, it's a bad idea.
If the implementation is easy to explain, it may be a good idea.
Namespaces are one honking great idea -- let's do more of those!

 浙公网安备 33010602011771号