image
image - Display image object
Description
image creates an image graphics object by interpreting each element in a matrix as an index into the figure's colormap or directly as RGB values, depending on the data specified.
The image function has two forms:
A high-level function that calls newplot to determine where to draw the graphics objects and sets the following axes properties:
- XLim and YLim to enclose the image
- Layer to top to place the image in front of the tick marks and grid lines
- YDir to reverse
- View to [0 90]
A low-level function that adds the image to the current axes without calling newplot. The low-level function argument list can contain only property name/property value pairs.
You can specify properties as property name/property value pairs, structure arrays, and cell arrays (see set and get for examples of how to specify these data types).
- image(C) displays matrix C as an image. Each element of C specifies the color of a rectangular segment in the image.
- image(x,y,C), where x and y are two-element vectors, specifies the range of the x- and y-axis labels, but produces the same image as image(C). This can be useful, for example, if you want the axis tick labels to correspond to real physical dimensions represented by the image. If x(1) > x(2) or y(1) > y(2), the image is flipped left-right or up-down, respectively. It can also be useful when you want to place the image within a set of axes already created. In this case, use hold on with the current figure and enter x and y values corresponding to the corners of the desired image location. The image is stretched(伸展) and oriented as applicable(适用的).
- image(x,y,C,'PropertyName',PropertyValue,...) is a high-level function that also specifies property name/property value pairs. For a description of the properties, see Image Properties. This syntax calls newplot before drawing the image.
- image('PropertyName',PropertyValue,...) is the low-level syntax of the image function. It specifies only property name/property value pairs as input arguments.
- handle = image(...) returns the handle of the image object it creates. You can obtain the handle with all forms of the image function.
(本博客系原创,转载请注明出处:http://www.cnblogs.com/pfli1995/p/4659966.html)
(博主cnds中对应文章:http://blog.csdn.net/xuexiyanjiusheng/article/details/46959893)
Examples
Load MAT-File and Display Image(第一个例子)
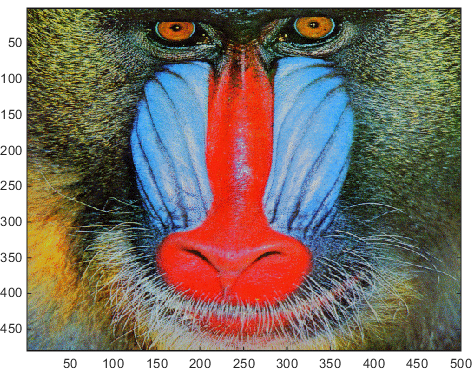
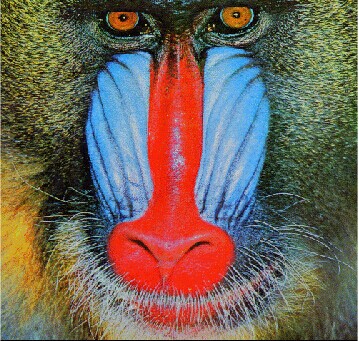
Load the mandrill file which contains an indexed image, X, and its associated colormap, map. Display the image using its colormap.
load mandrill
image(X)
colormap(map)
注意:
如果只输入
load mandrill
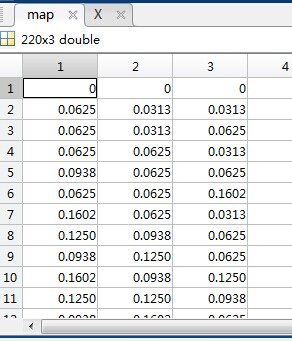
得到矩阵 X 和 map
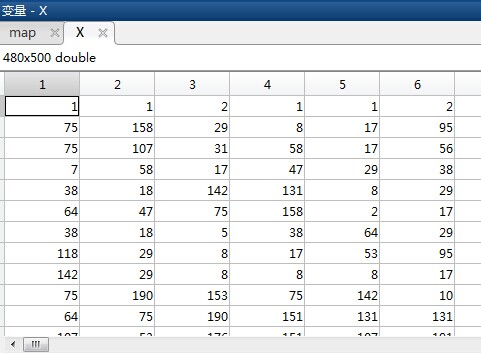
值得注意的是,image 可以直接对 0~255 范围内的 double 型数据进行操作,得到图像,而 imshow 是只能对 0~1 范围内的 double 数据操作得到正确图像的。
这里,再输入
image(X)
得到的图像如下:
再继续输入
colormap(map)
后,图像变成正确的彩色。
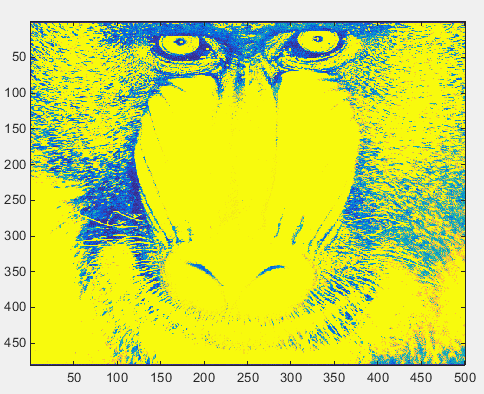
另外值得说明的是:博主将得到的 X 矩阵 转换为 uint8 型,即 X1 = uint8(X) ,map 不变后
image(X1)
得到的图像如下:
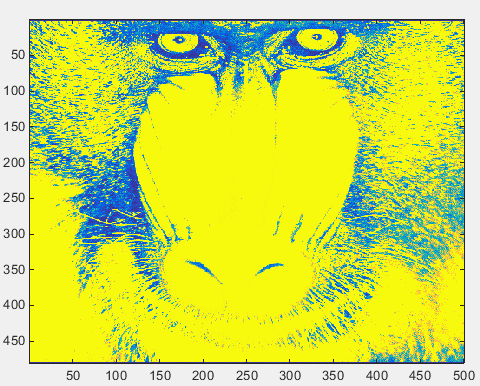
看起来没有多大变化,继续
colormap(map)
得到的图像却是下面的形式的:

博主也不是很明白其中的原因。(由于map里面的 double 是 0~1 范围内的,转化为 uint8 后会变成 0 ,所以没有变 map )
Remove the axis tick marks and tick labels.
Set the aspect ratio to obtain square pixels.
axis off
axis image
Load and Display JPEG Image File(第二个例子)
Load a JPEG image file of the Cat's Eye Nebula from the Hubble Space Telescope (image courtesy NASA). Display the original image using its RGB color values (left) as a subplot.
Create a linked subplot (same size and scale) to display the transformed intensity image as a heat map (right).
figure
ax(1) = subplot(1,2,1);
rgb = imread('ngc6543a.jpg');
image(rgb)
title('RGB image')

ax(2) = subplot(1,2,2);
im = mean(rgb,3);

%mean(A,dim) returns the mean along dimension dim.
%For example, if A is a matrix, then mean(A,2) is a column vector containing the mean of each row

image(im)
title('Intensity Heat Map')
colormap(hot(256))
linkaxes(ax,'xy')%同步缩放坐标轴
axis(ax,'image')
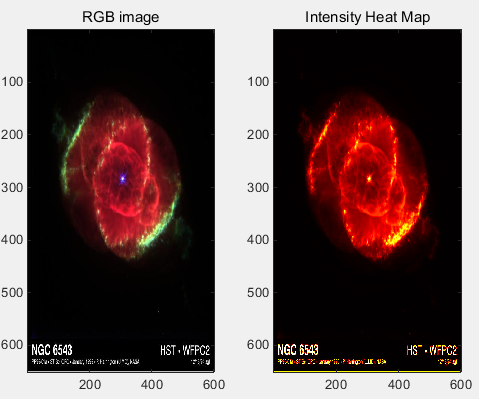
一步一步的运行程序得到的结果如下:
figure
ax(1) = subplot(1,2,1);
rgb = imread('ngc6543a.jpg');
image(rgb)
title('RGB image')
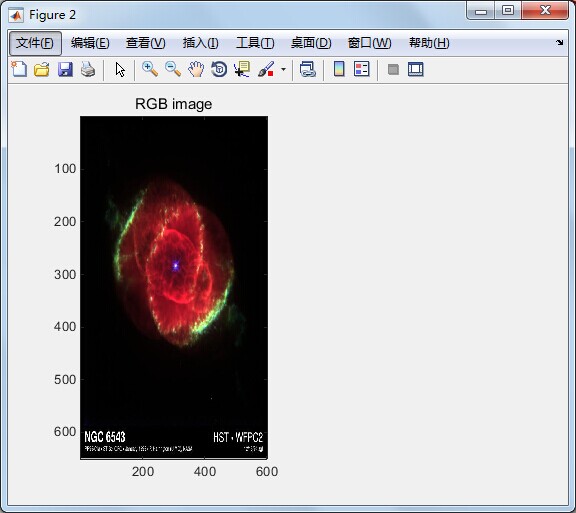
这里 image 和 imshow 一样,作用于一个 3 维的 uint8 型矩阵,得到彩色的图形。
需要注意的是,经过博主验证,此时对于 image 而言,uint8 和 double 型的数据也和 imshow 一样有范围的限制,即 uint8: 0~255; double: 0~1.
(和前面的用法有所区别)
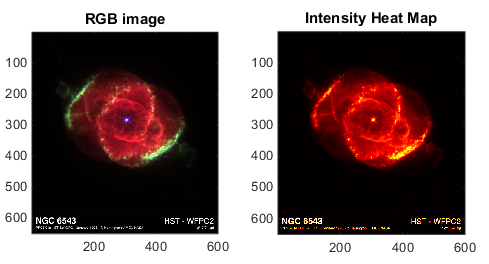
ax(2) = subplot(1,2,2);
im = mean(rgb,3);
image(im)
title('Intensity Heat Map')
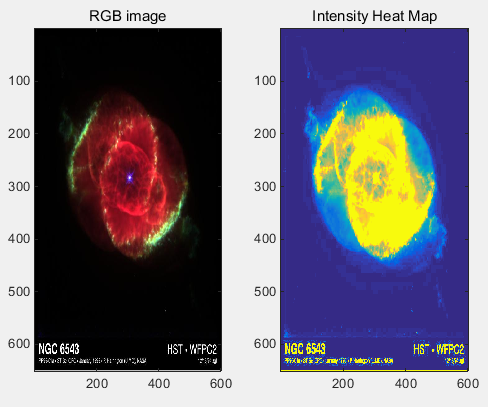
注意:此时的 im 为650*600 double 型的矩阵。
colormap(hot(256))
linkaxes(ax,'xy')%同步缩放坐标轴
axis(ax,'image')

 浙公网安备 33010602011771号