
filebeat 日志采集系统概念和基础配置
参考资料
- https://www.bilibili.com/video/BV1WK41117dA
- https://www.elastic.co/cn/beats/filebeat
filebeat概述
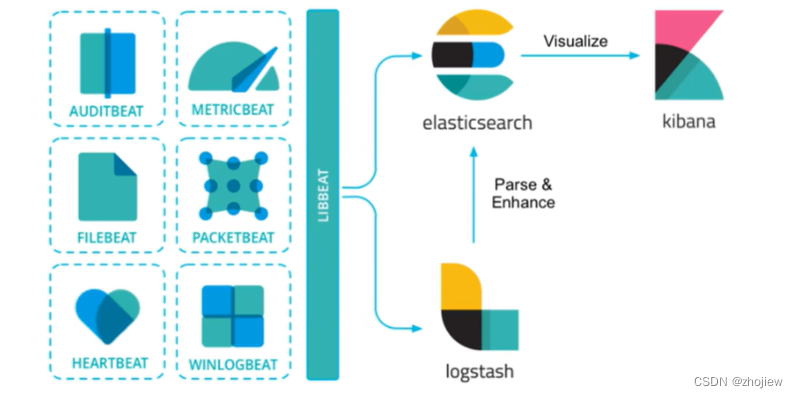
es提供了众多的beat模块用于数据采集,filebeat用于采集日志
| 日志格式 | 组件框架 |
|---|---|
| Audit data | Auditbeat(轻量审计日志采集) |
| Log files | Filebeat(轻量日志采集器) |
| Availability | HeartBeat(轻量运行时间监控采集器) |
| Metrics | Metricbeat(轻量指标采集器) |
| Network traffic | Packetbeat(轻量网路数据采集) |
| Windows event logs | Winlogbeat(轻量Windows事件日志采集) |
filebeat的特点
-
轻量型日志采集器,占用资源更少,对机器配置要求极低
-
操作简便,可将采集到的日志信息直接发送到ES集群、Logstash、Kafka集群等消息队列中
-
异常中断重启后会继续上次停止的位置。(通过${filebeat home}data registry文件来记录日志的偏移量)
-
使用压力敏感协议(backpressure-sensitive)来传输数据,在logstash忙的时候,Filebeat会减慢读取/传输速度,等到logstash恢复则Filebeat恢复原来的速度。
-
Filebeat带有内部模块(auditd,Apache,Nginx,System 和 MySQL),可通过个指定命令来简化通用日志格式的收集,解析和可视化。
bin/logstash -e 'input { stdin{} } output { stdout{} }'
对比logstash和filebeat
- Filebeat与Logstash相比,其占用空间小,使用的系统资源更少
- Logstash具有更大的占用空间,但提供了大量的输入,过滤和输出插件,用于收集,丰富和转换来自各种来源的数据
- Logstash是使用Java编写,插件是使用jruby编写,对机器的资源要求会比较高。在采集日志方面,对CPU、内存上都要比Filebeat高很多
filebeat安装
Filebeat本身对资源和性能要求不高。采集数据后采用的Http请求发送的数据也不要求运行环境。
https://www.elastic.co/cn/beats/filebeat
查看默认配置文件
- 默认filebeat输入为关闭状态,获取/var/log的系统日志文件
- 默认输出为elasticsearch
$ cd filebeat-8.7.0-linux-x86_64
$ grep  -Ev "^$|[#;]" filebeat.yml
filebeat.inputs:
- type: filestream
  id: my-filestream-id
  enabled: false
  paths:
    - /var/log/*.log
filebeat.config.modules:
  path: ${path.config}/modules.d/*.yml
  reload.enabled: false
setup.template.settings:
  index.number_of_shards: 1
setup.kibana:
output.elasticsearch:
  hosts: ["localhost:9200"]
processors:
  - add_host_metadata:
      when.not.contains.tags: forwarded
  - add_cloud_metadata: ~
  - add_docker_metadata: ~
  - add_kubernetes_metadata: ~
配置input
https://www.elastic.co/guide/en/beats/filebeat/current/configuration-filebeat-options.html
配置output
https://www.elastic.co/guide/en/beats/filebeat/current/configuring-output.html
开启输入并将输入设置为console(需要注释掉es的输出,因为只能定义单个输出),启动测试
sudo ./filebeat -e -c filebeat.yml
filebeat对接logstash
安装logstash
https://www.elastic.co/cn/downloads/logstash
配置logstash接收nginx日志
# cat /var/log/nginx/access.log
127.0.0.1 - - [02/Apr/2023:15:19:57 +0000] "GET / HTTP/1.1" 200 615 "-" "curl/7.79.1" "-"
127.0.0.1 - - [02/Apr/2023:15:20:09 +0000] "GET / HTTP/1.1" 200 615 "-" "curl/7.79.1" "-"
创建logstash配置文件如下
$ vim job/filebeat_to_logstash.conf
input {
  beats {
    port=>5044
    codec=>plain{
      charset=>"GBK"
    }
  }
}
filter {

}
output {
  stdout {
    codec=>rubydebug
  }
}
修改filebeat配置文件
output.logstash:
  # The Logstash hosts
  hosts: ["localhost:5044"]
logstash获取到日志如下
{
         "event" => {
        "original" => "127.0.0.1 - - [02/Apr/2023:15:27:30 +0000] \"GET / HTTP/1.1\" 200 615 \"-\" \"curl/7.79.1\" \"-\""
    },
           "ecs" => {
        "version" => "8.0.0"
    },
   	...
    "@timestamp" => 2023-04-02T15:27:31.880Z,
      "@version" => "1",
           "log" => {
          "file" => {
            "path" => "/var/log/nginx/access.log"
        },
        "offset" => 630
    },
          "tags" => [
        [0] "beats_input_codec_plain_applied"
    ]
}
此外可以通过module预置的模块自动监控和解析日志
设置filebeat配置文件开启模块
filebeat.config.modules:
  path: ${path.config}/modules.d/*.yml
  reload.enabled: true
开启模块,模块的具体配置可以参考官网示例
https://www.elastic.co/guide/en/beats/filebeat/current/filebeat-module-nginx.html
$ mv modules.d/nginx.yml.disabled modules.d/nginx.yml
$ vim modules.d/nginx.yml
- module: nginx
  access:
    enabled: true
    var.paths: ["/var/log/nginx/access.log*"]
  error:
    enabled: true
    var.paths: ["/var/log/nginx/error.log*"]
也可以绕过logstash直接将output设置为es,例如以下output配置
https://www.elastic.co/guide/en/beats/filebeat/current/elasticsearch-output.html
output.elasticsearch:
  hosts: ["http://localhost:9200"]
  indices:
    - index: "warning-%{[agent.version]}-%{+yyyy.MM.dd}"
      when.contains:
        message: "WARN"
    - index: "error-%{[agent.version]}-%{+yyyy.MM.dd}"
      when.contains:
        message: "ERR"

 浙公网安备 33010602011771号