
Python爬虫——上海市链家二手房数据爬取及可视化分析
一、选题的背景
本次项目选择了中国的一线城市——上海市,通过了解上海市二手房的情况,可以帮助人们在购房、出租等方面做出更明智的决策。可以帮助人们了解上海市经济的发展趋势。随着互联网的发展,越来越多的房地产信息通过网络发布,使用爬虫技术可以方便地收集和分析这些信息。而本次项目选择的数据来源是链家。链家是一家著名的房地产经纪公司,在上海市有着广泛的房地产业务。通过爬取上海市链家发布的二手房信息,可以获得丰富的数据,为分析提供参考。
二、主题式网络爬虫设计方案
1.主题式网络爬虫名称
上海市链家二手房数据爬虫
2.主题式网络爬虫爬取的内容与数据特征分析
上海市链家二手房数据爬虫主要爬取了上海市链家二手房的所在行政区、小区名称、每平方米价格、整套房总价、建筑面积、所在楼层、房屋朝向、关注人数、所在区域、装修类型、房屋亮点和面积区间。
3.主题式网络爬虫设计方案概述(包括实现思路与技术难点)
思路:查看网页的结构,定位目标数据的位置,爬取数据,将数据进行清洗,最后将清洗后的数据进行可视化。
难点:如何应对网站的反爬虫机制,如何爬取多个页面的数据,请求异常的处理
三、主题页面的结构特征分析
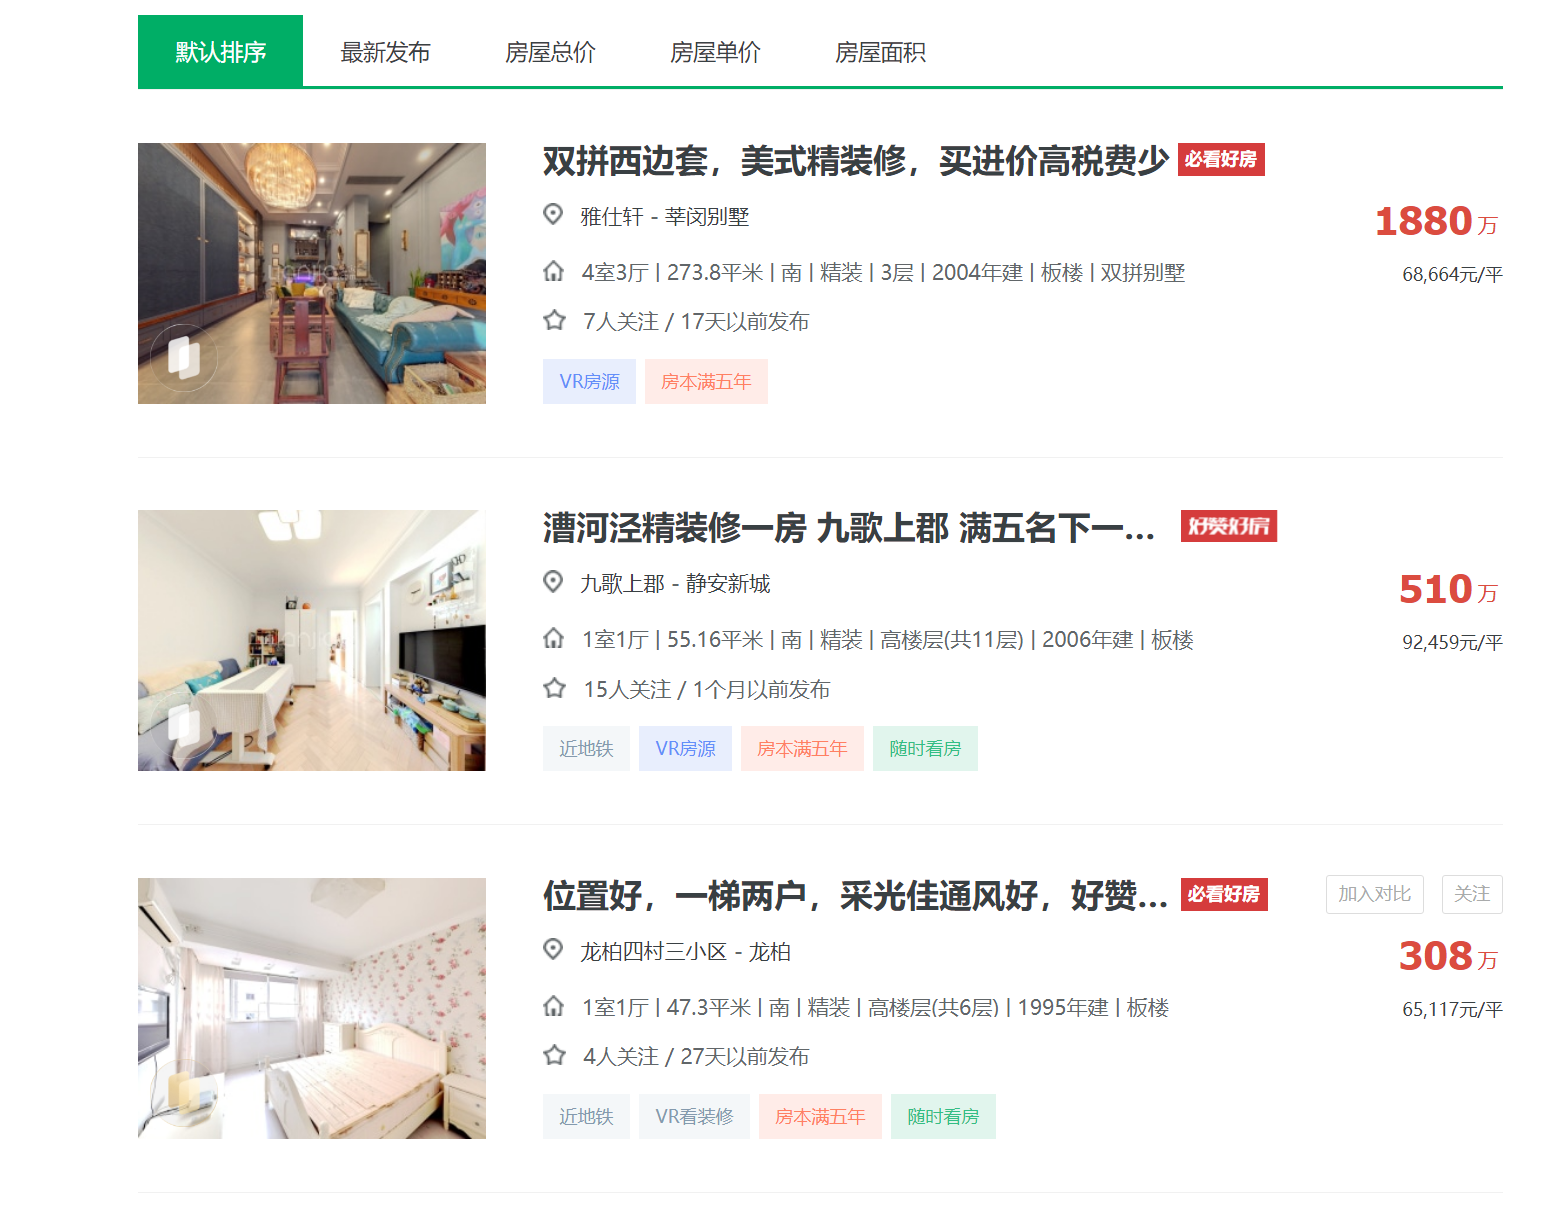
1.主题页面的结构与特征分析
目标内容界面:
2.Htmls 页面解析

3.节点(标签)查找方法与遍历方法
查找方法:使用lxml库中的xpath函数查找
四、网络爬虫程序设计
1.数据爬取与采集
  1 import csv
  2 import os
  3 import random
  4 import time
  5 import pandas as pd
  6 from lxml import etree
  7 import requests
  8 from retry.api import retry_call
  9
 10
 11 # 异常重试函数,防止网络不稳定导致抓取数据中断等。
 12 def retry_request(crawl_url, req_type='get', retry_times=6):
 13     while retry_times:
 14         retry_times -= 1
 15         try:
 16             # 请求头 User-Agent
 17             headers = {"User-Agent": "Mozilla/5.0 (Windows NT 10.0; Win64; x64) AppleWebKit/537.36 (KHTML, like Gecko) Chrome/105.0.0.0 Safari/537.36"}
 18             resp = retry_call(getattr(requests, req_type), fargs=[crawl_url],
 19                               fkwargs={"timeout": 60, "headers": headers}, delay=0, tries=1)
 20             # 判断请求状态码以及响应是否为空,为空则继续,反之则返回请求体
 21             if resp.status_code == 200 and resp.content:
 22                 return resp.text
 23         except Exception as e:
 24             print(e)
 25         # 重试次数用完,则直接返回异常数据
 26         if not retry_times:
 27             return '<html></html>'
 28         # 随机休眠 1-3s
 29         time.sleep(random.randint(1, 3))
 30
 31
 32 # 抓取翻页数据
 33 def get_pages(url):
 34     page_html = retry_request(url)
 35     html_obj = etree.HTML(page_html)
 36     # xpath获取每个房屋部分
 37     ports = html_obj.xpath('//*[@class="info clear"]')
 38     lis = []
 39     for port in ports:
 40         # 解析详情url
 41         try:
 42             url = port.xpath('.//*[@class="title"]/a[1]/@href')[0]
 43         except:
 44             url = ''
 45         # 解析总价
 46         try:
 47             total_price = port.xpath('.//*[@class="totalPrice totalPrice2"]//text()')
 48             total_price = ''.join(total_price).strip().replace('\n', '')
 49         except:
 50             total_price = ''
 51         # 解析单价
 52         try:
 53             unit_price = port.xpath('.//*[@class="unitPrice"]//text()')
 54             unit_price = ''.join(unit_price)
 55         except:
 56             unit_price = ''
 57         # 将当前房屋数据加到house列表里
 58         list_data = [url, unit_price, total_price]
 59         lis.append(list_data)
 60     return lis
 61
 62
 63 # 抓取房屋详情信息
 64 def get_detail(infos, city_name):
 65     de_url = infos[0]
 66     page_html = retry_request(de_url)
 67     html_obj = etree.HTML(page_html)
 68     # 解析所在行政区
 69     try:
 70         xzu = html_obj.xpath('//*[@class="areaName"]//span[@class="info"]//text()')
 71         xzu = ''.join(xzu)
 72         xzq = xzu.split('\xa0')[0]
 73     except Exception as e:
 74         xzq = ''
 75     # 解析所在地址
 76     try:
 77         szqy = html_obj.xpath('//*[@class="areaName"]//span[@class="info"]//text()')
 78         szqy = ''.join(szqy)
 79         szqy = szqy.split('\xa0')[1:]
 80         szqy = ''.join(szqy).strip()
 81     except Exception as e:
 82         szqy = ''
 83     # 解析小区名称
 84     try:
 85         xqmc = html_obj.xpath('//*[@class="communityName"]/a[1]//text()')
 86         xqmc = ''.join(xqmc).strip()
 87     except Exception as e:
 88         xqmc = ''
 89     # 解析所在楼层
 90     try:
 91         szlc = html_obj.xpath('//*[@class="base"]//ul/li[2]//text()')
 92         szlc = ''.join(szlc).replace('所在楼层', '').strip()
 93     except Exception as e:
 94         szlc = ''
 95     # 解析房屋面积
 96     try:
 97         house_area = html_obj.xpath('//*[@class="area"]/div[@class="mainInfo"]//text()')
 98         house_area = ''.join(house_area).strip()
 99     except Exception as e:
100         house_area = ''
101     # 解析房屋朝向
102     try:
103         fwcx = html_obj.xpath('//span[text()="房屋朝向"]/parent::*/text()')
104         fwcx = ''.join(fwcx)
105         fwcx = fwcx.replace('房屋朝向', '').strip()
106     except Exception as e:
107         fwcx = ''
108     # 解析关注人数
109     try:
110         gzrs = html_obj.xpath('//*[@id="favCount"]/text()')[0]
111     except Exception as e:
112         gzrs = ''
113     # 解析房屋核心卖点
114     try:
115         house_good = ''.join(html_obj.xpath('//div[text()="核心卖点"]/following-sibling::div[1]//text()'))
116         house_good = house_good.strip()
117     except Exception as e:
118         house_good = ''
119     # 解析装修状态
120     try:
121         zx_status = ''.join(html_obj.xpath('//span[text()="装修情况"]/parent::*/text()'))
122         zx_status = zx_status.strip()
123     except Exception as e:
124         zx_status = ''
125     # 获取房屋单价
126     unit_price = infos[1]
127     # 获取房屋总价
128     total_price = infos[2]
2.对数据进行清洗和处理
 1 # 清洗数据
 2 def clean_data():
 3     # 将 每平方米价格 清洗成整数
 4     df['每平方米价格'] = df.每平方米价格.str.replace('[^\d]', '',regex=True)
 5     df['每平方米价格'] = df.每平方米价格.astype('int')
 6     # 将 每平方米价格 清洗成小数,并生成价格区间列
 7     df['建筑面积'] = df.建筑面积.str.replace('[^\d\.]', '',regex=True)
 8     df['建筑面积'] = df.建筑面积.astype('float')
 9     df['面积区间'] = df.建筑面积.apply(lambda x: '20㎡以下' if x <= 20 else '20.1-45㎡' if x <= 45
10     else '45.1-80㎡' if x <= 80
11     else '80.1-120㎡' if x <= 120 else '120.1㎡以上')
12     # 将 整套房总价 清洗成整数
13     df['整套房总价'] = df.整套房总价.str.replace('[^\d]', '',regex=True)
14     df['整套房总价'] = df.整套房总价.astype('int')
15
16     # 清洗 关注人数 并转换数据类型为整数类型
17     df['关注人数'] = df.关注人数.astype('str')
18     df['关注人数'] = df.关注人数.str.replace('[^\d]', '',regex=True)
19     df['关注人数'] = df.关注人数.astype('int')20
21     return df
22
23 # 接收清洗的结果集
24 clean_df = clean_data()
3.文本分析:wordcloud 的分词可视化
 1 # 提取 房屋亮点 列,生成词云图
 2 useful_df = clean_df[clean_df.房屋亮点.notnull()]
 3 sentence_str = ''.join(list(useful_df.房屋亮点))
 4 # 构造词字典,统计个各个词出现的总次数
 5 data_dict = {}
 6 # jieba分词
 7 fc_list = jieba.lcut(sentence_str)
 8 # 遍历每个词并统计
 9 for key in fc_list:
10     # 长度等于1的字,不做统计
11     if len(key) < 2:
12         continue
13     index = data_dict.get(key)
14     if index:
15         value = index + 1
16     else:
17         value = 1
18     data_dict[key] = value
19 # 加载词云背景图
20 pic_read = Image.open('bgc_pic.webp')
21 # 使用numpy获取图片外形
22 pic_mask = np.array(pic_read)
23 # 构造词云
24 word_cloud = wordcloud.WordCloud(
25     background_color='skyblue', # 设定图背景色
26     font_path=r'C:\Windows\Fonts\STHUPO.ttf',# 加载图字体
27     width=800,# 设定图宽度
28     height=800, # 设定图高度
29     mask=pic_mask, # 设定图外形
30 )
31 # 将词填充到图上
32 word_cloud.fit_words(data_dict)
33 plt.imshow(word_cloud)
34 # 关闭图坐标轴
35 plt.axis('off')
36 plt.show()
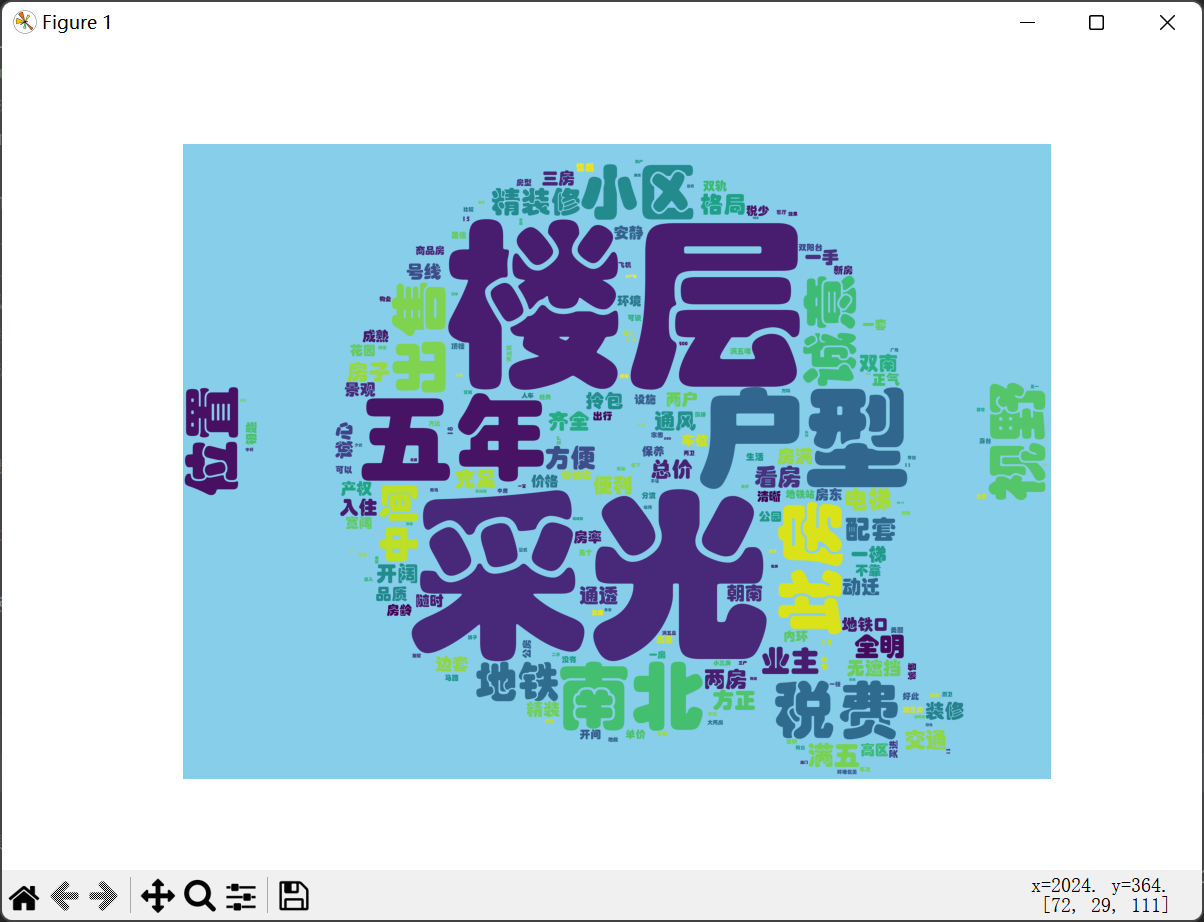
通过房屋亮点词云图可以了解到房主会着重介绍房屋的楼层与采光问题。其次是房屋的户型,位置,视野,税费,小区,精装修等。
同时,通过房主的介绍也能侧面了解到如今购房人购房时比较在意的点。
4.数据分析与可视化
(1)绘制各行政区房屋均价
 1 clean_df_city = clean_df.groupby('行政区').mean().sort_values(by='每平方米价格', ascending=False)
 2
 3 # 设置图片大小
 4 plt.figure(figsize=(14, 8))
 5 # 设置网格线
 6 plt.grid(color='steelblue', linestyle='-.')
 7 # 绘制饼图
 8 plt.bar(x=clean_df_city.index, height=[round(i, 2) for i in list(clean_df_city.每平方米价格)],
 9         align='center', color='skyblue')
10 # 加上每个值的数据标签
11 for a, b in enumerate([round(i, 2) for i in list(clean_df_city.每平方米价格)]):
12     plt.text(a, b / 1, "%d元" % round(b, 2), ha='center', fontsize=12, color='r')
13 # 设置x和y以及title标签
14 plt.xlabel('所在地区', labelpad=10, size=15)
15 plt.ylabel('房屋均价', labelpad=15, size=15)
16 plt.title('各行政区房屋均价展示', pad=20, size=20)
17 plt.show()
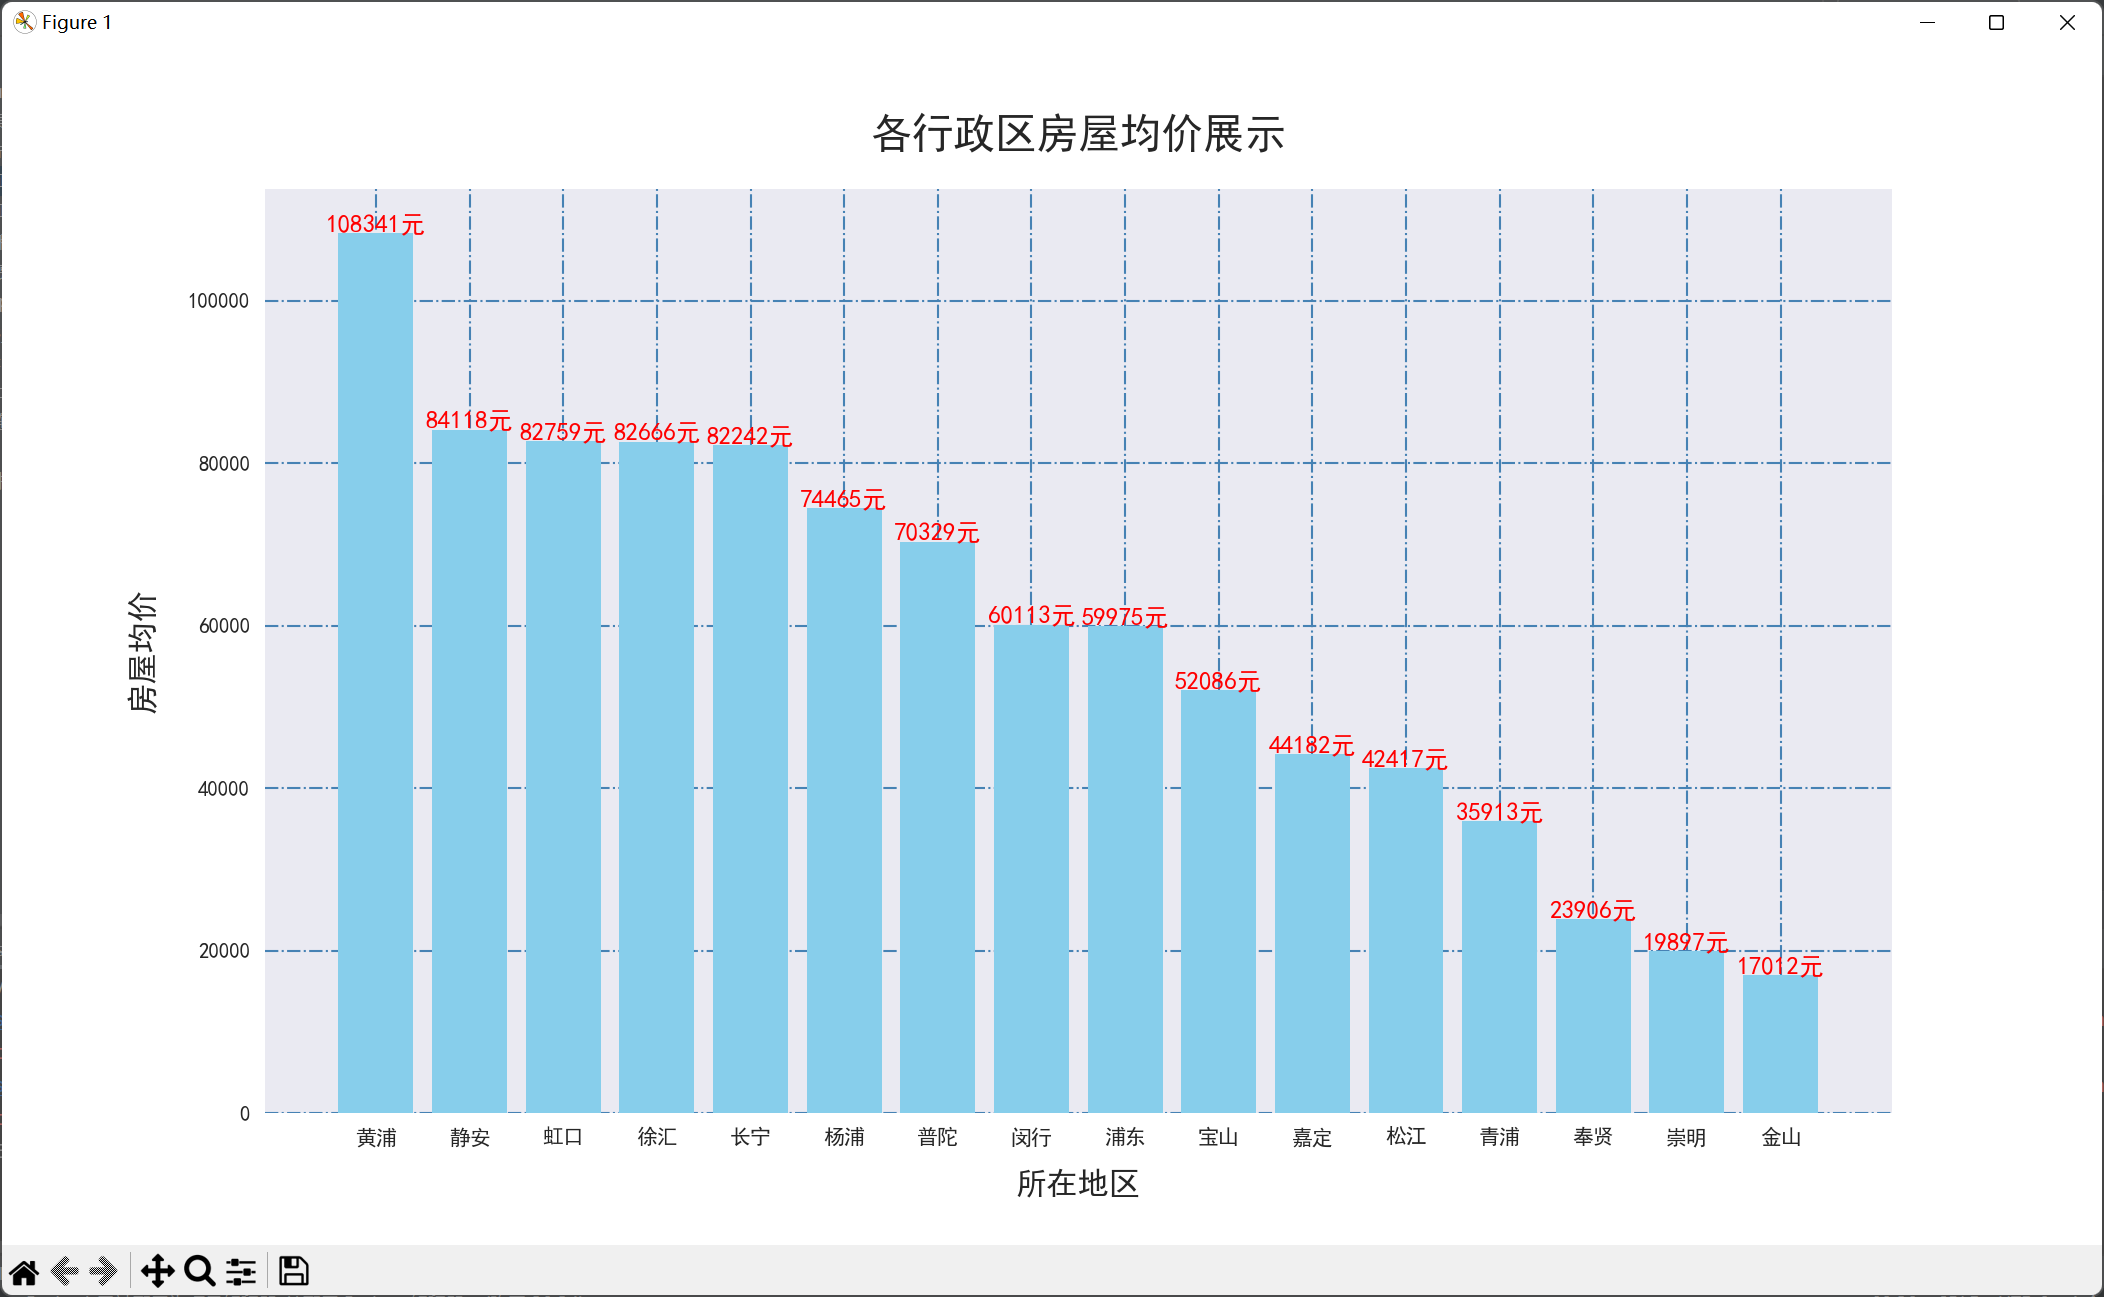
通过该图可以了解到房价最高的行政区是黄浦区,其房屋均价远高其他行政区,也能体现上海市的经济中心应该是在黄埔区,猜测其经济水平与发展应高于其他区。
(2)绘制各行政区房屋数量占比图
 1 clean_df_xzfl = clean_df.groupby('面积区间').count()
 2 plt.figure(figsize=(7, 5))
 3 # 构造饼图生成器
 4 wedges, texts, autotexts = plt.pie(clean_df_xzfl.小区名称,
 5                                    autopct="%4.2f%%",
 6                                    textprops=dict(color="w"))
 7 # 为饼图添加图例
 8 plt.legend(wedges,
 9            clean_df_xzfl.index,
10            fontsize=12,
11            title="房屋面积区间",
12            loc="center left",
13            bbox_to_anchor=(0.91, 0, 0.3, 1))
14 # 绘制饼图形状大小
15 plt.setp(autotexts, size=15, weight="bold")
16 plt.setp(texts, size=15)
17 plt.title("各面积区间房屋数量占比图", size=20)
18 plt.show()

通过该图可以直观的了解到上海市的出售的二手房大多为中小型,其中45.1-80㎡的房屋居多,其次是80.1-120㎡的房屋,两者加起来占比达82.39%。
(3)构造 各行政区房屋数量分布地图
 1 ct_map = Map(
 2     init_opts=opts.InitOpts(width="1200px", height='600px')
 3 )
 4 # 添加地图title并选定地区为上海市
 5 ct_map.add('行政区房屋数量', data_pair=data_list, maptype='上海', is_map_symbol_show=False)
 6 ct_map.set_series_opts(label_opts=opts.LabelOpts(is_show=True))
 7 ct_map.set_global_opts(
 8     title_opts=opts.TitleOpts(title='各行政区房屋数量分布图', subtitle='数据来源:链家上海二手房'),
 9     visualmap_opts=opts.VisualMapOpts(
10         # 设定各区间值,该值区间表示的是各个行政区拥有的房屋数量区间
11         pieces=[
12             {"max": 1000, "min": 450, "label": ">450", "color": "#0000CD"},
13             {"max": 450, "min": 350, "label": "350-450", "color": "#0000FF"},
14             {"max": 350, "min": 250, "label": "250-350", "color": "#00BFFF"},
15             {"max": 250, "min": 180, "label": "180-250", "color": "#00BFFF"},
16             {"max": 180, "min": 120, "label": "120-180", "color": "#87CEFA"},
17             {"max": 120, "min": 60, "label": "60-120", "color": "#87CEEB"},
18             {"max": 60, "min": 30, "label": "30-60", "color": "#ADD8E6"},
19             {"max": 30, "min": 10, "label": "10-30", "color": "#B0E0E6"},
20             {"max": 10, "min": 1, "label": "1-10", "color": "#F0F8FF"},
21         ],
22         is_piecewise=True
23     )
24 )
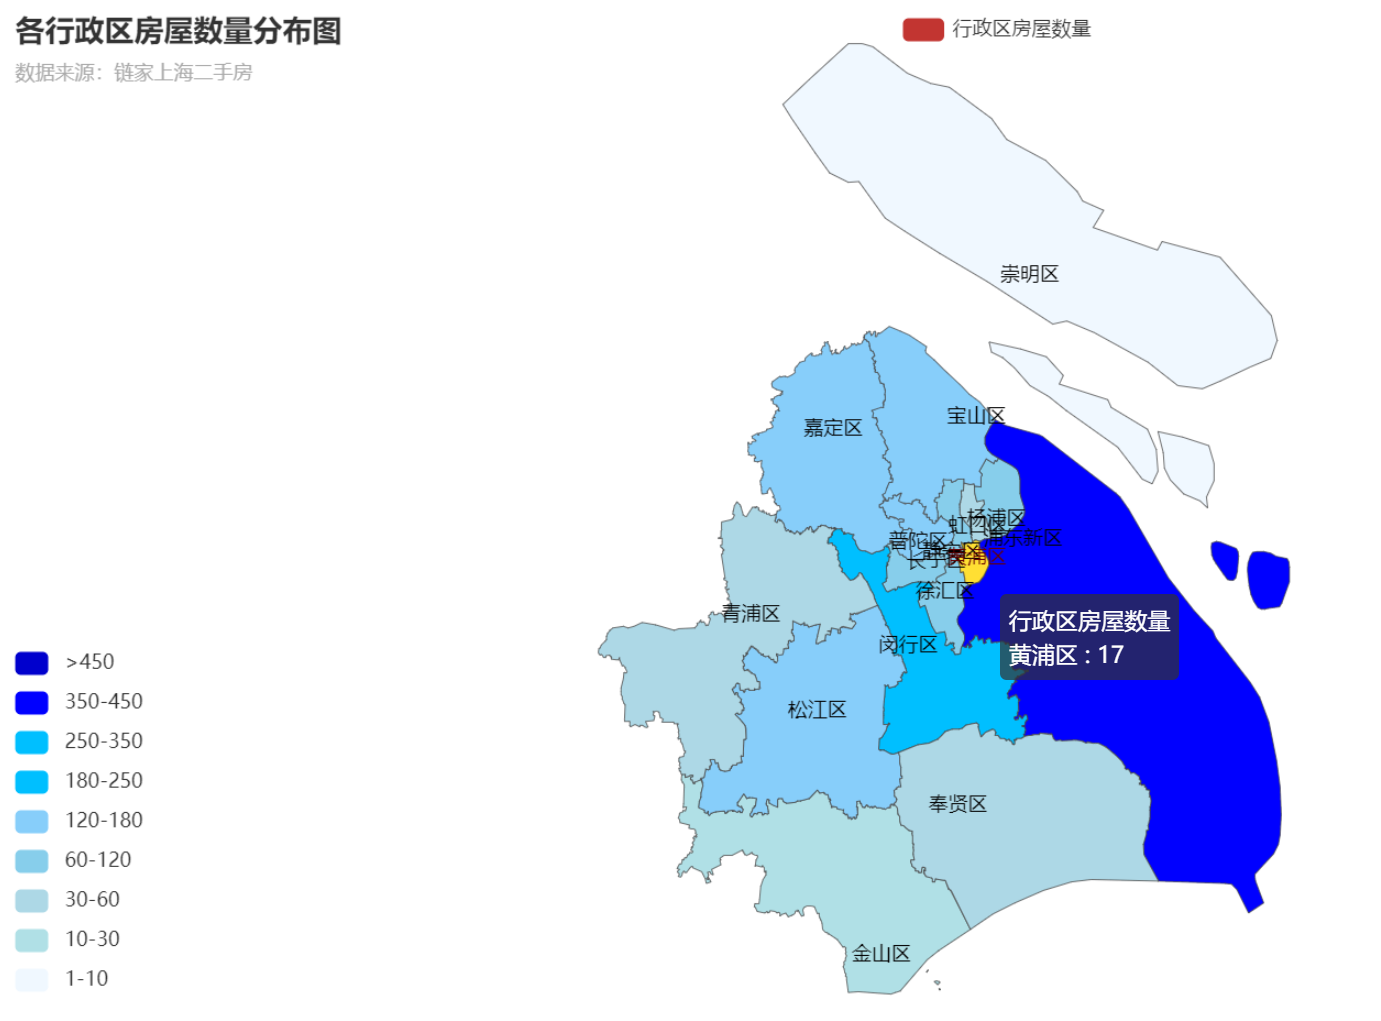
通过该图可以看出身为上海市市政府的黄浦区出售的二手房数量并不多,和其相连的浦东新区形成了强烈的对比。其原因之一也是因为浦东新区的占地面积较大。
5.数据持久化
(1)爬取数据的持久化
 1 # pandas读取csv文件并保存为Excel文件
 2 def csv2excel(city_name):
 3     df = pd.read_csv(f'{city_name}链家二手房.csv', header=None, names=['行政区', '小区名称', '每平方米价格',
 4                                                                   '整套房总价', '建筑面积', '所在楼层', '房屋朝向',
 5                                                                   '关注人数', '所在区域', '装修类型', '房屋亮点'],
 6                      encoding='utf-8')
 7     df.to_excel(f'{city_name}链家二手房.xlsx', index=False)
 8     # 删除原csv文件
 9     os.remove(f'{city_name}链家二手房.csv')
10     print('文件转换成功')
(2)创建存储分析文件的文件夹
try:
    os.mkdir('分析结果')
except Exception as e:
    print(e)
(3)将清洗的数据的持久化
df.to_excel(r'分析结果\上海市链家二手房.xlsx')
(4)各行政区房屋均价的持久化
plt.savefig('分析结果/各行政区房屋均价展示.jpg')
(5)各行政区房屋数量占比图的持久化
plt.savefig('分析结果/各面积区间房屋数量占比图.jpg')
(6)各行政区房屋数量分布地图的持久化
ct_map.render('分析结果/各行政区房屋数量分布图.html')
(7)词云图的持久化
word_cloud.to_file(r'分析结果\房屋亮点词云图.png')
6.将以上各部分的代码汇总,附上完整程序代码
(1)上海市链家二手房数据爬虫
  1 import csv
  2 import os
  3 import random
  4 import time
  5 import pandas as pd
  6 from lxml import etree
  7 import requests
  8 from retry.api import retry_call
  9
 10
 11 # 异常重试函数,防止网络不稳定导致抓取数据中断等。
 12 def retry_request(crawl_url, req_type='get', retry_times=6):
 13     while retry_times:
 14         retry_times -= 1
 15         try:
 16             # 请求头 User-Agent
 17             headers = {"User-Agent": "Mozilla/5.0 (Windows NT 10.0; Win64; x64) AppleWebKit/537.36 (KHTML, like Gecko) Chrome/105.0.0.0 Safari/537.36"}
 18             resp = retry_call(getattr(requests, req_type), fargs=[crawl_url],
 19                               fkwargs={"timeout": 60, "headers": headers}, delay=0, tries=1)
 20             # 判断请求状态码以及响应是否为空,为空则继续,反之则返回请求体
 21             if resp.status_code == 200 and resp.content:
 22                 return resp.text
 23         except Exception as e:
 24             print(e)
 25         # 重试次数用完,则直接返回异常数据
 26         if not retry_times:
 27             return '<html></html>'
 28         # 随机休眠 1-3s
 29         time.sleep(random.randint(1, 3))
 30
 31
 32 # 抓取翻页数据
 33 def get_pages(url):
 34     page_html = retry_request(url)
 35     html_obj = etree.HTML(page_html)
 36     # xpath获取每个房屋部分
 37     ports = html_obj.xpath('//*[@class="info clear"]')
 38     lis = []
 39     for port in ports:
 40         # 解析详情url
 41         try:
 42             url = port.xpath('.//*[@class="title"]/a[1]/@href')[0]
 43         except:
 44             url = ''
 45         # 解析总价
 46         try:
 47             total_price = port.xpath('.//*[@class="totalPrice totalPrice2"]//text()')
 48             total_price = ''.join(total_price).strip().replace('\n', '')
 49         except:
 50             total_price = ''
 51         # 解析单价
 52         try:
 53             unit_price = port.xpath('.//*[@class="unitPrice"]//text()')
 54             unit_price = ''.join(unit_price)
 55         except:
 56             unit_price = ''
 57         # 将当前房屋数据加到house列表里
 58         list_data = [url, unit_price, total_price]
 59         lis.append(list_data)
 60     return lis
 61
 62
 63 # 抓取房屋详情信息
 64 def get_detail(infos, city_name):
 65     de_url = infos[0]
 66     page_html = retry_request(de_url)
 67     html_obj = etree.HTML(page_html)
 68     # 解析所在行政区
 69     try:
 70         xzu = html_obj.xpath('//*[@class="areaName"]//span[@class="info"]//text()')
 71         xzu = ''.join(xzu)
 72         xzq = xzu.split('\xa0')[0]
 73     except Exception as e:
 74         xzq = ''
 75     # 解析所在地址
 76     try:
 77         szqy = html_obj.xpath('//*[@class="areaName"]//span[@class="info"]//text()')
 78         szqy = ''.join(szqy)
 79         szqy = szqy.split('\xa0')[1:]
 80         szqy = ''.join(szqy).strip()
 81     except Exception as e:
 82         szqy = ''
 83     # 解析小区名称
 84     try:
 85         xqmc = html_obj.xpath('//*[@class="communityName"]/a[1]//text()')
 86         xqmc = ''.join(xqmc).strip()
 87     except Exception as e:
 88         xqmc = ''
 89     # 解析所在楼层
 90     try:
 91         szlc = html_obj.xpath('//*[@class="base"]//ul/li[2]//text()')
 92         szlc = ''.join(szlc).replace('所在楼层', '').strip()
 93     except Exception as e:
 94         szlc = ''
 95     # 解析房屋面积
 96     try:
 97         house_area = html_obj.xpath('//*[@class="area"]/div[@class="mainInfo"]//text()')
 98         house_area = ''.join(house_area).strip()
 99     except Exception as e:
100         house_area = ''
101     # 解析房屋朝向
102     try:
103         fwcx = html_obj.xpath('//span[text()="房屋朝向"]/parent::*/text()')
104         fwcx = ''.join(fwcx)
105         fwcx = fwcx.replace('房屋朝向', '').strip()
106     except Exception as e:
107         fwcx = ''
108     # 解析关注人数
109     try:
110         gzrs = html_obj.xpath('//*[@id="favCount"]/text()')[0]
111     except Exception as e:
112         gzrs = ''
113     # 解析房屋核心卖点
114     try:
115         house_good = ''.join(html_obj.xpath('//div[text()="核心卖点"]/following-sibling::div[1]//text()'))
116         house_good = house_good.strip()
117     except Exception as e:
118         house_good = ''
119     # 解析装修状态
120     try:
121         zx_status = ''.join(html_obj.xpath('//span[text()="装修情况"]/parent::*/text()'))
122         zx_status = zx_status.strip()
123     except Exception as e:
124         zx_status = ''
125     # 获取房屋单价
126     unit_price = infos[1]
127     # 获取房屋总价
128     total_price = infos[2]
129     # 数据写入csv文件里
130     data_item = [xzq, xqmc, unit_price, total_price, house_area, szlc,
131              fwcx, gzrs, szqy, zx_status, house_good]
132     print(data_item)
133     with open(f'{city_name}链家二手房.csv', 'a', encoding='utf-8', newline='') as f:
134         csvwriter = csv.writer(f)
135         csvwriter.writerow(data_item)
136
137
138 # pandas读取csv文件并保存为Excel文件
139 def csv2excel(city_name):
140     df = pd.read_csv(f'{city_name}链家二手房.csv', header=None, names=['行政区', '小区名称', '每平方米价格',
141                                                                   '整套房总价', '建筑面积', '所在楼层', '房屋朝向',
142                                                                   '关注人数', '所在区域', '装修类型', '房屋亮点'],
143                      encoding='utf-8')
144     df.to_excel(f'{city_name}链家二手房.xlsx', index=False)
145     # 删除原csv文件
146     os.remove(f'{city_name}链家二手房.csv')
147     print('文件转换成功')
148
149
150 # 程序执行主函数
151 def main():
152     city_name = '上海市'
153     # 翻页1 - 60页,共计抓取一千多套房屋
154     for page in range(1, 61):
155         print(f'正在抓取城市:{city_name} 的第{page}页')
156         page_url = f'https://sh.lianjia.com/ershoufang/pg{page}/'
157         infos = get_pages(page_url)
158         # 遍历每套房屋,抓取其详情信息
159         for info in infos:
160             try:
161                 get_detail(info, city_name)
162             except Exception as e:
163                 print(e)
164             time.sleep(random.randint(1, 2))
165     try:
166         csv2excel(city_name)
167     except Exception as e:
168         print(e)
169
170
171 main()
(2)数据可视化
  1 import os
  2
  3 import jieba
  4 import wordcloud
  5 from PIL import Image
  6 import numpy as np
  7 import pandas as pd
  8 import matplotlib.pyplot as plt
  9 import matplotlib
 10 from pyecharts import options as opts
 11 from pyecharts.charts import Map
 12 matplotlib.use('TkAgg')
 13 plt.style.use('seaborn')
 14
 15 # 设置图片背景色
 16 plt.style.use('seaborn')
 17 plt.rcParams['font.sans-serif'] = ['SimHei']  # 用于正常显示中文标签
 18 plt.rcParams['axes.unicode_minus'] = False  # 用于正常显示负号
 19
 20 # 读取数据集
 21 df = pd.read_excel('上海市链家二手房.xlsx', sheet_name='Sheet1', header=0)
 22
 23 # 创建存储分析文件的文件夹
 24 try:
 25     os.mkdir('分析结果')
 26 except Exception as e:
 27     print(e)
 28
 29 # 清洗数据
 30 def clean_data():
 31     # 将 每平方米价格 清洗成整数
 32     df['每平方米价格'] = df.每平方米价格.str.replace('[^\d]', '',regex=True)
 33     df['每平方米价格'] = df.每平方米价格.astype('int')
 34     # 将 每平方米价格 清洗成小数,并生成价格区间列
 35     df['建筑面积'] = df.建筑面积.str.replace('[^\d\.]', '',regex=True)
 36     df['建筑面积'] = df.建筑面积.astype('float')
 37     df['面积区间'] = df.建筑面积.apply(lambda x: '20㎡以下' if x <= 20 else '20.1-45㎡' if x <= 45
 38     else '45.1-80㎡' if x <= 80
 39     else '80.1-120㎡' if x <= 120 else '120.1㎡以上')
 40     # 将 整套房总价 清洗成整数
 41     df['整套房总价'] = df.整套房总价.str.replace('[^\d]', '',regex=True)
 42     df['整套房总价'] = df.整套房总价.astype('int')
 43
 44     # 清洗 关注人数 并转换数据类型为整数类型
 45     df['关注人数'] = df.关注人数.astype('str')
 46     df['关注人数'] = df.关注人数.str.replace('[^\d]', '',regex=True)
 47     df['关注人数'] = df.关注人数.astype('int')
 48     # 将清洗的结果存到文件 上海市链家二手房.xlsx
 49     df.to_excel(r'分析结果\上海市链家二手房.xlsx')
 50
 51     return df
 52
 53 # 接收清洗的结果集
 54 clean_df = clean_data()
 55
 56 # 绘制各行政区房屋均价
 57 clean_df_city = clean_df.groupby('行政区').mean().sort_values(by='每平方米价格', ascending=False)
 58
 59 # 设置图片大小
 60 plt.figure(figsize=(14, 8))
 61 # 设置网格线
 62 plt.grid(color='steelblue', linestyle='-.')
 63 # 绘制饼图
 64 plt.bar(x=clean_df_city.index, height=[round(i, 2) for i in list(clean_df_city.每平方米价格)],
 65         align='center', color='skyblue')
 66 # 加上每个值的数据标签
 67 for a, b in enumerate([round(i, 2) for i in list(clean_df_city.每平方米价格)]):
 68     plt.text(a, b / 1, "%d元" % round(b, 2), ha='center', fontsize=12, color='r')
 69 # 设置x和y以及title标签
 70 plt.xlabel('所在地区', labelpad=10, size=15)
 71 plt.ylabel('房屋均价', labelpad=15, size=15)
 72 plt.title('各行政区房屋均价展示', pad=20, size=20)
 73 # 保存图片到 分析结果文件夹中
 74 plt.savefig('分析结果/各行政区房屋均价展示.jpg')
 75 plt.show()
 76
 77 # 绘制各行政区房屋数量占比图
 78 clean_df_xzfl = clean_df.groupby('面积区间').count()
 79 plt.figure(figsize=(7, 5))
 80 # 构造饼图生成器
 81 wedges, texts, autotexts = plt.pie(clean_df_xzfl.小区名称,
 82                                    autopct="%4.2f%%",
 83                                    textprops=dict(color="w"))
 84 # 为饼图添加图例
 85 plt.legend(wedges,
 86            clean_df_xzfl.index,
 87            fontsize=12,
 88            title="房屋面积区间",
 89            loc="center left",
 90            bbox_to_anchor=(0.91, 0, 0.3, 1))
 91 # 绘制饼图形状大小
 92 plt.setp(autotexts, size=15, weight="bold")
 93 plt.setp(texts, size=15)
 94 plt.title("各面积区间房屋数量占比图", size=20)
 95 # 保存图片到 分析结果文件夹中
 96 plt.savefig('分析结果/各面积区间房屋数量占比图.jpg')
 97 plt.show()
 98
 99 # 统计行政区列,并生成字典数据,记录每个行政区拥有的房屋数量
100 xzq_dict = {}
101 xzq_list = list(clean_df.行政区)
102 for zxq in xzq_list:
103     # 构建上海市各行政区列表
104     area_list = ['黄浦区', '徐汇区', '长宁区', '静安区', '普陀区', '虹口区', '杨浦区', '浦东新区', '闵行区', '宝山区',
105  '嘉定区', '金山区', '松江区', '青浦区', '奉贤区', '崇明区']
106     # 遍历并取到当前key对应的行政区名称
107     for area in area_list:
108         if zxq in area:
109             new_area = area
110             break
111     # 获取值,如果值存在,则加1,否则赋值为1
112     data = xzq_dict.get(new_area)
113     if data:
114         value = data + 1
115     else:
116         value = 1
117     xzq_dict[new_area] = value
118
119 # 将统计行政区结果转成list数据
120 data_list = list(xzq_dict.items())
121 print(data_list)
122 # 构造 各行政区房屋数量分布地图
123 ct_map = Map(
124     init_opts=opts.InitOpts(width="1200px", height='600px')
125 )
126 # 添加地图title并选定地区为上海市
127 ct_map.add('行政区房屋数量', data_pair=data_list, maptype='上海', is_map_symbol_show=False)
128 ct_map.set_series_opts(label_opts=opts.LabelOpts(is_show=True))
129 ct_map.set_global_opts(
130     title_opts=opts.TitleOpts(title='各行政区房屋数量分布图', subtitle='数据来源:链家上海二手房'),
131     visualmap_opts=opts.VisualMapOpts(
132         # 设定各区间值,该值区间表示的是各个行政区拥有的房屋数量区间
133         pieces=[
134             {"max": 1000, "min": 450, "label": ">450", "color": "#0000CD"},
135             {"max": 450, "min": 350, "label": "350-450", "color": "#0000FF"},
136             {"max": 350, "min": 250, "label": "250-350", "color": "#00BFFF"},
137             {"max": 250, "min": 180, "label": "180-250", "color": "#00BFFF"},
138             {"max": 180, "min": 120, "label": "120-180", "color": "#87CEFA"},
139             {"max": 120, "min": 60, "label": "60-120", "color": "#87CEEB"},
140             {"max": 60, "min": 30, "label": "30-60", "color": "#ADD8E6"},
141             {"max": 30, "min": 10, "label": "10-30", "color": "#B0E0E6"},
142             {"max": 10, "min": 1, "label": "1-10", "color": "#F0F8FF"},
143         ],
144         is_piecewise=True
145     )
146 )
147 # 保存结果到 各行政区房屋数量分布图.html 文件中
148 ct_map.render('分析结果/各行政区房屋数量分布图.html')
149
150 # 提取 房屋亮点 列,生成词云图
151 useful_df = clean_df[clean_df.房屋亮点.notnull()]
152 sentence_str = ''.join(list(useful_df.房屋亮点))
153 # 构造词字典,统计个各个词出现的总次数
154 data_dict = {}
155 # jieba分词
156 fc_list = jieba.lcut(sentence_str)
157 # 遍历每个词并统计
158 for key in fc_list:
159     # 长度等于1的字,不做统计
160     if len(key) < 2:
161         continue
162     index = data_dict.get(key)
163     if index:
164         value = index + 1
165     else:
166         value = 1
167     data_dict[key] = value
168 # 加载词云背景图
169 pic_read = Image.open('bgc_pic.webp')
170 # 使用numpy获取图片外形
171 pic_mask = np.array(pic_read)
172 # 构造词云
173 word_cloud = wordcloud.WordCloud(
174     background_color='skyblue', # 设定图背景色
175     font_path=r'C:\Windows\Fonts\STHUPO.ttf',# 加载图字体
176     width=800,# 设定图宽度
177     height=800, # 设定图高度
178     mask=pic_mask, # 设定图外形
179 )
180 # 将词填充到图上
181 word_cloud.fit_words(data_dict)
182 plt.imshow(word_cloud)
183 # 关闭图坐标轴
184 plt.axis('off')
185 plt.show()
186 # 词云保存到文件里
187 word_cloud.to_file(r'分析结果\房屋亮点词云图.png')
五、总结
通过本次主题式网络爬虫及数据可视化分析可以得出房屋均价最高的行政区是黄埔区,其地理位置于上海市中心,而围绕它一圈的几个行政区房价也明显高于其他行政区,结合其房价可得知黄埔区应为上海市的经济中心,上海市的经济也以黄浦区为中心辐射。浦东新区的二手房出售量最大,其交易量应也是上海市最大的,原因之一就是因为其占地面积较大。而与其面积相近的崇明区的二手房出售量却远不及浦东新区,原因便在于崇明区远离黄浦区,且地理位置较为偏僻。
经过这次项目的实践,我从中明白了如何爬取深度子节点的数据,在查阅资料的时候对网络爬虫框架和网络爬虫库和反爬虫机制有了一定的了解,也补充了一些如HTTP协议、HTML、CSS、JavaScript等基础知识,对网络爬虫有了更加深入的了解。也学到了python爬虫的道德规范——robots协议,它告知爬虫等搜索引擎哪些页面可以抓取,哪些不能。它只是一个通行的道德规范,没有强制性规定,完全由个人意愿遵守。作为一名有道德的技术人员,遵守robots协议,有助于建立更好的互联网环境。

