

elk-7.15.1版本---收集nginx日志并用kibana图形化分析日志
配置nginx日志格式,输出为json格式
 log_format json '{ "@timestamp":"$time_iso8601",'
                  '"@source":"$server_addr",'
                  '"time_local":"$time_local",'
                  '"remote_addr":"$remote_addr",'
                  '"remote_port":"$remote_port",'
                  '"remote_user":"$remote_user",'
                  '"server_name":"$server_name",'
                  '"server_port":"$server_port",'
                  '"server_protocol":"$server_protocol",'
                  '"request":"$request",'
                  '"request_uri":"$request_uri",'
                  '"uri":"$uri",'
                  '"request_time":"$request_time",'
                  '"request_method":"$request_method",'
                  '"request_length":$request_length,'
                  '"status":"$status",'
                  '"scheme":"$scheme",'
                  '"body_bytes_sent":"$body_bytes_sent",'
                  '"bytes_sent":"$bytes_sent",'
                  '"request_body":"$request_body",'
                  '"upstream_addr":"$upstream_addr",'
                  '"upstream_response_time":"$upstream_response_time",'
                  '"upstream_status":"$upstream_status",'
                  '"http_host":"$http_host",'
                  '"http_referrer":"$http_referer",'
                  '"http_user_agent":"$http_user_agent",'
                  '"http_x_forwarded_for":"$http_x_forwarded_for",'
                  '"connection":"$connection",'
                  '"connection_requests":"$connection_requests",'
                  '"content_length":"$content_length",'
                  '"content_type":"$content_type",'
                  '"cookie_name":"$cookie_name",'
                  '"limit_rate":"$limit_rate",'
                  '"hostname":"$hostname",'
                  '"args":"$args",'
                  '"https":"$https",'
                  '"http_cookie":"$http_cookie",'
                  '"msec":"$msec",'
                  '"pid":"$pid"}';

access_log  /usr/local/nginx/logs/access.log json;
配置filebeat收集nginx日志缓存到redis中
filebeat.config.modules:
  path: ${path.config}/modules.d/*.yml
  reload.enabled: false

setup.template.settings:
  index.number_of_shards: 1

filebeat.inputs:

- type: log
  enabled: true
  paths:
    - "/usr/local/nginx/logs/access.log"
  fields:
    app_id: "access.log"

- type: log
  enabled: true
  paths:
    - "/usr/local/nginx/logs/error.log"
  fields:
    app_id: "error.log"

output.redis:
  hosts: ["192.168.10.46:6380"]
  password: ""
  db: 2
  key: "nginx"
  keys:
    - key: "%{[fields.list]}"
      mappings:
        app_id: "access.log"
        app_id: "error.log"
  worker: 4
  timeout: 20
  max_retries: 3
  codec.json:
    pretty: false

monitoring.enabled: true
monitoring.elasticsearch:
  hosts: ["http://172.17.9.31:9200","http://172.17.9.31:9200"]
使用logstash从redis中取出日志,格式化输出到elasticsearch集群中
input {
    redis {
        host => "172.17.9.33"
        port => 6379
        db => 2
        key => "nginx"

        data_type => "list"
        threads => 4
        tags => "nginx"
    }
}

filter {
    if "nginx" in [tags] {
        json {
            source => "message"
        }
        grok {
            match => [ "message", "%{HTTPDATE:[@metadata][timestamp]}" ]
        }
        date {
            match => [ "[@metadata][timestamp]", "dd/MMM/yyyy:HH:mm:ss Z" ]
        }

    }
}

output {

    if "nginx" in [tags] {
        if [fields][app_id] == "access.log" {
            elasticsearch {
                hosts => ["172.17.9.31:9200","172.17.9.32:9200"]
                index => "logstash-nginx-access.log-%{+YYYY.MM.dd}"
            }
        }

        if [fields][app_id] == "error.log" {
            elasticsearch {
                hosts => ["172.17.9.31:9200","172.17.9.32:9200"]
                index => "logstash-nginx-error.log%{+YYYY.MM.dd}"
            }
        }

    }


}
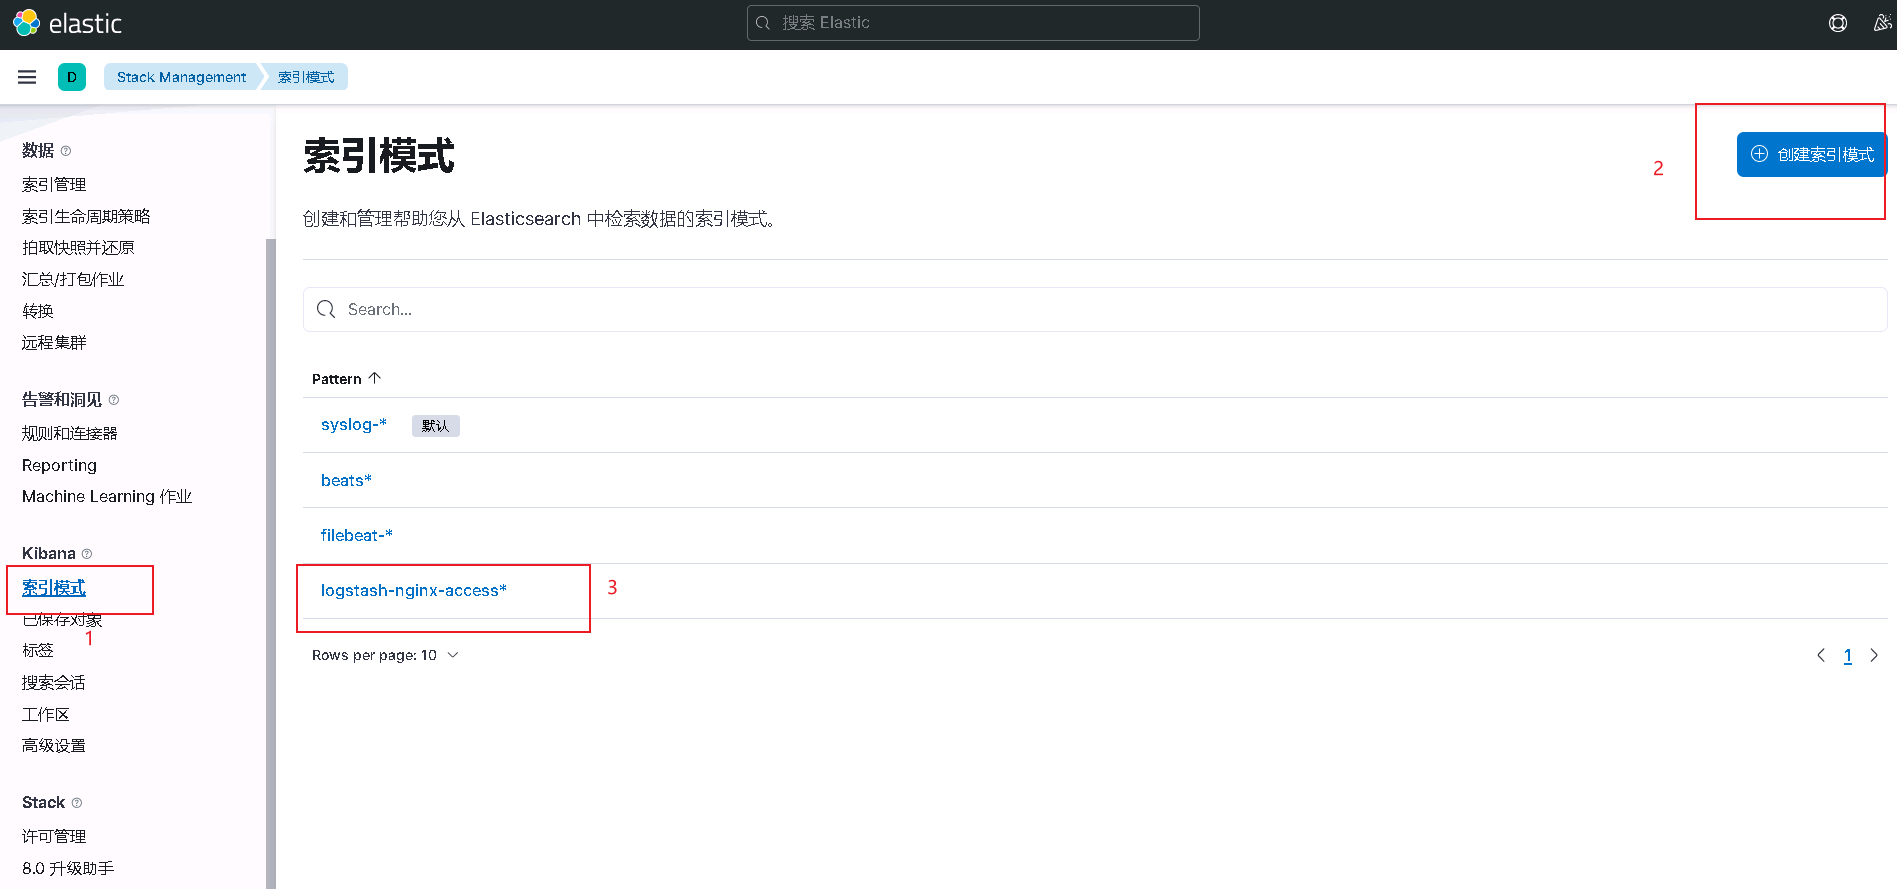
配置kibana,新增索引
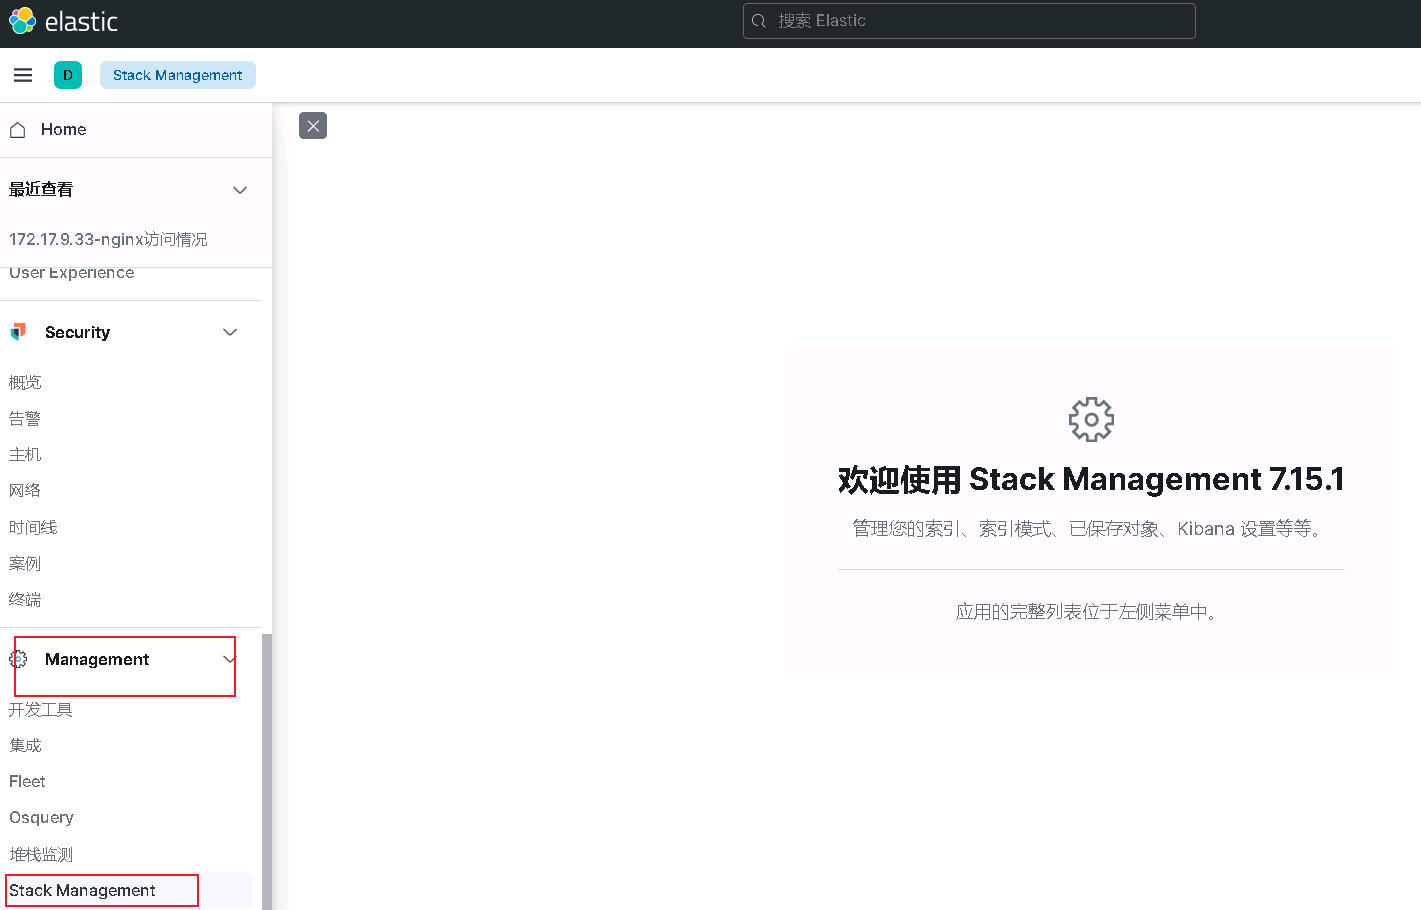
创建索引模式
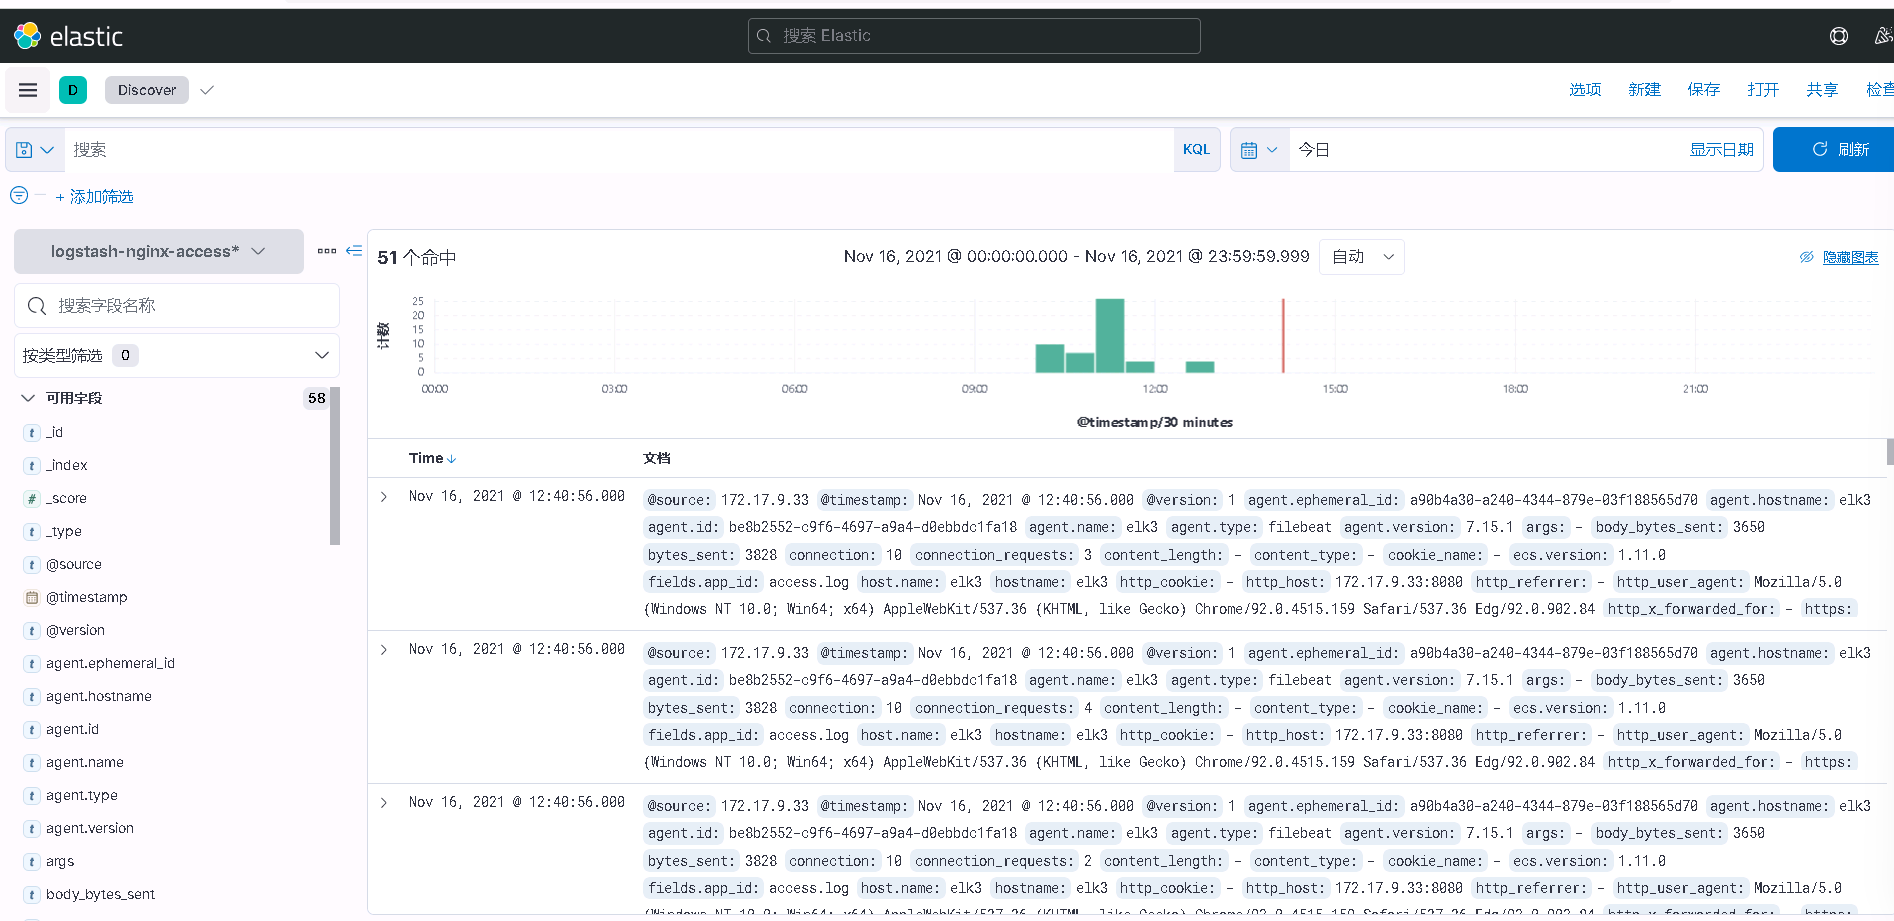
访问nginx,查看kibana数据,正常返回即可
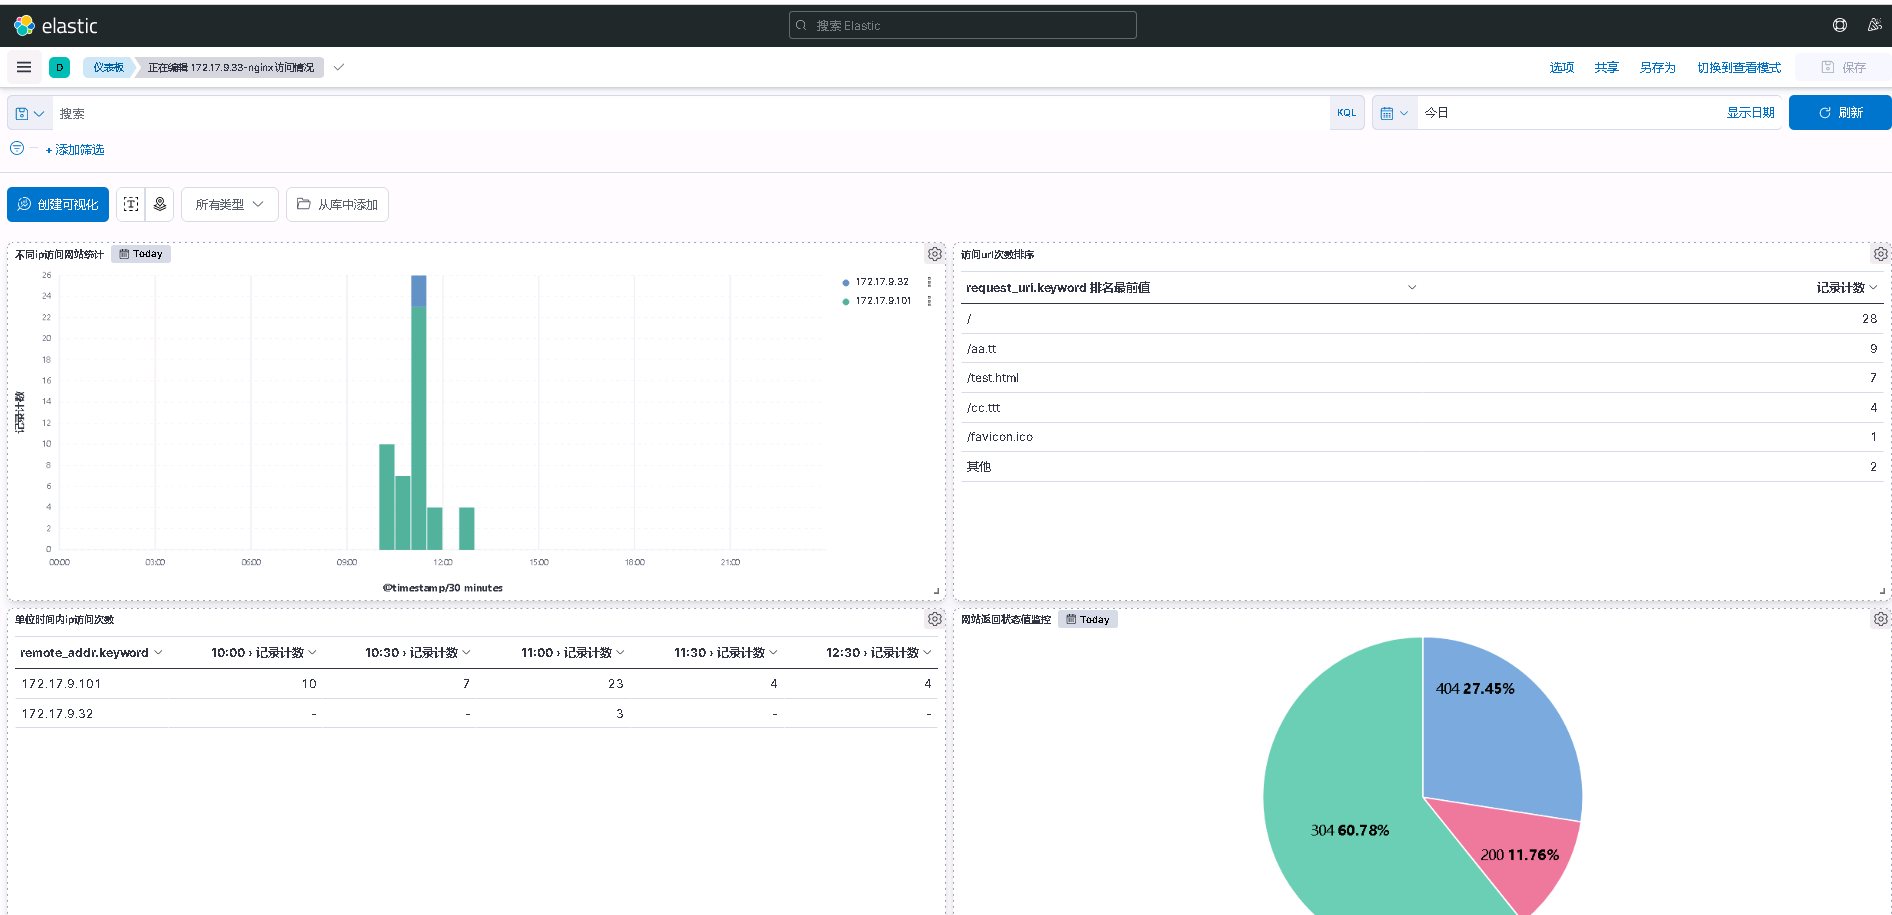
然后点击overview,创建仪表盘,根据自己需求创建即可。
下边为我创建的仪表盘,统计了每个IP不同时间访问次数,访问网站url次数,访问网站来源IP次数,返回状态码比例。

 浙公网安备 33010602011771号