7 Types of Regression Techniques you should know!
翻译来自:http://news.csdn.net/article_preview.html?preview=1&reload=1&arcid=2825492
摘要:本文解释了回归分析及其优势,重点总结了应该掌握的线性回归、逻辑回归、多项式回归、逐步回归、岭回归、套索回归、ElasticNet回归等七种最常用的回归技术及其关键要素,最后介绍了选择正确的回归模型的关键因素。
【编者按】回归分析是建模和分析数据的重要工具。本文解释了回归分析的内涵及其优势,重点总结了应该掌握的线性回归、逻辑回归、多项式回归、逐步回归、岭回归、套索回归、ElasticNet回归等七种最常用的回归技术及其关键要素,最后介绍了选择正确的回归模型的关键因素。
什么是回归分析?
回归分析是一种预测性的建模技术,它研究的是因变量(目标)和自变量(预测器)之间的关系。这种技术通常用于预测分析,时间序列模型以及发现变量之间的因果关系。例如,司机的鲁莽驾驶与道路交通事故数量之间的关系,最好的研究方法就是回归。
回归分析是建模和分析数据的重要工具。在这里,我们使用曲线/线来拟合这些数据点,在这种方式下,从曲线或线到数据点的距离差异最小。我会在接下来的部分详细解释这一点。

我们为什么使用回归分析?
如上所述,回归分析估计了两个或多个变量之间的关系。下面,让我们举一个简单的例子来理解它:
比如说,在当前的经济条件下,你要估计一家公司的销售额增长情况。现在,你有公司最新的数据,这些数据显示出销售额增长大约是经济增长的2.5倍。那么使用回归分析,我们就可以根据当前和过去的信息来预测未来公司的销售情况。
使用回归分析的好处良多。具体如下:
- 它表明自变量和因变量之间的显著关系;
- 它表明多个自变量对一个因变量的影响强度。
回归分析也允许我们去比较那些衡量不同尺度的变量之间的相互影响,如价格变动与促销活动数量之间联系。这些有利于帮助市场研究人员,数据分析人员以及数据科学家排除并估计出一组最佳的变量,用来构建预测模型。
我们有多少种回归技术?
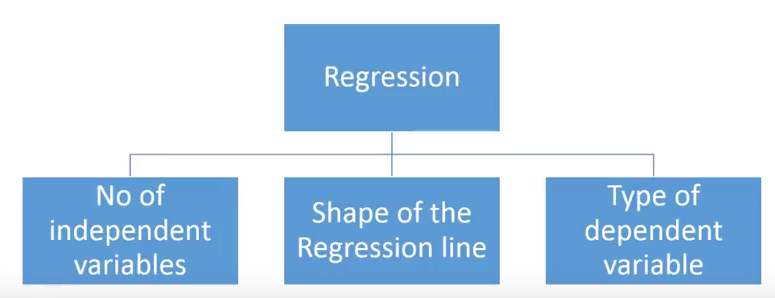
有各种各样的回归技术用于预测。这些技术主要有三个度量(自变量的个数,因变量的类型以及回归线的形状)。我们将在下面的部分详细讨论它们。

对于那些有创意的人,如果你觉得有必要使用上面这些参数的一个组合,你甚至可以创造出一个没有被使用过的回归模型。但在你开始之前,先了解如下最常用的回归方法:
1. Linear Regression线性回归
它是最为人熟知的建模技术之一。线性回归通常是人们在学习预测模型时首选的技术之一。在这种技术中,因变量是连续的,自变量可以是连续的也可以是离散的,回归线的性质是线性的。
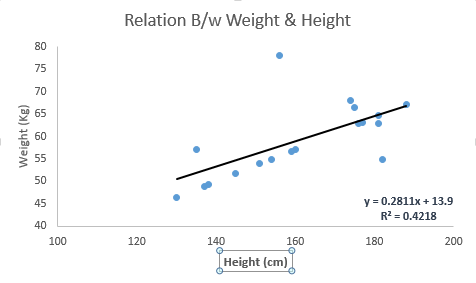
线性回归使用最佳的拟合直线(也就是回归线)在因变量(Y)和一个或多个自变量(X)之间建立一种关系。
用一个方程式来表示它,即Y=a+b*X + e,其中a表示截距,b表示直线的斜率,e是误差项。这个方程可以根据给定的预测变量(s)来预测目标变量的值。

一元线性回归和多元线性回归的区别在于,多元线性回归有(>1)个自变量,而一元线性回归通常只有1个自变量。现在的问题是“我们如何得到一个最佳的拟合线呢?”。
如何获得最佳拟合线(a和b的值)?
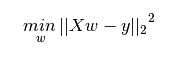
这个问题可以使用最小二乘法轻松地完成。最小二乘法也是用于拟合回归线最常用的方法。对于观测数据,它通过最小化每个数据点到线的垂直偏差平方和来计算最佳拟合线。因为在相加时,偏差先平方,所以正值和负值没有抵消。


我们可以使用R-square指标来评估模型性能。想了解这些指标的详细信息,可以阅读:模型性能指标Part 1,Part 2 .
要点:
- 自变量与因变量之间必须有线性关系
- 多元回归存在多重共线性,自相关性和异方差性。
- 线性回归对异常值非常敏感。它会严重影响回归线,最终影响预测值。
- 多重共线性会增加系数估计值的方差,使得在模型轻微变化下,估计非常敏感。结果就是系数估计值不稳定
- 在多个自变量的情况下,我们可以使用向前选择法,向后剔除法和逐步筛选法来选择最重要的自变量。
2.Logistic Regression逻辑回归
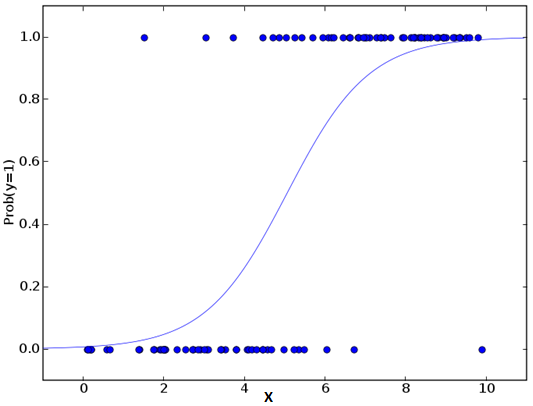
逻辑回归是用来计算“事件=Success”和“事件=Failure”的概率。当因变量的类型属于二元(1 / 0,真/假,是/否)变量时,我们就应该使用逻辑回归。这里,Y的值从0到1,它可以用下方程表示。
odds= p/ (1-p) = probability of event occurrence / probability of not event occurrence
ln(odds) = ln(p/(1-p))
logit(p) = ln(p/(1-p)) = b0+b1X1+b2X2+b3X3....+bkXk
上述式子中,p表述具有某个特征的概率。你应该会问这样一个问题:“我们为什么要在公式中使用对数log呢?”。
因为在这里我们使用的是的二项分布(因变量),我们需要选择一个对于这个分布最佳的连结函数。它就是Logit函数。在上述方程中,通过观测样本的极大似然估计值来选择参数,而不是最小化平方和误差(如在普通回归使用的)。

要点:
- 它广泛的用于分类问题。
- 逻辑回归不要求自变量和因变量是线性关系。它可以处理各种类型的关系,因为它对预测的相对风险指数OR使用了一个非线性的log转换。
- 为了避免过拟合和欠拟合,我们应该包括所有重要的变量。有一个很好的方法来确保这种情况,就是使用逐步筛选方法来估计逻辑回归。
- 它需要大的样本量,因为在样本数量较少的情况下,极大似然估计的效果比普通的最小二乘法差。
- 自变量不应该相互关联的,即不具有多重共线性。然而,在分析和建模中,我们可以选择包含分类变量相互作用的影响。
- 如果因变量的值是定序变量,则称它为序逻辑回归。
- 如果因变量是多类的话,则称它为多元逻辑回归。
3. Polynomial Regression多项式回归
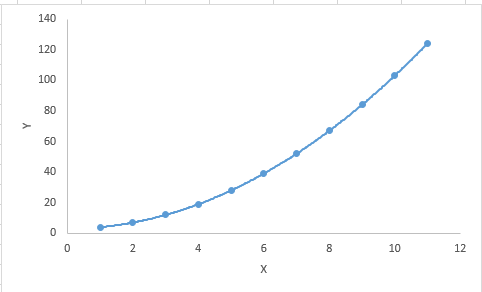
对于一个回归方程,如果自变量的指数大于1,那么它就是多项式回归方程。如下方程所示:
y=a+b*x^2
在这种回归技术中,最佳拟合线不是直线。而是一个用于拟合数据点的曲线。

重点:
- 虽然会有一个诱导可以拟合一个高次多项式并得到较低的错误,但这可能会导致过拟合。你需要经常画出关系图来查看拟合情况,并且专注于保证拟合合理,既没有过拟合又没有欠拟合。下面是一个图例,可以帮助理解:

- 明显地向两端寻找曲线点,看看这些形状和趋势是否有意义。更高次的多项式最后可能产生怪异的推断结果。
4. Stepwise Regression逐步回归
在处理多个自变量时,我们可以使用这种形式的回归。在这种技术中,自变量的选择是在一个自动的过程中完成的,其中包括非人为操作。
这一壮举是通过观察统计的值,如R-square,t-stats和AIC指标,来识别重要的变量。逐步回归通过同时添加/删除基于指定标准的协变量来拟合模型。下面列出了一些最常用的逐步回归方法:
- 标准逐步回归法做两件事情。即增加和删除每个步骤所需的预测。
- 向前选择法从模型中最显著的预测开始,然后为每一步添加变量。
- 向后剔除法与模型的所有预测同时开始,然后在每一步消除最小显着性的变量。
这种建模技术的目的是使用最少的预测变量数来最大化预测能力。这也是处理高维数据集的方法之一。
5. Ridge Regression岭回归
岭回归分析是一种用于存在多重共线性(自变量高度相关)数据的技术。在多重共线性情况下,尽管最小二乘法(OLS)对每个变量很公平,但它们的差异很大,使得观测值偏移并远离真实值。岭回归通过给回归估计上增加一个偏差度,来降低标准误差。
上面,我们看到了线性回归方程。还记得吗?它可以表示为:
y=a+ b*x
这个方程也有一个误差项。完整的方程是:
y=a+b*x+e (error term), [error term is the value needed to correct for a prediction error between the observed and predicted value]
=> y=a+y= a+ b1x1+ b2x2+....+e, for multiple independent variables.
在一个线性方程中,预测误差可以分解为2个子分量。一个是偏差,一个是方差。预测错误可能会由这两个分量或者这两个中的任何一个造成。在这里,我们将讨论由方差所造成的有关误差。
岭回归通过收缩参数λ(lambda)解决多重共线性问题。看下面的公式

在这个公式中,有两个组成部分。第一个是最小二乘项,另一个是β2(β-平方)的λ倍,其中β是相关系数。为了收缩参数把它添加到最小二乘项中以得到一个非常低的方差。
要点:
- 除常数项以外,这种回归的假设与最小二乘回归类似;
- 它收缩了相关系数的值,但没有达到零,这表明它没有特征选择功能
- 这是一个正则化方法,并且使用的是L2正则化。
6. Lasso Regression套索回归
它类似于岭回归,Lasso (Least Absolute Shrinkage and Selection Operator)也会惩罚回归系数的绝对值大小。此外,它能够减少变化程度并提高线性回归模型的精度。看看下面的公式:

Lasso 回归与Ridge回归有一点不同,它使用的惩罚函数是绝对值,而不是平方。这导致惩罚(或等于约束估计的绝对值之和)值使一些参数估计结果等于零。使用惩罚值越大,进一步估计会使得缩小值趋近于零。这将导致我们要从给定的n个变量中选择变量。
要点:
- 除常数项以外,这种回归的假设与最小二乘回归类似;
- 它收缩系数接近零(等于零),这确实有助于特征选择;
- 这是一个正则化方法,使用的是L1正则化;
· 如果预测的一组变量是高度相关的,Lasso 会选出其中一个变量并且将其它的收缩为零。
7.ElasticNet回归
ElasticNet是Lasso和Ridge回归技术的混合体。它使用L1来训练并且L2优先作为正则化矩阵。当有多个相关的特征时,ElasticNet是很有用的。Lasso 会随机挑选他们其中的一个,而ElasticNet则会选择两个。

Lasso和Ridge之间的实际的优点是,它允许ElasticNet继承循环状态下Ridge的一些稳定性。
要点:
- 在高度相关变量的情况下,它会产生群体效应;
- 选择变量的数目没有限制;
- 它可以承受双重收缩。
除了这7个最常用的回归技术,你也可以看看其他模型,如Bayesian、Ecological和Robust回归。
如何正确选择回归模型?
当你只知道一个或两个技术时,生活往往很简单。我知道的一个培训机构告诉他们的学生,如果结果是连续的,就使用线性回归。如果是二元的,就使用逻辑回归!然而,在我们的处理中,可选择的越多,选择正确的一个就越难。类似的情况下也发生在回归模型中。
在多类回归模型中,基于自变量和因变量的类型,数据的维数以及数据的其它基本特征的情况下,选择最合适的技术非常重要。以下是你要选择正确的回归模型的关键因素:
- 数据探索是构建预测模型的必然组成部分。在选择合适的模型时,比如识别变量的关系和影响时,它应该首选的一步。
- 比较适合于不同模型的优点,我们可以分析不同的指标参数,如统计意义的参数,R-square,Adjusted R-square,AIC,BIC以及误差项,另一个是Mallows' Cp准则。这个主要是通过将模型与所有可能的子模型进行对比(或谨慎选择他们),检查在你的模型中可能出现的偏差。
- 交叉验证是评估预测模型最好额方法。在这里,将你的数据集分成两份(一份做训练和一份做验证)。使用观测值和预测值之间的一个简单均方差来衡量你的预测精度。
- 如果你的数据集是多个混合变量,那么你就不应该选择自动模型选择方法,因为你应该不想在同一时间把所有变量放在同一个模型中。
- 它也将取决于你的目的。可能会出现这样的情况,一个不太强大的模型与具有高度统计学意义的模型相比,更易于实现。
- 回归正则化方法(Lasso,Ridge和ElasticNet)在高维和数据集变量之间多重共线性情况下运行良好。
/*******************************************************************************************/
Introduction
Linear and Logistic regressions are usually the first algorithms people learn in predictive modeling. Due to their popularity, a lot of analysts even end up thinking that they are the only form of regressions. The ones who are slightly more involved think that they are the most important amongst all forms of regression analysis.
The truth is that there are innumerable forms of regressions, which can be performed. Each form has its own importance and a specific condition where they are best suited to apply. In this article, I have explained the most commonly used 7 forms of regressions in a simple manner. Through this article, I also hope that people develop an idea of the breadth of regressions, instead of just applying linear / logistic regression to every problem they come
across and hoping that they would just fit!
Table of Contents
- What is Regression Analysis?
- Why do we use Regression Analysis?
- What are the types of Regressions?
- Linear Regression
- Logistic Regression
- Polynomial Regression
- Stepwise Regression
- Ridge Regression
- Lasso Regression
- ElasticNet Regression
- How to select the right Regression Model?
What is Regression Analysis?
Regression analysis is a form of predictive modelling technique which investigates the relationship between adependent (target) and independent variable (s) (predictor). This technique is used for forecasting, time series modelling and finding the causal effect relationship between the variables. For example, relationship between rash driving and number of road accidents by a driver is best studied through regression.
Regression analysis is an important tool for modelling and analyzing data. Here, we fit a curve / line to the data points, in such a manner that the differences between the distances of data points from the curve or line is minimized. I’ll explain this in more details in coming sections.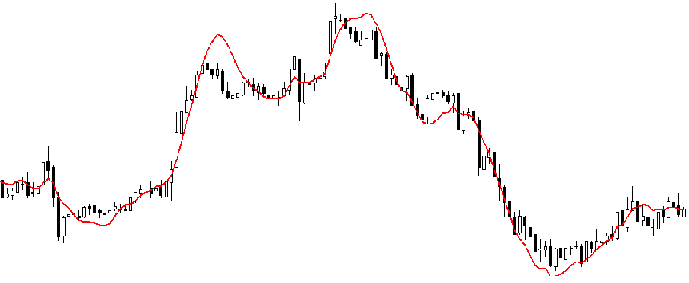
Why do we use Regression Analysis?
As mentioned above, regression analysis estimates the relationship between two or more variables. Let’s understand this with an easy example:
Let’s say, you want to estimate growth in sales of a company based on current economic conditions. You have the recent company data which indicates that the growth in sales is around two and a half times the growth in the economy. Using this insight, we can predict future sales of the company based on current & past information.
There are multiple benefits of using regression analysis. They are as follows:
- It indicates the significant relationships between dependent variable and independent variable.
- It indicates the strength of impact of multiple independent variables on a dependent variable.
Regression analysis also allows us to compare the effects of variables measured on different scales, such as the effect of price changes and the number of promotional activities. These benefits help market researchers / data analysts / data scientists to eliminate and evaluate the best set of variables to be used for building predictive models.
How many types of regression techniques do we have?
There are various kinds of regression techniques available to make predictions. These techniques are mostly driven by three metrics (number of independent variables, type of dependent variables and shape of regression line). We’ll discuss them in detail in the following sections.
For the creative ones, you can even cook up new regressions, if you feel the need to use a combination of the parameters above, which people haven’t used before. But before you start that, let us understand the most commonly used regressions:
1. Linear Regression
It is one of the most widely known modeling technique. Linear regression is usually among the first few topics which people pick while learning predictive modeling. In this technique, the dependent variable is continuous, independent variable(s) can be continuous or discrete, and nature of regression line is linear.
Linear Regression establishes a relationship between dependent variable (Y) and one or moreindependent variables (X) using a best fit straight line (also known as regression line).
It is represented by an equation Y=a+b*X + e, where a is intercept, b is slope of the line and e is error term. This equation can be used to predict the value of target variable based on given predictor variable(s).
The difference between simple linear regression and multiple linear regression is that, multiple linear regression has (>1) independent variables, whereas simple linear regression has only 1 independent variable. Now, the question is “How do we obtain best fit line?”.
How to obtain best fit line (Value of a and b)?
This task can be easily accomplished by Least Square Method. It is the most common method used for fitting a regression line. It calculates the best-fit line for the observed data by minimizing the sum of the squares of the vertical deviations from each data point to the line. Because the deviations are first squared, when added, there is no cancelling out between positive and negative values.
We can evaluate the model performance using the metric R-square. To know more details about these metrics, you can read: Model Performance metrics Part 1, Part 2 .
Important Points:
- There must be linear relationship between independent and dependent variables
- Multiple regression suffers from multicollinearity, autocorrelation, heteroskedasticity.
- Linear Regression is very sensitive to Outliers. It can terribly affect the regression line and eventually the forecasted values.
- Multicollinearity can increase the variance of the coefficient estimates and make the estimates very sensitive to minor changes in the model. The result is that the coefficient estimates are unstable
- In case of multiple independent variables, we can go with forward selection, backward elimination and step wise approach for selection of most significant independent variables.
2. Logistic Regression
Logistic regression is used to find the probability of event=Success and event=Failure. We should use logistic regression when the dependent variable is binary (0/ 1, True/ False, Yes/ No) in nature. Here the value of Y ranges from 0 to 1 and it can represented by following equation.
odds= p/ (1-p) = probability of event occurrence / probability of not event occurrence
ln(odds) = ln(p/(1-p))
logit(p) = ln(p/(1-p)) = b0+b1X1+b2X2+b3X3....+bkXk
Above, p is the probability of presence of the characteristic of interest. A question that you should ask here is “why have we used log in the equation?”.
Since we are working here with a binomial distribution (dependent variable), we need to choose a link function which is best suited for this distribution. And, it is logit function. In the equation above, the parameters are chosen to maximize the likelihood of observing the sample values rather than minimizing the sum of squared errors (like in ordinary regression).
Important Points:
- It is widely used for classification problems
- Logistic regression doesn’t require linear relationship between dependent and independent variables. It can handle various types of relationships because it applies a non-linear log transformation to the predicted odds ratio
- To avoid over fitting and under fitting, we should include all significant variables. A good approach to ensure this practice is to use a step wise method to estimate the logistic regression
- It requires large sample sizes because maximum likelihood estimates are less powerful at low sample sizes than ordinary least square
- The independent variables should not be correlated with each other i.e. no multi collinearity. However, we have the options to include interaction effects of categorical variables in the analysis and in the model.
- If the values of dependent variable is ordinal, then it is called as Ordinal logistic regression
- If dependent variable is multi class then it is known as Multinomial Logistic regression.
3. Polynomial Regression
A regression equation is a polynomial regression equation if the power of independent variable is more than 1. The equation below represents a polynomial equation:
y=a+b*x^2
In this regression technique, the best fit line is not a straight line. It is rather a curve that fits into the data points.
Important Points:
- While there might be a temptation to fit a higher degree polynomial to get lower error, this can result in over-fitting. Always plot the relationships to see the fit and focus on making sure that the curve fits the nature of the problem. Here is an example of how plotting can help:
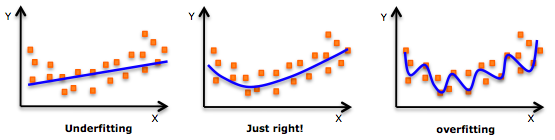
- Especially look out for curve towards the ends and see whether those shapes and trends make sense. Higher polynomials can end up producing wierd results on extrapolation.
4. Stepwise Regression
This form of regression is used when we deal with multiple independent variables. In this technique, the selection of independent variables is done with the help of an automatic process, which involves no human intervention.
This feat is achieved by observing statistical values like R-square, t-stats and AIC metric to discern significant variables. Stepwise regression basically fits the regression model by adding/dropping co-variates one at a time based on a specified criterion. Some of the most commonly used Stepwise regression methods are listed below:
- Standard stepwise regression does two things. It adds and removes predictors as needed for each step.
- Forward selection starts with most significant predictor in the model and adds variable for each step.
- Backward elimination starts with all predictors in the model and removes the least significant variable for each step.
The aim of this modeling technique is to maximize the prediction power with minimum number of predictor variables. It is one of the method to handle higher dimensionality of data set.
5. Ridge Regression
Ridge Regression is a technique used when the data suffers from multicollinearity ( independent variables are highly correlated). In multicollinearity, even though the least squares estimates (OLS) are unbiased, their variances are large which deviates the observed value far from the true value. By adding a degree of bias to the regression estimates, ridge regression reduces the standard errors.
Above, we saw the equation for linear regression. Remember? It can be represented as:
y=a+ b*x
This equation also has an error term. The complete equation becomes:
y=a+b*x+e (error term), [error term is the value needed to correct for a prediction error between the observed and predicted value]
=> y=a+y= a+ b1x1+ b2x2+....+e, for multiple independent variables.
In a linear equation, prediction errors can be decomposed into two sub components. First is due to the biased and second is due to the variance. Prediction error can occur due to any one of these two or both components. Here, we’ll discuss about the error caused due to variance.
Ridge regression solves the multicollinearity problem through shrinkage parameter λ (lambda). Look at the equation below.
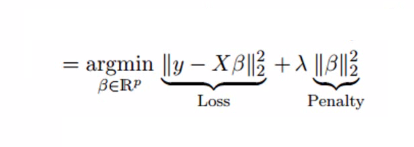
In this equation, we have two components. First one is least square term and other one is lambda of the summation of β2 (beta- square) where β is the coefficient. This is added to least square term in order to shrink the parameter to have a very low variance.
Important Points:
- The assumptions of this regression is same as least squared regression except normality is not to be assumed
- It shrinks the value of coefficients but doesn’t reaches zero, which suggests no feature selection feature
- This is a regularization method and uses l2 regularization.
6. Lasso Regression
Similar to Ridge Regression, Lasso (Least Absolute Shrinkage and Selection Operator) also penalizes the absolute size of the regression coefficients. In addition, it is capable of reducing the variability and improving the accuracy of linear regression models. Look at the equation below: 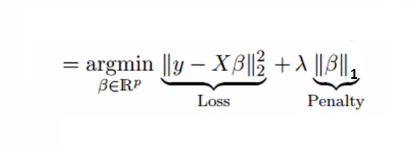 Lasso regression differs from ridge regression in a way that it uses absolute values in the penalty function, instead of squares. This leads to penalizing (or equivalently constraining the sum of the absolute values of the estimates) values which causes some of the parameter estimates to turn out exactly zero. Larger the penalty applied, further the estimates get shrunk towards absolute zero. This results to variable selection out of given n variables.
Important Points:
- The assumptions of this regression is same as least squared regression except normality is not to be assumed
- It shrinks coefficients to zero (exactly zero), which certainly helps in feature selection
- This is a regularization method and uses l1 regularization
- If group of predictors are highly correlated, lasso picks only one of them and shrinks the others to zero
7. ElasticNet Regression
ElasticNet is hybrid of Lasso and Ridge Regression techniques. It is trained with L1 and L2 prior as regularizer. Elastic-net is useful when there are multiple features which are correlated. Lasso is likely to pick one of these at random, while elastic-net is likely to pick both.
![]()
A practical advantage of trading-off between Lasso and Ridge is that, it allows Elastic-Net to inherit some of Ridge’s stability under rotation.
Important Points:
- It encourages group effect in case of highly correlated variables
- There are no limitations on the number of selected variables
- It can suffer with double shrinkage
Beyond these 7 most commonly used regression techniques, you can also look at other models like Bayesian,Ecological and Robust regression.
How to select the right regression model?
Life is usually simple, when you know only one or two techniques. One of the training institutes I know of tells their students – if the outcome is continuous – apply linear regression. If it is binary – use logistic regression! However, higher the number of options available at our disposal, more difficult it becomes to choose the right one. A similar case happens with regression models.
Within multiple types of regression models, it is important to choose the best suited technique based on type of independent and dependent variables, dimensionality in the data and other essential characteristics of the data. Below are the key factors that you should practice to select the right regression model:
- Data exploration is an inevitable part of building predictive model. It should be you first step before selecting the right model like identify the relationship and impact of variables
- To compare the goodness of fit for different models, we can analyse different metrics like statistical significance of parameters, R-square, Adjusted r-square, AIC, BIC and error term. Another one is theMallow’s Cp criterion. This essentially checks for possible bias in your model, by comparing the model with all possible submodels (or a careful selection of them).
- Cross-validation is the best way to evaluate models used for prediction. Here you divide your data set into two group (train and validate). A simple mean squared difference between the observed and predicted values give you a measure for the prediction accuracy.
- If your data set has multiple confounding variables, you should not choose automatic model selection method because you do not want to put these in a model at the same time.
- It’ll also depend on your objective. It can occur that a less powerful model is easy to implement as compared to a highly statistically significant model.
- Regression regularization methods(Lasso, Ridge and ElasticNet) works well in case of high dimensionality and multicollinearity among the variables in the data set.
End Note
By now, I hope you would have got an overview of regression. These regression techniques should be applied considering the conditions of data. One of the best trick to find out which technique to use, is by checking the family of variables i.e. discrete or continuous.
In this article, I discussed about 7 types of regression and some key facts associated with each technique. As somebody who’s new in this industry, I’d advise you to learn these techniques and later implement them in your models.
From: http://www.analyticsvidhya.com/blog/2015/08/comprehensive-guide-regression/

 浙公网安备 33010602011771号