ELK安装
官方elk介绍地址 https://demo.elastic.co
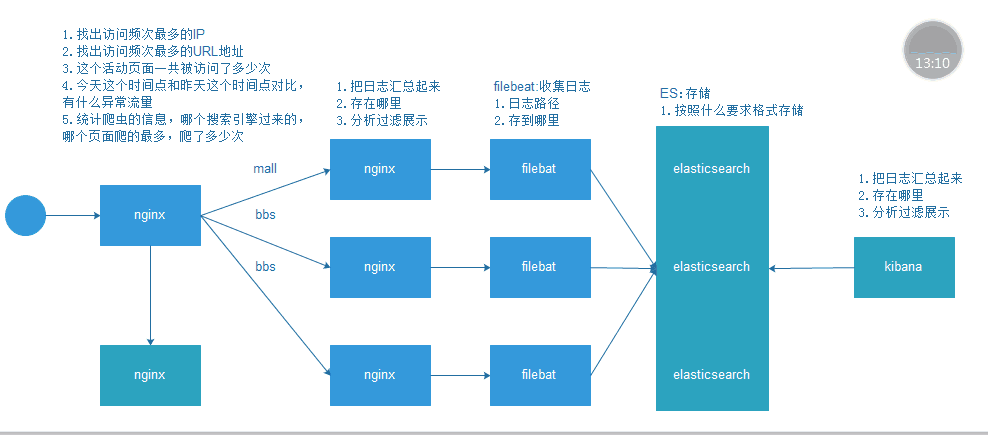
具体图解:
提前准备
 yum install java-1.8.0-openjdk.x86_64 -y
 yum install nodejs npm openssl screen -y
elasticserarch的用法
 es-head相关说明:
 Node.js     #es-head是用node.js开发的
 npm       #node.js的包管理工具
 npm install   #es-head项目里面的依赖下载下来
 npm run start & #放在后台启动
安装elasticsearch
 [root@oldboy ~]# rpm -ivh elasticsearch-6.6.0.rpm
 [root@oldboy ~]# vim /usr/lib/systemd/system/elasticsearch.service
 7 [Service]    在server段下写入第8行数据
 8 LimitMEMLOCK=infinity
 [root@oldboy ~]# grep -v "^#" /etc/elasticsearch/elasticsearch.yml
 node.name: node-1
 path.data: /var/lib/elasticsearch
 path.logs: /var/log/elasticsearch
 bootstrap.mem ory_lock: true
 network.host: 10.0.0.11,127.0.0.1
 http.port: 9200
 [root@oldboy ~]# systemctl daemon-reload
 [root@oldboy ~]# systemctl start elasticsearch.service
 [root@oldboy ~]# systemctl enable elasticsearch.service
 [root@oldboy ~]# netstat -tanpl |grep 9200
 tcp6       0      0 10.0.0.11:9200          :::*                    LISTEN      16901/java
 tcp6       0      0 127.0.0.1:9200          :::*                    LISTEN      16901/java
 [root@oldboy ~]#curl 127.0.0.1:9200
 {
   "name" : "node-1",
   "cluster_name" : "elasticsearch",
   "cluster_uuid" : "OX-iOIDlS5-fbondE9rPWw",
   "version" : {
     "number" : "6.6.0",
     "build_flavor" : "default",
     "build_type" : "rpm",
     "build_hash" : "a9861f4",
     "build_date" : "2019-01-24T11:27:09.439740Z",
     "build_snapshot" : false,
     "lucene_version" : "7.6.0",
     "minimum_wire_compatibility_version" : "5.6.0",
     "minimum_index_compatibility_version" : "5.0.0"
   },
   "tagline" : "You Know, for Search"
 }
 tar xf elasticsearch-head.tar.gz
 cd elasticsearch-head/
 npm run start &
修改es配置文件支持跨域
[root@oldboy elasticsearch-head]# vim /etc/elasticsearch/elasticsearch.yml
 最后两行添加如下参数
 http.cors.enabled: true
 http.cors.allow-origin: "*"
重启elasticsearch
[root@oldboy elasticsearch-head]# systemctl restart elasticsearch.service
[root@oldboy elasticsearch-head]# netstat -tanpl |grep 9200
tcp6 0 0 10.0.0.11:9200 :::* LISTEN 17559/java
tcp6 0 0 127.0.0.1:9200 :::* LISTEN 17559/java
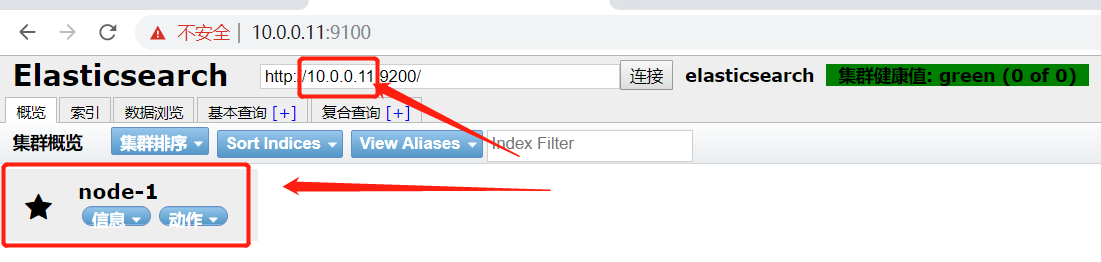
页面访问:
安装kibana
 [root@oldboy ~]# rpm -ivh kibana-6.6.0-x86_64.rpm
 [root@oldboy ~]# grep "^[a-z]" /etc/kibana/kibana.yml
 server.port: 5601
 server.host: "10.0.0.11"
 elasticsearch.hosts: ["http://localhost:9200"]    ###elasticsearch装在哪一台就是用哪一台的ip
 kibana.index: ".kibana"
 [root@oldboy ~]# systemctl start kibana.service
 [root@oldboy ~]# netstat -tanpl |grep 5601
 tcp        0      0 10.0.0.11:5601          0.0.0.0:*               LISTEN      17741/node
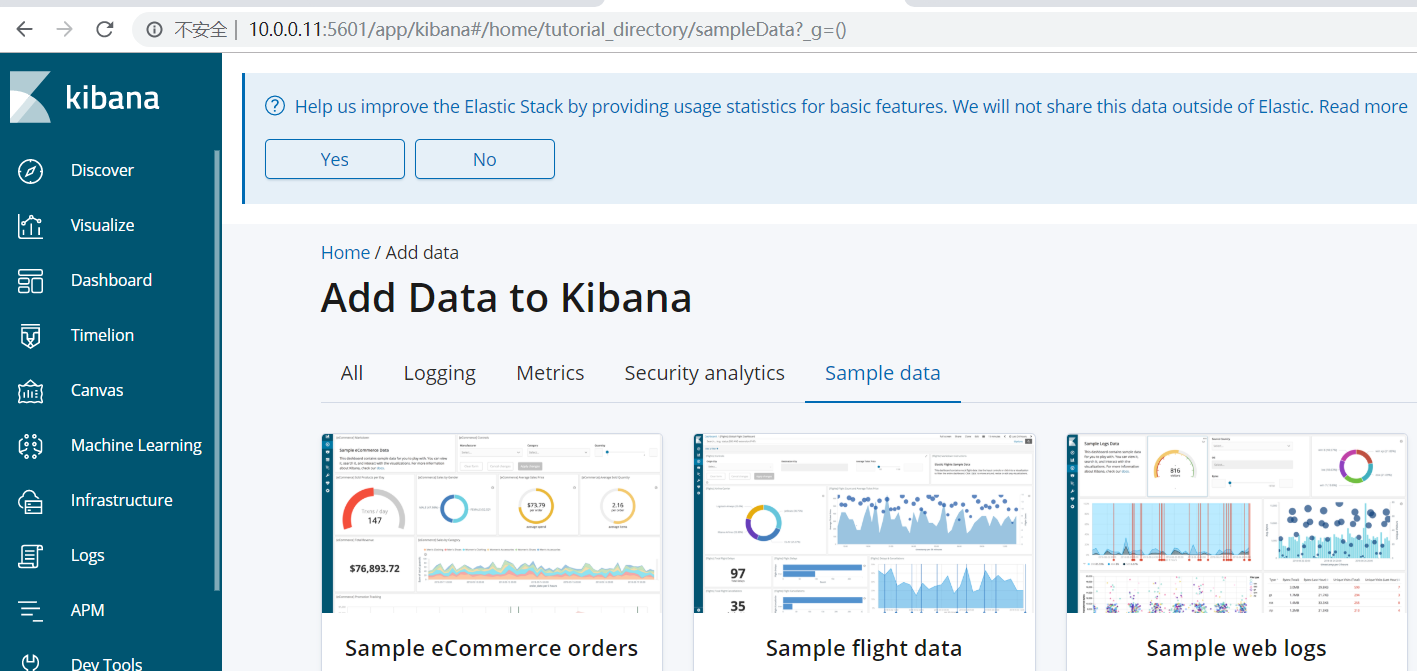
页面访问:
安装filebeat
[root@oldboy ~]# rpm -ivh filebeat-6.6.0-x86_64.rpm
 [root@oldboy elasticsearch-head]# rpm -qc filebeat
 /etc/filebeat/filebeat.yml
 /etc/filebeat/modules.d/apache2.yml.disabled
 /etc/filebeat/modules.d/auditd.yml.disabled
 /etc/filebeat/modules.d/elasticsearch.yml.disabled
 /etc/filebeat/modules.d/haproxy.yml.disabled
 /etc/filebeat/modules.d/icinga.yml.disabled
 /etc/filebeat/modules.d/iis.yml.disabled
 /etc/filebeat/modules.d/kafka.yml.disabled
 /etc/filebeat/modules.d/kibana.yml.disabled
 /etc/filebeat/modules.d/logstash.yml.disabled
 /etc/filebeat/modules.d/mongodb.yml.disabled
 /etc/filebeat/modules.d/mysql.yml.disabled
 /etc/filebeat/modules.d/nginx.yml.disabled
 /etc/filebeat/modules.d/osquery.yml.disabled
 /etc/filebeat/modules.d/postgresql.yml.disabled
 /etc/filebeat/modules.d/redis.yml.disabled
 /etc/filebeat/modules.d/suricata.yml.disabled
 /etc/filebeat/modules.d/system.yml.disabled
 /etc/filebeat/modules.d/traefik.yml.disabled
  修改配置文件
 [root@oldboy elasticsearch-head]# egrep -v "#|^$" /etc/filebeat/filebeat.yml
 filebeat.inputs:
 - type: log
   enabled: true    ####
   paths:
     - /var/log/nginx/access.log    ###
 filebeat.config.modules:
   path: ${path.config}/modules.d/*.yml
   reload.enabled: true
 setup.template.settings:
   index.number_of_shards: 3
 setup.kibana:
 output.elasticsearch:
   hosts: ["10.0.0.11:9200"]      ####
 processors:
   - add_host_metadata: ~
   - add_cloud_metadata: ~
 [root@oldboy elasticsearch-head]# systemctl start filebeat.service
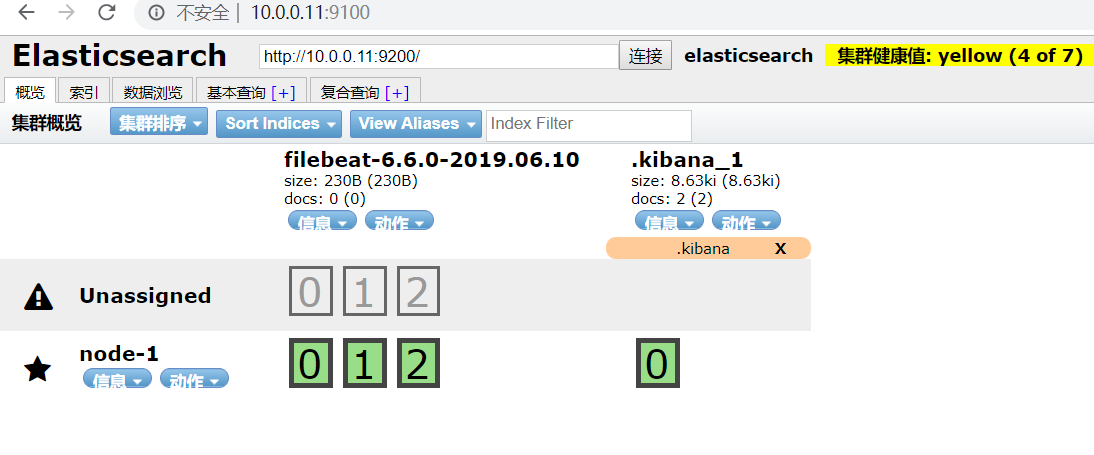
页面测试:
添加
[root@oldboy ~]# yum -y install httpd-tools nginx
[root@oldboy ~]# ab -c 10 -n 100 10.0.0.11/ ###这个页面存在
This is ApacheBench, Version 2.3 <$Revision: 1430300 $>
Copyright 1996 Adam Twiss, Zeus Technology Ltd, http://www.zeustech.net/
Licensed to The Apache Software Foundation, http://www.apache.org/
Benchmarking 10.0.0.11 (be patient).....done
Server Software: nginx/1.12.2
Server Hostname: 10.0.0.11
Server Port: 80
Document Path: /
Document Length: 3700 bytes
Concurrency Level: 10
Time taken for tests: 0.011 seconds
Complete requests: 100
Failed requests: 0
Write errors: 0
Total transferred: 393400 bytes
HTML transferred: 370000 bytes
Requests per second: 9355.41 [#/sec] (mean)
Time per request: 1.069 [ms] (mean)
Time per request: 0.107 [ms] (mean, across all concurrent requests)
Transfer rate: 35941.59 [Kbytes/sec] received
Connection Times (ms)
min mean[+/-sd] median max
Connect: 0 0 0.1 0 0
Processing: 0 1 0.4 1 2
Waiting: 0 1 0.4 1 2
Total: 1 1 0.4 1 2
Percentage of the requests served within a certain time (ms)
50% 1
66% 1
75% 1
80% 1
90% 2
95% 2
98% 2
99% 2
100% 2 (longest request)
[root@oldboy ~]# ab -c 10 -n 100 10.0.0.11/test.html 这个页面不存在
This is ApacheBench, Version 2.3 <$Revision: 1430300 $>
Copyright 1996 Adam Twiss, Zeus Technology Ltd, http://www.zeustech.net/
Licensed to The Apache Software Foundation, http://www.apache.org/
Benchmarking 10.0.0.11 (be patient).....done
Server Software: nginx/1.12.2
Server Hostname: 10.0.0.11
Server Port: 80
Document Path: /test.html
Document Length: 3650 bytes
Concurrency Level: 10
Time taken for tests: 0.010 seconds
Complete requests: 100
Failed requests: 0
Write errors: 0
Non-2xx responses: 100
Total transferred: 382300 bytes
HTML transferred: 365000 bytes
Requests per second: 10031.10 [#/sec] (mean)
Time per request: 0.997 [ms] (mean)
Time per request: 0.100 [ms] (mean, across all concurrent requests)
Transfer rate: 37450.08 [Kbytes/sec] received
Connection Times (ms)
min mean[+/-sd] median max
Connect: 0 0 0.1 0 0
Processing: 0 1 0.3 1 1
Waiting: 0 1 0.2 1 1
Total: 1 1 0.3 1 1
Percentage of the requests served within a certain time (ms)
50% 1
66% 1
75% 1
80% 1
90% 1
95% 1
98% 1
99% 1
100% 1 (longest request)
查看访问日志
Try 'tail --help' for more information.
[root@oldboy ~]# tail -f /var/log/nginx/access.log
10.0.0.11 - - [10/Jun/2019:11:47:40 +0800] "GET /test.html HTTP/1.0" 404 3650 "-" "ApacheBench/2.3" "-"
10.0.0.11 - - [10/Jun/2019:11:47:40 +0800] "GET /test.html HTTP/1.0" 404 3650 "-" "ApacheBench/2.3" "-"
10.0.0.11 - - [10/Jun/2019:11:47:40 +0800] "GET /test.html HTTP/1.0" 404 3650 "-" "ApacheBench/2.3" "-"
10.0.0.11 - - [10/Jun/2019:11:47:40 +0800] "GET /test.html HTTP/1.0" 404 3650 "-" "ApacheBench/2.3" "-"
10.0.0.11 - - [10/Jun/2019:11:47:40 +0800] "GET /test.html HTTP/1.0" 404 3650 "-" "ApacheBench/2.3" "-"
10.0.0.11 - - [10/Jun/2019:11:47:40 +0800] "GET /test.html HTTP/1.0" 404 3650 "-" "ApacheBench/2.3" "-"
10.0.0.11 - - [10/Jun/2019:11:47:40 +0800] "GET /test.html HTTP/1.0" 404 3650 "-" "ApacheBench/2.3" "-"
10.0.0.11 - - [10/Jun/2019:11:47:40 +0800] "GET /test.html HTTP/1.0" 404 3650 "-" "ApacheBench/2.3" "-"
10.0.0.11 - - [10/Jun/2019:11:47:40 +0800] "GET /test.html HTTP/1.0" 404 3650 "-" "ApacheBench/2.3" "-"
10.0.0.11 - - [10/Jun/2019:11:47:40 +0800] "GET /test.html HTTP/1.0" 404 3650 "-" "ApacheBench/2.3" "-"
 [root@oldboy filebeat]# vi /etc/filebeat/filebeat.yml
 filebeat.inputs:
 - type: log
   enabled: true
   paths:
     - /var/log/nginx/access.log
 output.elasticsearch:
   hosts: ["10.0.0.11:9200"]
   index: "nginx-%{[beat.version]}-%{+yyyy.MM.dd}"
 setup.template.name: "nginx"
 setup.template.pattern: "nginx-*"
 setup.template.enabled: false
 setup.template.overwrite: true
 [root@oldboy filebeat]# systemctl restart filebeat.service
刷新nginx访问页面,之后看下面页面,会出现nginx-6*开头的监控项
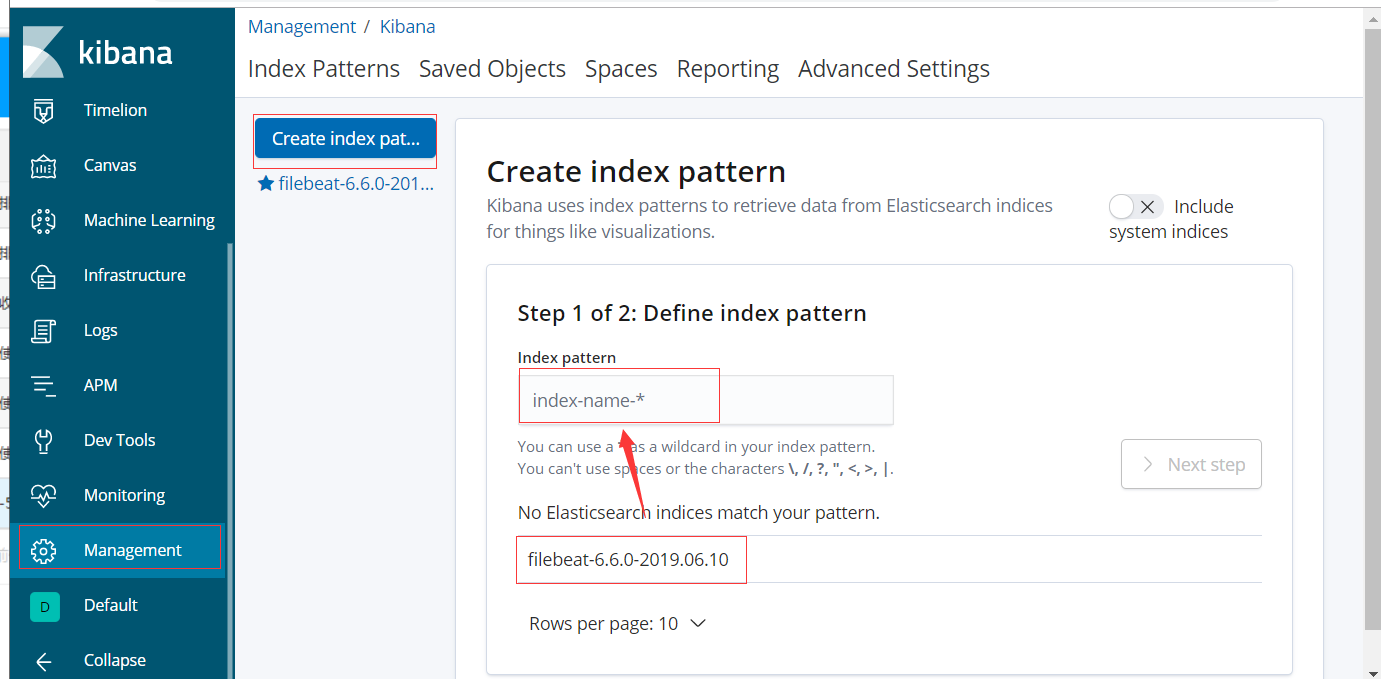
根据index索引添加监控项

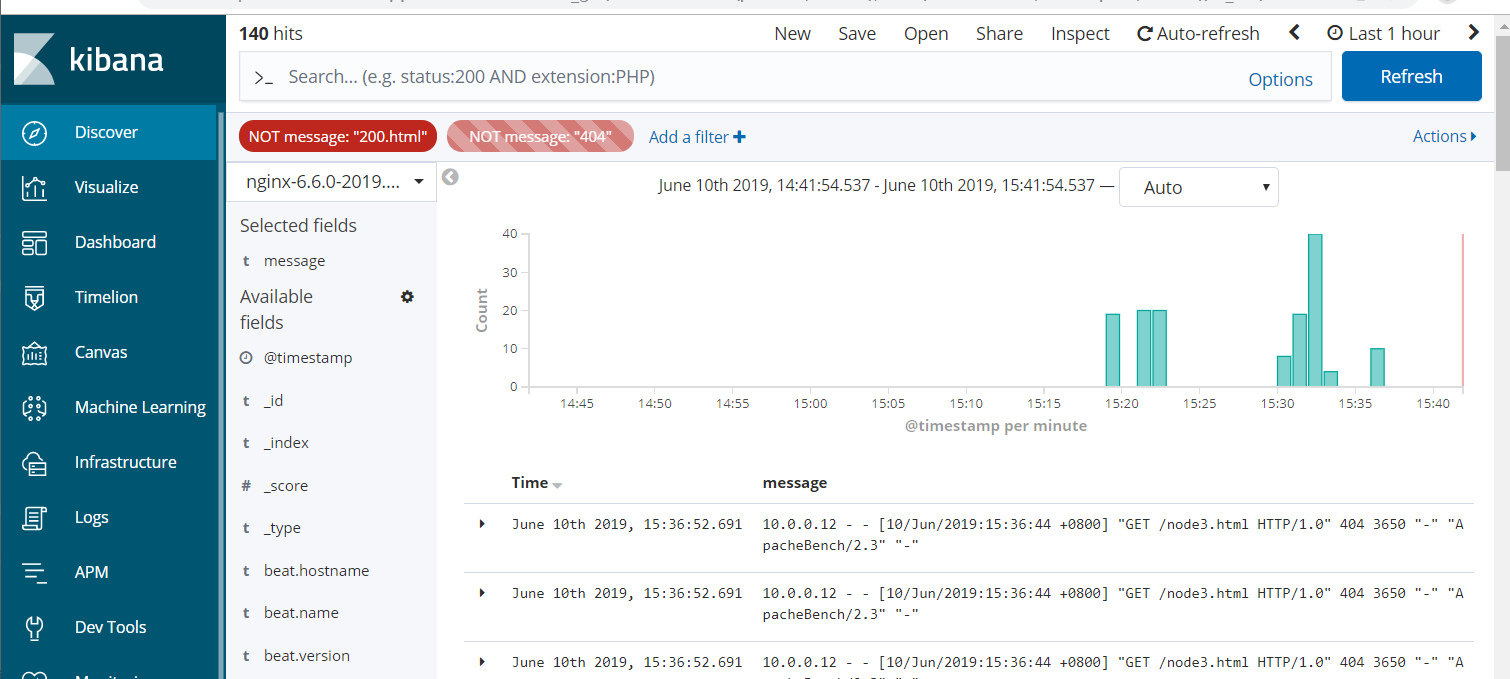
添加之后的监控图像

这里以message为主添加监控筛选条件
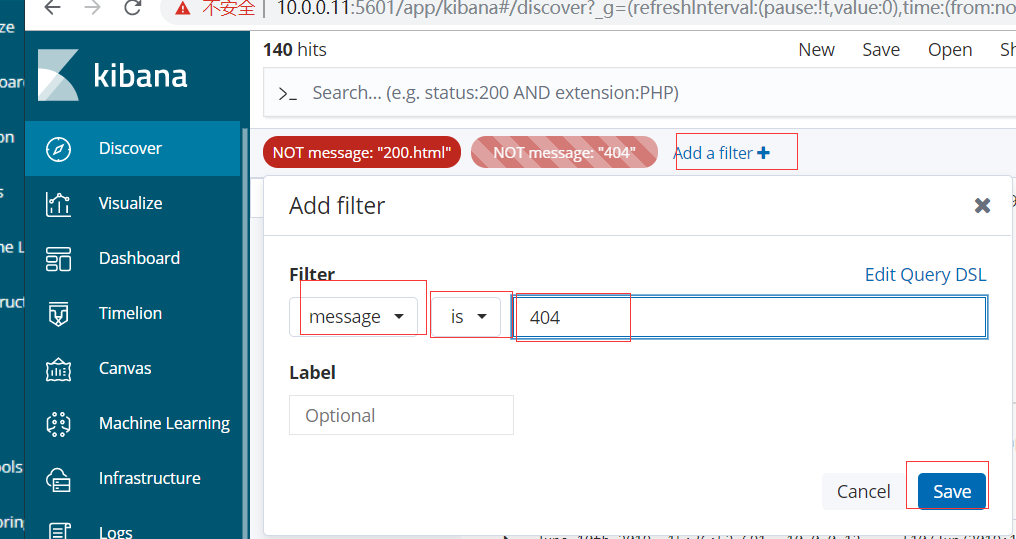
如图
nginx日志转换成json格式
nginx转换成json操作步骤:
0.停止filebeat
systemctl stop filebeat
1.修改nginx日志格式为json
vim /etc/nginx/nginx.conf
log_format json '{ "time_local": "$time_local", '
'"remote_addr": "$remote_addr", '
'"referer": "$http_referer", '
'"request": "$request", '
'"status": $status, '
'"bytes": $body_bytes_sent, '
'"agent": "$http_user_agent", '
'"x_forwarded": "$http_x_forwarded_for", '
'"up_addr": "$upstream_addr",'
'"up_host": "$upstream_http_host",'
'"upstream_time": "$upstream_response_time",'
'"request_time": "$request_time"' '}';
access_log /var/log/nginx/access.log json;
2.清空原有nginx日志
>/var/log/nginx/access.log
3.检查nginx配置是否正确
nginx -t
4.重启nginx并访问
systemctl restart nginx
curl localhost/
5.检查日志是否为json
tail -a /var/log/nginx/access.log
6.修改filebeat配置文件,增加json配置
vim /etc/filebeat/filebeat.yml
filebeat.inputs:
- type: log
enabled: true
paths:
- /var/log/nginx/access.log
json.keys_under_root: true
json.overwrite_keys: true
output.elasticsearch:
hosts: ["10.0.0.101:9200"]
index: "nginx-json-%{[beat.version]}-%{+yyyy.MM.dd}"
setup.template.name: "nginx"
setup.template.pattern: "nginx-*"
setup.template.enabled: false
setup.template.overwrite: true
7.重启filebeat
systemctl restart filebeat
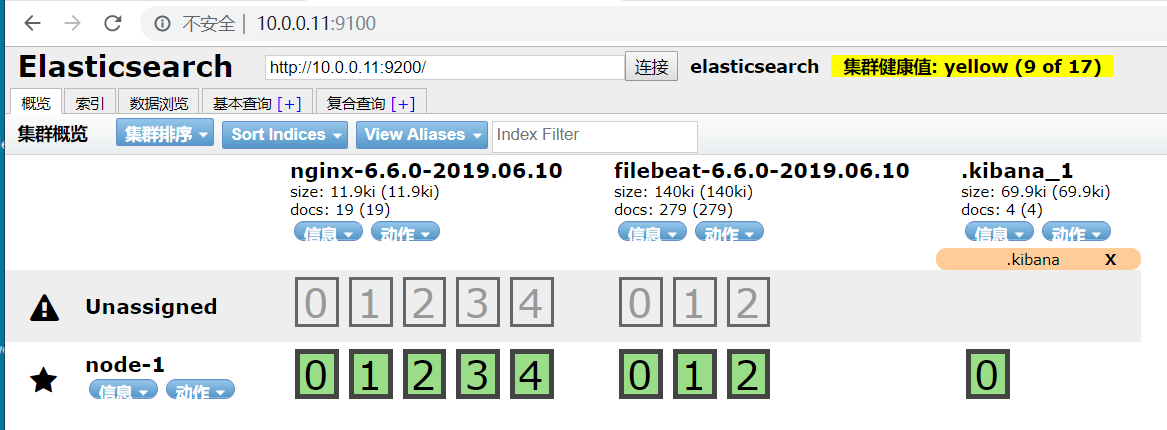
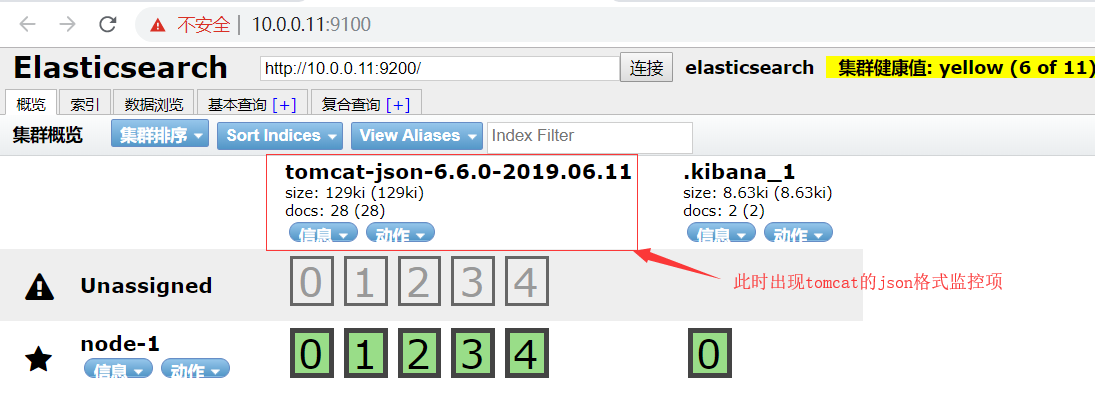
8.es-head查看是否生成新的索引
9.kiabina添加新生成的json的索引
10.过滤展示
监控tomcat日志
我的步骤:
yum install tomcat tomcat-webapps tomcat-admin-webapps tomcat-docs-webapp tomcat-javadoc -y
[root@oldboy opt]# vim /etc/tomcat/server.xml
删掉原来139行的数据,插入新的带有json格式的数据
138 prefix="localhost_access_log." suffix=".txt"
139 pattern="{"clientip":"%h","ClientUser":&quo t;%l","authenticated":"%u","AccessTime":"%t" ;,"method":"%r","status":"%s","SendBytes&qu ot;:"%b","Query?string":"%q","partner":"%{R eferer}i","AgentVersion":"%{User-Agent}i"}"/>
[root@oldboy filebeat]# systemctl start tomcat
[root@oldboy filebeat]# vim /etc/filebeat/filebeat.yml
filebeat.inputs:
- type: log
enabled: true
paths:
- /var/log/tomcat/localhost_access_log.*
json.keys_under_root: true
json.overwrite_keys: true
output.elasticsearch:
hosts: ["10.0.0.11:9200"]
index: "tomcat-json-%{[beat.version]}-%{+yyyy.MM.dd}"
setup.template.name: "tomcat"
setup.template.pattern: "tomcat-*"
setup.template.enabled: false
setup.template.overwrite: true
[root@oldboy tomcat]# systemctl start filebeat.service
老师的步骤
TOCMCAT日志收集步骤
1.正常安装配置tomcat
yum install tomcat tomcat-webapps tomcat-admin-webapps tomcat-docs-webapp tomcat-javadoc -y
2.启动访问tomcat测试
systemctl start tomcat
3.tomcat日志修改为json格式
#停止tomcat
systemctl stop tomcat
#清空原有tomcat日志
>/var/log/tomcat/localhost_access_log.2019-06-10.txt
#编辑tomcat配置文件139行,替换为json格式
vim /etc/tomcat/server.xml
pattern="{"clientip":"%h","ClientUser":"%l","authenticated":"%u","AccessTime":"%t","method":"%r","status":"%s","SendBytes":"%b","Query?string":"%q","partner":"%{Referer}i","AgentVersion":"%{User-Agent}i"}"/>
#重启tomcat
systemctl restart tomcat
#编辑filebeat配置文件
filebeat.inputs:
- type: log
enabled: true
paths:
- /var/log/tomcat/localhost_access_log.*
json.keys_under_root: true
json.overwrite_keys: true
output.elasticsearch:
hosts: ["10.0.0.101:9200"]
index: "tomcat-json-%{[beat.version]}-%{+yyyy.MM.dd}"
setup.template.name: "tomcat"
setup.template.pattern: "tomcat-*"
setup.template.enabled: false
setup.template.overwrite: true
#重启filebeat
systemctl restart filebeat
多访问几次tomcat界面,让其产生访问日志
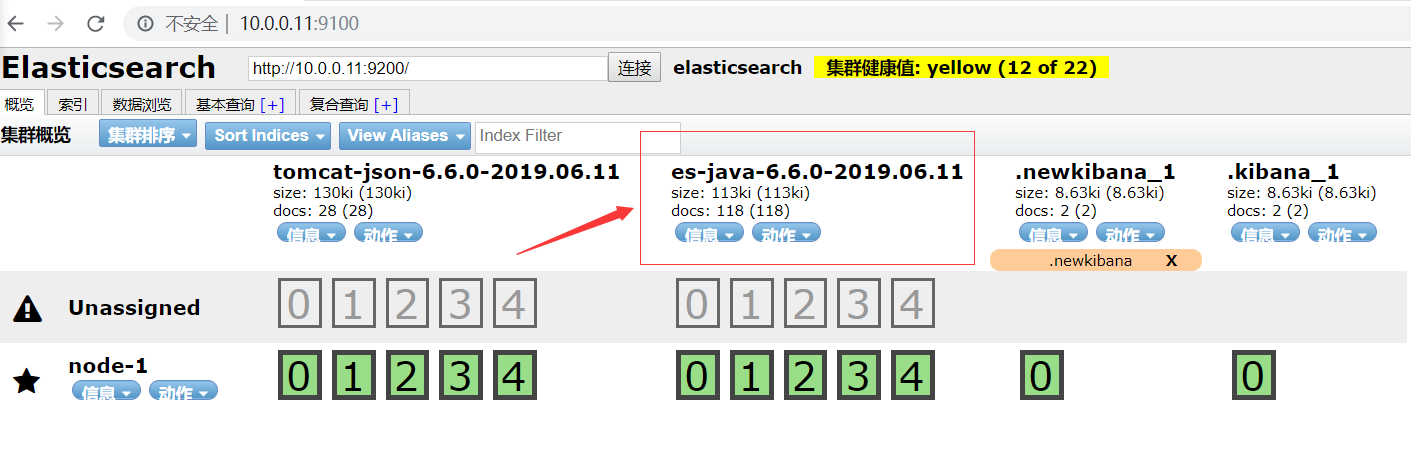
然后访问elasticsearch
[root@oldboy /]# vim /etc/filebeat/filebeat.yml
filebeat.inputs:
- type: log
enabled: true
paths:
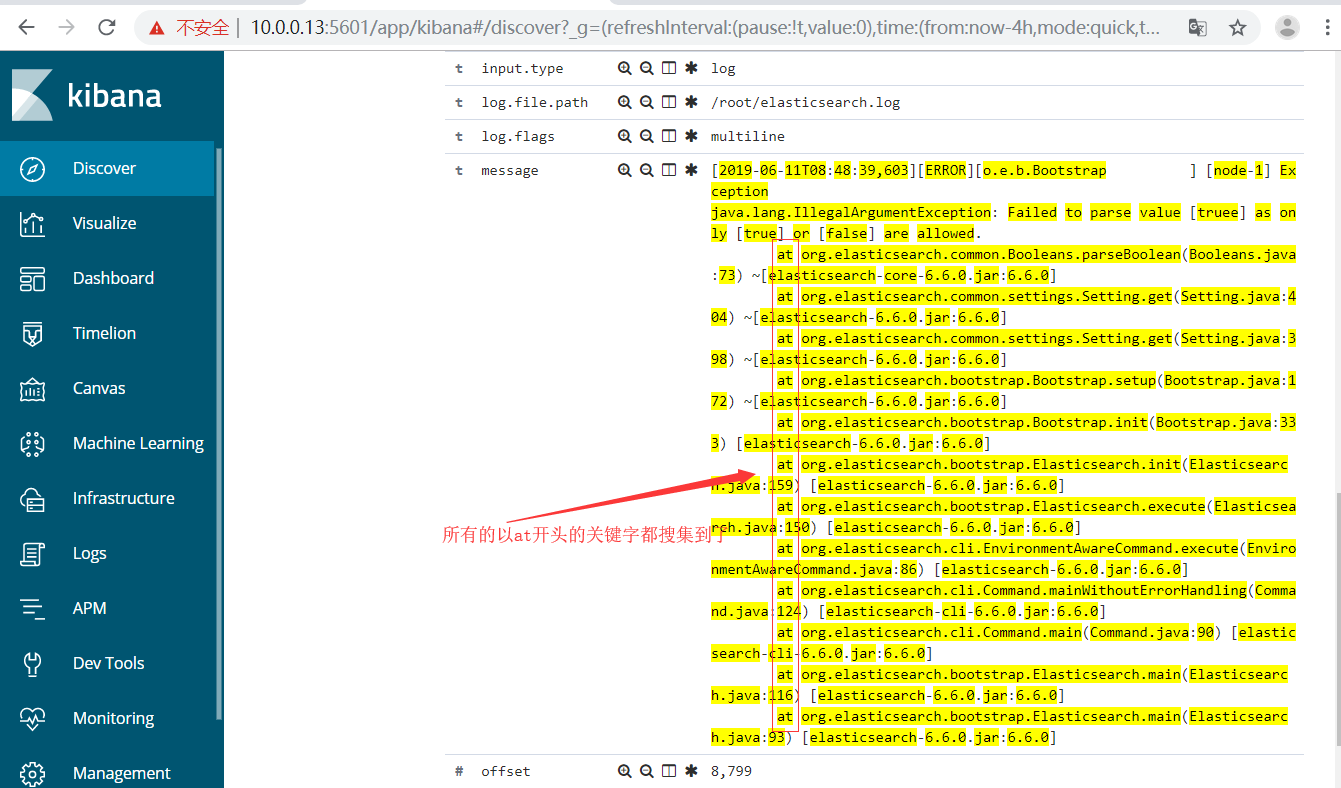
- /root/elasticsearch.log ####这里的文件是老师发的
multiline.pattern: '^\['
multiline.negate: true
multiline.match: after
output.elasticsearch:
hosts: ["10.0.0.101:9200"]
index: "es-java-%{[beat.version]}-%{+yyyy.MM.dd}"
setup.template.name: "es"
setup.template.pattern: "es-*"
setup.template.enabled: false
setup.template.overwrite: true
[root@oldboy ~]# systemctl restart filebeat.service
操作步骤:
1.nginx修改为普通日志格式
2.清空nginx日志
3.修改filebeat配置文件,添加模块相关参数
4.使用filebeat命令打开模块开关
5.重启filebeat
6.访问nginx产生数据
注意:解决elasticsearch总是打不开网页的问题
systemctl stop elasticsearch systemctl stop kibana rm -rf /var/lib/elasticsearch/* rm -rf /var/lib/kibana/* systemctl start elasticsearch systemctl start kibana

 浙公网安备 33010602011771号