
vue 使用echarts 柱状图使用图片显示
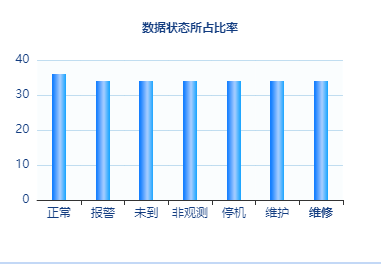
实现效果
<template>
  <div id="myChart" class="percentage"></div>
</template>

<script>
export default {
  name: 'Percentage',
  data () {
    return {
      txIcon: require('../../../assets/image/stanet/histogram-bj.png')
    }
  },
  mounted () {
    this.drawLine()
  },
  methods: {
    drawLine () {
      // 基于准备好的dom,初始化echarts实例
      let myChart = this.$echarts.init(document.getElementById('myChart'))
      // 绘制图表
      myChart.setOption({
        title: {
          text: '数据状态所占比率',
          left: 'center',
          textStyle: {
            lineHeight: 47,
            color: '#123c80',
            fontSize: 12
          }
        },
        tooltip: {},
        xAxis: {
          data: ['正常', '报警', '未到', '非观测', '停机', '维护', '维修'],
          axisLabel: {
            interval: 0, // 横轴信息全部显示
            rotate: 0, // 角倾斜显示
            textStyle: {
              color: '#123c80',
              fontSize: 12
            }
          },
          axisTick: {
            interval: 0
            // alignWithLabel: true
          },
          splitArea: {
            interval: '0',
            show: true,
            areaStyle: {
              color: '#f6fbfe',
              opacity: 0.5
            }
          }
        },
        yAxis: {
          axisLabel: {
            textStyle: {
              color: '#123c80',
              fontSize: 12
            }
          },
          axisTick: {
            show: false
          },
          splitLine: {
            lineStyle: {
              // 使用深浅的间隔色
              color: '#8abfe2'
            }
          },
          axisLine: {
            lineStyle: {
              width: 0
            }
          }
        },
        series: [{
          type: 'pictorialBar',
          data: [
            {
              value: 36,
              symbol: 'image://' + this.txIcon,
              symbolSize: [14, '100%']

            },
            {
              value: 34,
              symbol: 'image://' + this.txIcon,
              symbolSize: [14, '100%']
            },
            {
              value: 34,
              symbol: 'image://' + this.txIcon,
              symbolSize: [14, '100%']
            }, {
              value: 34,
              symbol: 'image://' + this.txIcon,
              symbolSize: [14, '100%']
            },
            {
              value: 34,
              symbol: 'image://' + this.txIcon,
              symbolSize: [14, '100%']
            },
            {
              value: 34,
              symbol: 'image://' + this.txIcon,
              symbolSize: [14, '100%']
            },
            {
              value: 34,
              symbol: 'image://' + this.txIcon,
              symbolSize: [14, '100%']
            }
          ]
        }]
      })
    }
  }
}
</script>

<style scoped>
.percentage {
  width: 100%;
  height: 100%;
  /**/
}
</style>

 浙公网安备 33010602011771号