使用matplotlib绘制收入增长模型——线性积累型与指数复利型
一、启发:
- 关乎增长的事情,即使1%也很重要
- 复利增长具有恐怖的能量和速度
- 时间可以创造天壤之别的多样性
- 一年可以很短,短到从年头看到年尾;一年可以很长,长到完全看不到尽头什么样
二、单图版代码:
# -*- coding:utf-8 -*-
#
import matplotlib
import matplotlib.pyplot as plt
import numpy as np
import matplotlib.gridspec as gridspec
from matplotlib.collections import LineCollection
from matplotlib.font_manager import *
myfont = FontProperties(fname='/Library/Fonts/simhei.ttf')
def showWithParam(ax, total_init, time):
ipd_salary = 0.1#income per day工资每日收入(万元)每月三万
income_salary = loadYSalary(ipd_salary, total_init, time)
ax.plot(time, income_salary,"r-", label="linear incr")
ipd_stock_0 = 0.01#income per day股市每日收入比率
ipd_stock_1 = 0.02#income per day股市每日收入比率
ipd_stock_2 = 0.05#income per day股市每日收入比率
income_stock_0 = loadYStock(total_init, ipd_stock_0, time)
income_stock_1 = loadYStock(total_init, ipd_stock_1, time)
income_stock_2 = loadYStock(total_init, ipd_stock_2, time)
ax.plot(time, income_stock_0, 'y', label="+0.01 rate")
ax.plot(time, income_stock_1, 'b', label="+0.02 rate")
ax.plot(time, income_stock_2, 'g', label="+0.05 rate")
ax.grid(True)
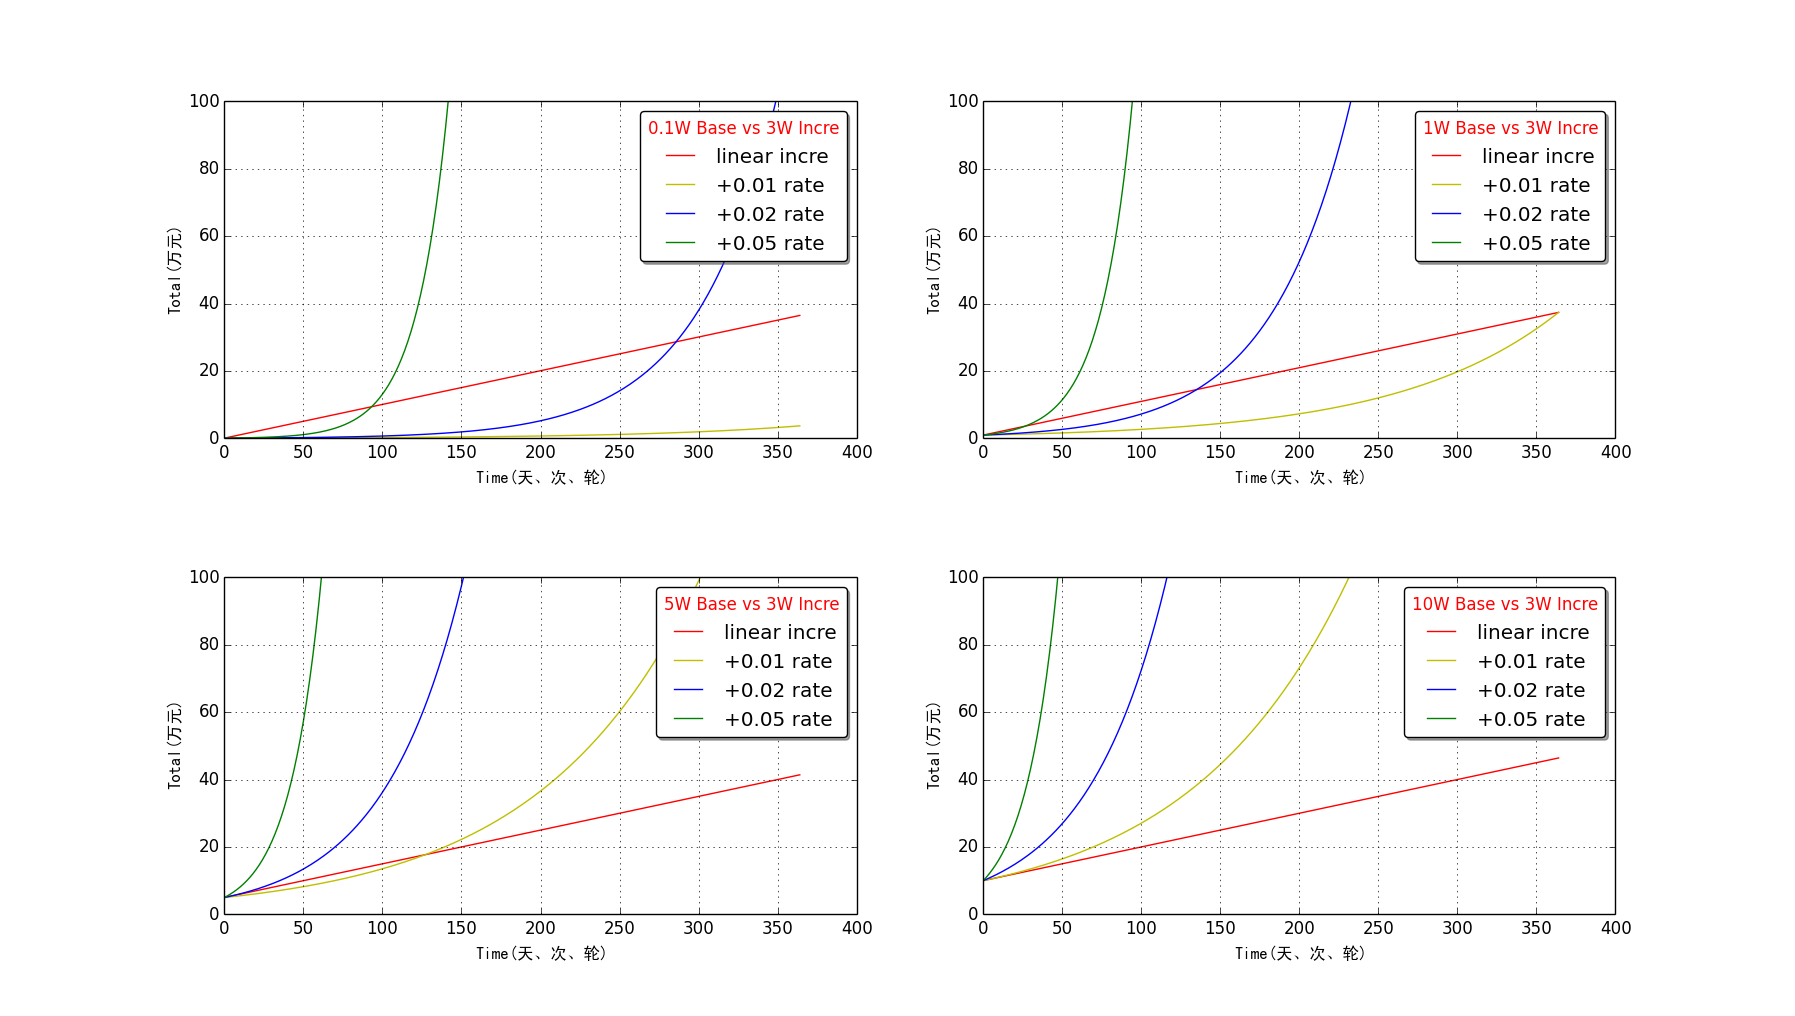
leg = ax.legend(loc="lower right",shadow=True, fancybox=True, title="{0}W Base vs {1}W Incre".format(total_init, 3))
leg.get_title().set_color("red")
def loadYSalary(ipd_salary, total_init, days):
income_salary = total_init
income_salary += days * ipd_salary
return income_salary
def loadYStock(total_init, rate, days):
income_stock = total_init
income_stock = income_stock * pow(1 + rate, time)
return income_stock
fig, ax = plt.subplots()
times = np.arange(0.0, 365)
ax.set_xlabel(u'Times(天、次、轮)', fontproperties=myfont, fontsize=25)
ax.set_ylabel(u'Total(万元)', fontproperties=myfont, fontsize=25)
ax.set_ylim(0, 100)
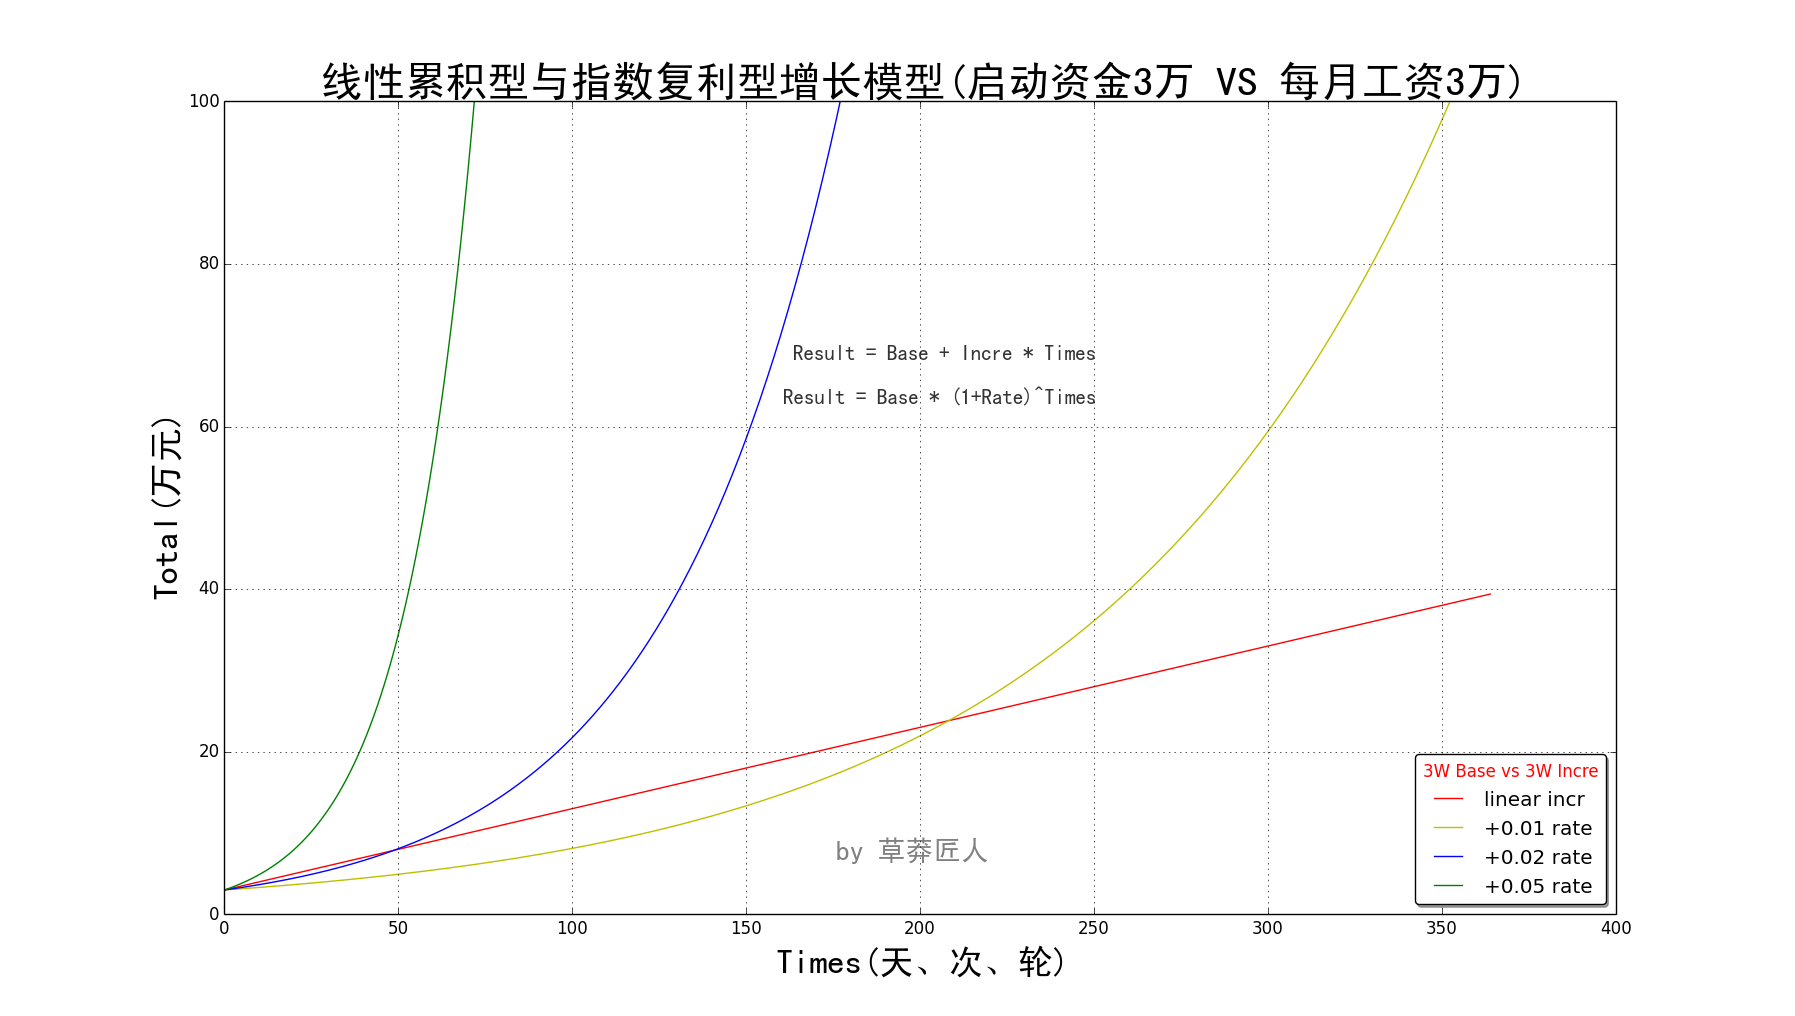
ax.set_title(u'线性累积型与指数复利型增长模型(启动资金3万 VS 每月工资3万)', fontproperties=myfont, fontsize=30, color='black')
showWithParam(ax, 3, times)
fig.text(0.61, 0.60, u'Result = Base + Incre * Times\n\nResult = Base * (1+Rate)^Times', fontproperties=myfont, color='black',
ha='right', va='bottom', alpha=0.8, fontsize=15)
fig.text(0.55, 0.15, u'by 草莽匠人', fontproperties=myfont, color='black',
ha='right', va='bottom', alpha=0.5, fontsize=20)
plt.show()
~~~~~~~~~~~~~~~~~~~~~~~~~~~~~~~~~~~~~~~~~~~

 浙公网安备 33010602011771号