


文章目录
-
* 一、关于基金定投-
* 数据来源- 接口规范
- 常见指数基金/股票代码
- 二、分析目标
- 三、代码实现
-
* 1、定义获取数据、清洗数据的函数- 2、定义定投策略函数
- 3、计算2019年对沪深300指数基金进行定投的收益率
- 4、假设定投的金额是500元,每周定投一次,据此分别计算从2002年开始到2019年,每年定投沪深300指数基金的收益率并将结果可视化
- 5、实现"慧定投"(支付宝中的智能定投策略)
- 定义定投策略(对于每个交易日前一日的收盘价)
- 四、可视化普通定投与智能定投策略收益率
- 五、文末福利(完整代码)
-
基于Python的基金定投分析
通过获取过去10年的股市数据分析基金定投的收益率。
一、关于基金定投
基金定投,就是按照固定的频率和固定的金额,不停分批次小额买入金融市场上的基金。为什么要这么麻烦,这样做有什么好处吗?我们本次“数据分析和挖掘”的第四次作业就
指数基金定投 的效果来分析一下。
注:定投可以选择任何种类的基金。我们以指数基金为例,因为大部分传说中 无脑定投 的案例都是以指数基金的定投方式
数据来源
- 通过API接口从网易财经上进行调取
接口规范
其中
- code参数后面的7位整数代表了股票代码;比如0000001指的是上证指数。注意这串数字要分0和000001两部分看。0代表sh,1代表sz。所以0000001其实是sh000001的意思。同理,0 000300也就是sh000300 沪深300的代码。
- start和end参数后面的8位整数代表年(xxxx)月(xx)日(xx)
- fields选项中,TCLOSE,HIGH,LOW,TOPEN分别表示当日的收盘,最高,最低,开盘价;LCLOSE表示昨日收盘价。CHG,PCHG,VOTURNOVER,VAT分别表示涨跌额,涨跌幅,成交量,成交金额。
常见指数基金/股票代码
- 0000300 - 沪深300
- 0000001 - 上证指数
- 0000016 - 上证50
- 399005 - 中小板指
- 399673 - 创业板50
- 000903 - 中证100
二、分析目标
- 假设定投的金额是500元,每周定投一次,据此计算2019年对 沪深300指数 基金进行定投的收益率
- 假设定投的金额是500元,每周定投一次,据此 分别 计算从2002年开始到2019年,每年定投 沪深300指数基金 的收益率并将结果可视化
- 探索不同的定投策略。这里以支付宝的“慧定投”智能定投策略为例
注:不同的定投策略可以是改变定投周期(比如从每周定投到每月定投),改变定投金额(比如从固定金额到固定比例),设定止损或者止盈策略等等。
三、代码实现
1、定义获取数据、清洗数据的函数
    import pandas as pd
    import numpy as np
    import matplotlib.pyplot as plt
    import requests
    import warnings
    warnings.filterwarnings('ignore')
    plt.rcParams['font.family']='SimHei'
    plt.rcParams['axes.unicode_minus']=False
    plt.rcParams['figure.figsize']=(12,8)


    def get_data(code,start,end):
        '''
        获取指定时间范围的股票数据
        :param code: 指数代码
        :param start: 起始日期
        :param end: 截止日期
        :return: DataFrame
        '''
        url='http://quotes.money.163.com/service/chddata.html?code={}&start={}&end={}&fields=TCLOSE;HIGH;LOW;TOPEN;LCLOSE;CHG;PCHG;VOTURNOVER;VATURNOVER'.format(code,start,end)
        name=code+'_'+start+"-"+end
        f=open(name,'wb')
        f.write(requests.get(url).content)
        f.close()
        data=pd.read_csv(name,encoding='gbk')
        return data

    def clean_data(data):
        '''
        1、将日期转换为时间序列并设置为索引
        2、将数据按时间序列升序排序
        3、删除缺失值
        4、将涨跌幅的单位转换为小数

        '''
        data['日期']=pd.to_datetime(data['日期'])
        data=data.set_index("日期")
        data=data.sort_index()
        data.drop(data[data["涨跌幅"]=="None"].index,axis=0,inplace=True)
        data["涨跌幅"]=data['涨跌幅'].astype('float')
        data['涨跌幅']/=100
        return data
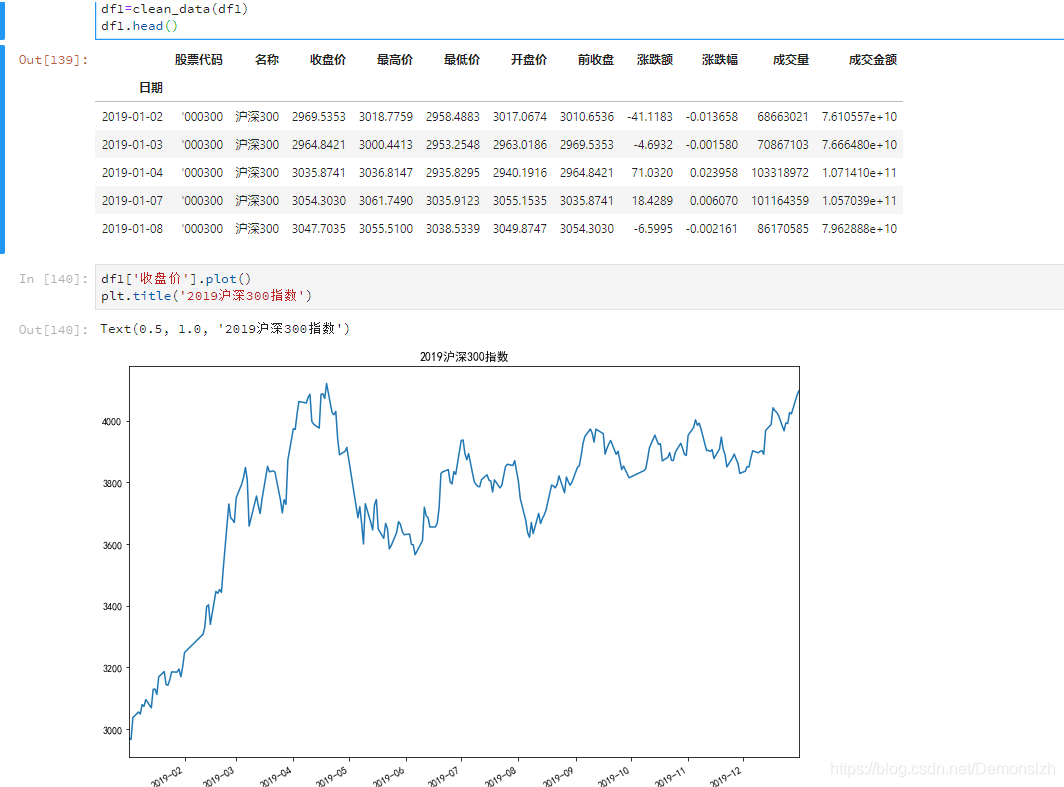
获取沪深300的数据,并查看
    df1=get_data('0000300','20190102','20191231')
    df1=clean_data(df1)
2、定义定投策略函数
    def invest(df1,frequence,invest_money,start_time):
        '''
         定投计算
        :param df1: 数据集
        :param frequence: 定投频率
        :param invest_money: 每次定投金额
        :param start: 定投起始日期
        :return (amount,invest_log): (收益数据DataFrame,定投记录dict)
        '''
        invest_log={}#每次定投的日期记录(日期:大盘指数)
        invest_day=start_time#每次投资的时间
        invest_amount=0#总投资金额
        profile=0#总投资收益
        amount=0#账户总资产

        profile_log=[]#总收益日志
        invest_amount_log=[]#账户投资金额日志
        amount_log=[]#总资产日志
        Yield=[]#收益率日志

        for date,quote_change,index in zip(df1.index,df1['涨跌幅'],df1['收盘价']):
            profile+=quote_change*amount#计算当天收益率
            profile_log.append(profile)


            #判断是否为定投日
            if date==invest_day:
                invest_amount+=invest_money
                invest_log[invest_day]=index#记录定投当日的指数

                #判断7天后是否为交易日,如果不是则往后加1天直到找到交易日
                invest_day+=np.timedelta64(frequence,'D')
                flag=0
                while(True):
                    if(df1[df1.index==invest_day].index==invest_day):
                        break
                    else:
                        invest_day+=np.timedelta64(1,'D')
                        flag+=1
                        if(flag==100):
                            break


            invest_amount_log.append(invest_amount)
            amount=invest_amount+profile#更新账户总资产
            amount_log.append(amount)
            try:
                Yield.append(profile/invest_amount*100)#更新收益率
            except:
                Yield.append(0)
        print("总投资:",invest_amount)
        print("总收益:",profile)
        print("收益率: ",profile/invest_amount*100,"%")

        over=pd.DataFrame({
            "日期":df1.index,
            "收益率":Yield,
            "账户资产":amount_log,
            "投资金额":invest_amount_log
        })
        over=over.set_index("日期")
        return over,invest_log
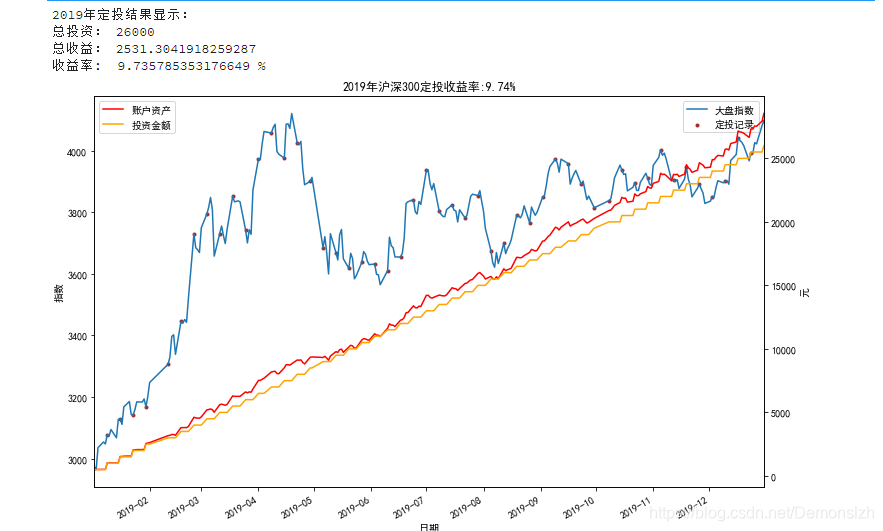
3、计算2019年对沪深300指数基金进行定投的收益率
    frequence=7#定投频率
    invest_money=500#每次定投金额
    start=np.datetime64("2019-01-02")
    print("2019年定投结果显示:")
    res,buy=invest(df1,frequence,invest_money,start)

    def myplot(df1,res,buy,titlename):
        '''
        绘制定投结果图
        '''
        plt.figure()
        df1['收盘价'].plot(label="大盘指数")
        plt.scatter(buy.keys(),buy.values(),color="brown",marker=".",label="定投记录")
        plt.legend(loc='best')
        plt.ylabel("指数")
        plt.twinx()

        res['账户资产'].plot(color="red")
        res['投资金额'].plot(color="orange")
        plt.ylabel("元")
        plt.legend()
        plt.title(titlename+":{:.2f}%".format(res.tail(1)["收益率"][0]))
        plt.show()
    titlename="2019年沪深300定投收益率"
    myplot(df1,res,buy,titlename)
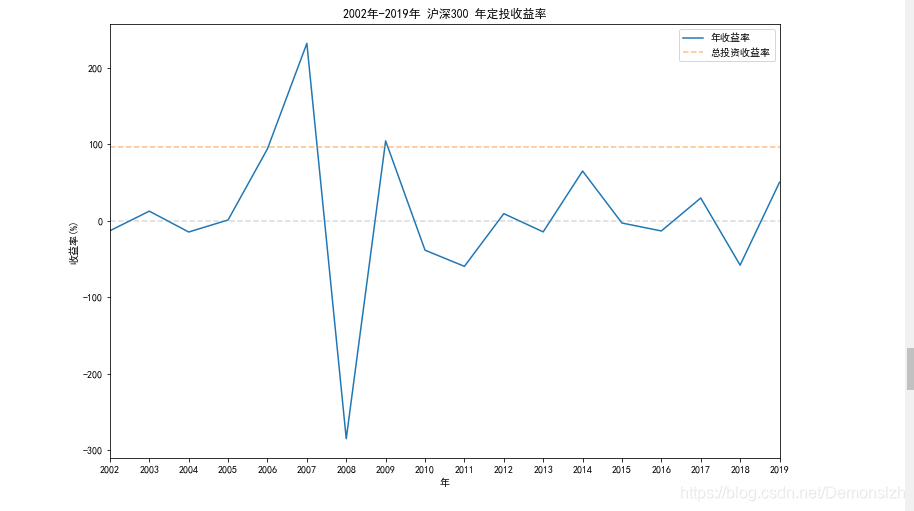
4、假设定投的金额是500元,每周定投一次,据此分别计算从2002年开始到2019年,每年定投沪深300指数基金的收益率并将结果可视化
    df2=get_data('0000300','20020101','20191231')
    df2=clean_data(df2)

    df2['收盘价'].plot()
    plt.title("2002年-2019年沪深300指数")

    frequence=7#定投频率
    invest_money=500#每次定投金额
    print("从2002年开始定投到2019年结束的收益情况:")
    start=np.datetime64("2002-01-07")
    res,buy=invest(df2,frequence,invest_money,start)

    x=[str(i) for i in range(2002,2020)]
    y=[]

    for year in range(2002,2020):
        '''每年的收益率:年末收益率-年初收益率'''
        each_year=res[res.index.year==year].tail(1)["收益率"][0]-res[res.index.year==year].head(1)["收益率"][0]
        y.append(each_year)

    plt.title("2002年-2019年 沪深300 年定投收益率")
    plt.ylabel("收益率(%)")
    plt.xlabel("年")

    plt.plot(x,y,label="年收益率")
    plt.plot(x,[res.tail(1)["收益率"][0] for i in range(len(x))],ls="--",alpha=0.5,label="总投资收益率")
    plt.plot(x,[0 for i in range(len(x))],color="gray",ls="--",alpha=0.3)
    plt.xlim("2002","2019")
    plt.legend()
5、实现"慧定投"(支付宝中的智能定投策略)
定义定投策略(对于每个交易日前一日的收盘价)
- 高于均线15%以内,扣款90%
- 高于均线15-50%,扣款80%
- 高于均线50-100% 扣款70%
- 高于均线 100%以上 扣款60%
-
近10日振幅小于5%
- 低于均线5%以内,扣款180%
- 低于均线5-10%以内,扣款190%
- 低于均线10-20%以内,扣款200%
- 低于均线20-30%以内,扣款210%
- 低于均线30-40%以内,扣款220%
- 低于均线40%以上,扣款230%
-
近10日振幅大于5%
- 低于均线5%以内,扣款60%
- 低于均线5-10%以内,扣款70%
- 低于均线10-20%以内,扣款80%
- 低于均线20-30%以内,扣款90%
- 低于均线30-40%以内,扣款100%
- 低于均线40%以上,扣款110%
所以在这个过程中我们需要定义几个函数,由于要考虑到均线与振幅的问题,所以首先需要定义均线、振幅函数,获取基金n日收益与m日振幅
    def mean_days(df,days,wave):
        '''
         获取n日均线,最近m日振幅
        :param df: 数据集
        :param days: 均线天数
        :params wave:最近m日振幅
        :return average,wavelength:均线、近m日振幅
        '''
        average=[]
        wavelength=[]
        start=df.head(1).index-np.timedelta64(days+1,"D")
        start=start.astype('str')[0].replace("-","")#转换为字符串

        df4=get_data('0000300',start,'20191231')#获得原始数据前days天的数据用以求均值
        df4=clean_data(df4)
        for i in df3.index:
            start_date=i-np.timedelta64(days+1,"D")
            ave=df4[(df4.index>start_date) & (df4.index<i)]['收盘价'].mean()
            average.append(ave)
        ########求振幅#######
        start2=df.head(1).index-np.timedelta64(wave+1,"D")
        start2=start2.astype('str')[0].replace("-","")#转换为字符串
        df5=get_data('0000300',start2,'20191231')
        df5=clean_data(df5)

        for i in df3.index:
            start_date=i-np.timedelta64(wave+1,"D")
            interval=df5[(df5.index>start_date) & (df5.index<i)]['收盘价']
            length=interval.max()/interval.min()-1#最大涨跌幅
            wavelength.append(length)

        return average,wavelength
智能定投策略计算收益率
    def stratege(ml,wl,T_1):
        '''
        定投策略
        :param ml:均线
        :param wl:振幅
        :param T_1:前1日收盘价
        '''
        cal=T_1/ml-1#大于0,则高于均线
        if(cal>=0 and cal<0.15):
            return 0.9
        elif(cal>0.15 and cal<0.5):
            return 0.8
        elif(cal>=0.5 and cal<1):
            return 0.7
        elif(cal>=1):
            return 0.6

        elif(wl>0.05):

            if(cal>=-0.05 and cal<0):
                return 0.6
            elif(cal>=-0.1 and cal<-0.05):
                return 0.7
            elif(cal>=-0.2 and cal<-0.1):
                return 0.8
            elif(cal>=-0.3 and cal<-0.2):
                return 0.9
            elif(cal>=-0.4 and cal<-0.3):
                return 1.0
            elif(cal<-0.4):
                return 1.1
        else:
            if(cal>=-0.05 and cal<0):
                return 1.8
            elif(cal>=-0.1 and cal<-0.05):
                return 1.9
            elif(cal>=-0.2 and cal<-0.1):
                return 2.0
            elif(cal>=-0.3 and cal<-0.2):
                return 2.1
            elif(cal>=-0.4 and cal<-0.3):
                return 2.2
            elif(cal<-0.4):
                return 2.3
完整策略实现
    def smart_invest(df1,frequence,invest_money,start_time,days,wave):
        '''
         定投计算
        :param df1: 数据集
        :param frequence: 定投频率
        :param invest_money: 每次定投金额
        :param start: 定投起始日期
        :param days: 参考均线天数

        :return (amount,invest_log): (收益数据DataFrame,定投记录dict)
        '''
        invest_log={}#每次定投的日期记录(日期:大盘指数)
        invest_day=start_time#每次投资的时间
        invest_amount=0#总投资金额
        profile=0#总投资收益
        amount=0#账户总资产

        profile_log=[]#总收益日志
        invest_amount_log=[]#账户投资金额日志
        amount_log=[]#总资产日志
        Yield=[]#收益率日志

        df1["均线"]=mean_days(df1,days,wave)[0]#获取均线
        df1["振幅"]=mean_days(df1,days,wave)[1]#获取振幅
        for date,quote_change,index,ml,wl in zip(df1.index,df1['涨跌幅'],df1['收盘价'],df1["均线"],df1["振幅"]):

            profile+=quote_change*amount#计算当天收益率
            profile_log.append(profile)


            #判断是否为定投日
            if date==invest_day:
                if(invest_day==start_time):
                    T_1=start_time
                else:
                    formal_day=1
                    while(True):
                        T_1=date-np.timedelta64(formal_day,"D")#前1天的收盘价
                        if(T_1 in df1.index.tolist()):
                            break
                        else:
                            formal_day+=1
                T_1=df1[df1.index==T_1]["收盘价"][0]
                rate=stratege(ml,wl,T_1)
                invest_amount+=invest_money*rate#定投
                invest_log[invest_day]=index#记录定投当日的指数

                #判断7天后是否为交易日,如果不是则往后加1天直到找到交易日
                invest_day+=np.timedelta64(frequence,'D')
                flag=0
                while(True):
                    if(df1[df1.index==invest_day].index==invest_day):
                        break
                    else:
                        invest_day+=np.timedelta64(1,'D')
                        flag+=1
                        if(flag==100):
                            break


            invest_amount_log.append(invest_amount)
            amount=invest_amount+profile#更新账户总资产
            amount_log.append(amount)
            try:
                Yield.append(profile/invest_amount*100)#更新收益率
            except:
                Yield.append(0)
        print("总投资:",invest_amount)
        print("总收益:",profile)
        print("收益率: ",profile/invest_amount*100,"%")

        over=pd.DataFrame({
            "日期":df1.index,
            "收益率":Yield,
            "账户资产":amount_log,
            "投资金额":invest_amount_log
        })
        over=over.set_index("日期")
        return over,invest_log
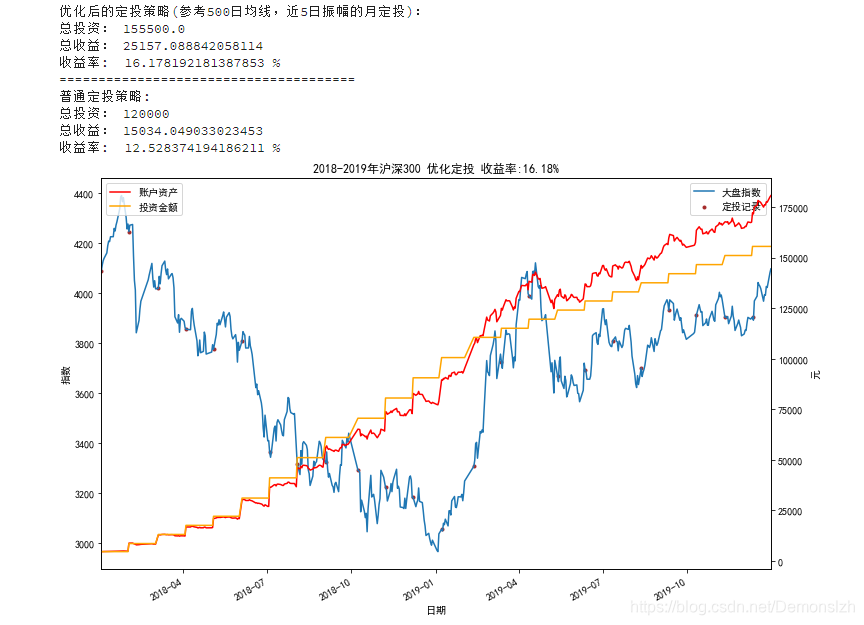
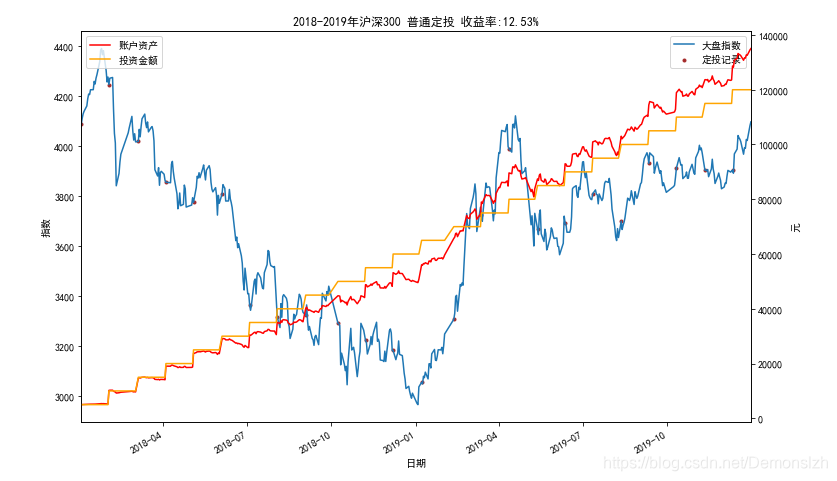
四、可视化普通定投与智能定投策略收益率
    frequence=30#定投频率
    invest_money=5000#每次定投金额
    start=np.datetime64("2018-01-02")
    print("优化后的定投策略(参考500日均线,近5日振幅的月定投):")
    res1,buy1=smart_invest(df3,frequence,invest_money,start,500,5)
    print("======================================\n普通定投策略:")
    res2,buy2=invest(df3,frequence,invest_money,start)
    myplot(df3,res1,buy1,"2018-2019年沪深300 优化定投 收益率")
    myplot(df3,res2,buy2,"2018-2019年沪深300 普通定投 收益率")
五、文末福利(完整代码)
关注以下公众号回复"0003"获取完整源码


 浙公网安备 33010602011771号