02-34 非线性支持向量机(鸢尾花分类)+自定义数据分类
目录
人工智能从入门到放弃完整教程目录:https://www.cnblogs.com/nickchen121/p/11686958.html
非线性支持向量机(鸢尾花分类)+自定义随机数据
一、导入模块
import numpy as np
import pandas as pd
import matplotlib.pyplot as plt
from matplotlib.colors import ListedColormap
from matplotlib.font_manager import FontProperties
from sklearn import datasets
from sklearn.svm import SVC
%matplotlib inline
font = FontProperties(fname='/Library/Fonts/Heiti.ttc')
二、自定义数据分类
2.1 自定义数据
# 保证随机数不重复
np.random.seed(1)
# 创建100个二维数组,即100个2个特征的样本
X_custom = np.random.randn(100, 2)
# np.logical_xor(bool1, bool2),异或逻辑运算,如果bool1和bool2的结果相同则为False,否则为True
# ++和--为一三象限,+-和-+为二四象限,如此做则100个样本必定线性不可分
y_custom = np.logical_xor(X_custom[:, 0] > 0, X_custom[:, 1] > 0)
# 二四象限为True,即为1类;一三象限为False,即为-1类
y_custom = np.where(y_custom, 1, -1)
2.2 构建决策边界
def plot_decision_regions(X, y, classifier=None):
    marker_list = ['o', 'x', 's']
    color_list = ['r', 'b', 'g']
    cmap = ListedColormap(color_list[:len(np.unique(y))])

    x1_min, x1_max = X[:, 0].min()-1, X[:, 0].max()+1
    x2_min, x2_max = X[:, 1].min()-1, X[:, 1].max()+1
    t1 = np.linspace(x1_min, x1_max, 666)
    t2 = np.linspace(x2_min, x2_max, 666)

    x1, x2 = np.meshgrid(t1, t2)
    y_hat = classifier.predict(np.array([x1.ravel(), x2.ravel()]).T)
    y_hat = y_hat.reshape(x1.shape)
    plt.contourf(x1, x2, y_hat, alpha=0.2, cmap=cmap)
    plt.xlim(x1_min, x1_max)
    plt.ylim(x2_min, x2_max)

    for ind, clas in enumerate(np.unique(y)):
        plt.scatter(X[y == clas, 0], X[y == clas, 1], alpha=0.8, s=50,
                    c=color_list[ind], marker=marker_list[ind], label=clas)
2.3 训练模型
# rbf为高斯核
svm = SVC(kernel='rbf', gamma='auto', C=1, random_state=1)
svm.fit(X_custom, y_custom)
SVC(C=1, cache_size=200, class_weight=None, coef0=0.0,
  decision_function_shape='ovr', degree=3, gamma='auto', kernel='rbf',
  max_iter=-1, probability=False, random_state=1, shrinking=True,
  tol=0.001, verbose=False)
2.4 可视化
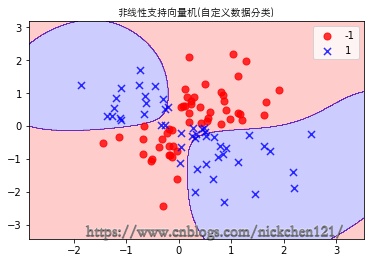
plot_decision_regions(X_custom, y_custom, classifier=svm)
plt.title('非线性支持向量机(自定义数据分类)',fontproperties=font)
plt.legend()
plt.show()
三、鸢尾花分类
3.1 获取数据
iris_data = datasets.load_iris()
X = iris_data.data[:, [2, 3]]
y = iris_data.target
label_list = ['山鸢尾', '杂色鸢尾', '维吉尼亚鸢尾']
3.2 构建决策边界
def plot_decision_regions(X, y, classifier=None):
    marker_list = ['o', 'x', 's']
    color_list = ['r', 'b', 'g']
    cmap = ListedColormap(color_list[:len(np.unique(y))])

    x1_min, x1_max = X[:, 0].min()-1, X[:, 0].max()+1
    x2_min, x2_max = X[:, 1].min()-1, X[:, 1].max()+1
    t1 = np.linspace(x1_min, x1_max, 666)
    t2 = np.linspace(x2_min, x2_max, 666)

    x1, x2 = np.meshgrid(t1, t2)
    y_hat = classifier.predict(np.array([x1.ravel(), x2.ravel()]).T)
    y_hat = y_hat.reshape(x1.shape)
    plt.contourf(x1, x2, y_hat, alpha=0.2, cmap=cmap)
    plt.xlim(x1_min, x1_max)
    plt.ylim(x2_min, x2_max)

    for ind, clas in enumerate(np.unique(y)):
        plt.scatter(X[y == clas, 0], X[y == clas, 1], alpha=0.8, s=50,
                    c=color_list[ind], marker=marker_list[ind], label=label_list[clas])
3.3 训练模型(gamma=1)
# rbf为高斯核
svm = SVC(kernel='rbf', gamma=1, C=1, random_state=1)
svm.fit(X, y)
SVC(C=1, cache_size=200, class_weight=None, coef0=0.0,
  decision_function_shape='ovr', degree=3, gamma=1, kernel='rbf',
  max_iter=-1, probability=False, random_state=1, shrinking=True,
  tol=0.001, verbose=False)
3.4 可视化
plot_decision_regions(X, y, classifier=svm)
plt.xlabel('花瓣长度(cm)', fontproperties=font)
plt.ylabel('花瓣宽度(cm)', fontproperties=font)
plt.title('非线性支持向量机代码(鸢尾花分类, gamma=1)', fontproperties=font, fontsize=20)
plt.legend(prop=font)
plt.show()

3.5 训练模型(gamma=100)
# rbf为高斯核
svm = SVC(kernel='rbf', gamma=100, C=1, random_state=1)
svm.fit(X, y)
SVC(C=1, cache_size=200, class_weight=None, coef0=0.0,
  decision_function_shape='ovr', degree=3, gamma=100, kernel='rbf',
  max_iter=-1, probability=False, random_state=1, shrinking=True,
  tol=0.001, verbose=False)
3.6 可视化
plot_decision_regions(X, y, classifier=svm)
plt.xlabel('花瓣长度(cm)', fontproperties=font)
plt.ylabel('花瓣宽度(cm)', fontproperties=font)
plt.title('非线性支持向量机代码(鸢尾花分类, gamma=100)', fontproperties=font, fontsize=20)
plt.legend(prop=font)
plt.show()


 浙公网安备 33010602011771号