matplotlib--annotate、text
一、 Axes.annotate(s, xy, *args, **kwargs)
- s:标注的内容
- xy:被注释的坐标点,二维元组形如(x,y),参照点,箭头的起点。
参数:
- xytext:注释文本的坐标点,箭头的终点,相较于参照点的偏移量
- xycoords:被注释点的坐标系属性,允许输入的值如下
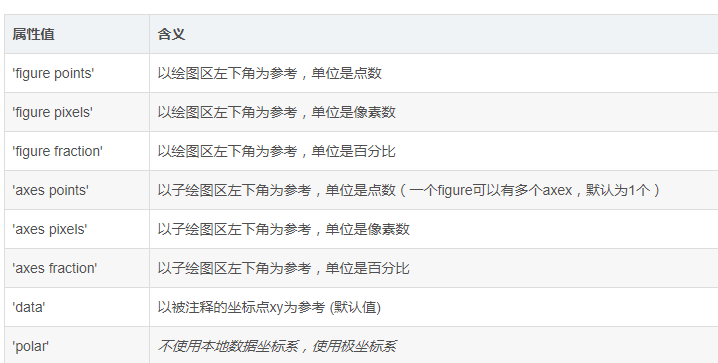
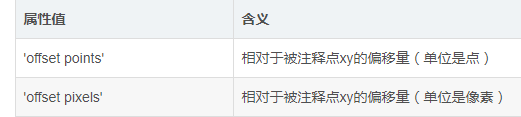
- textcoords :注释文本的坐标系属性,默认与xycoords属性值相同,也可设为不同的值。除了允许输入xycoords的属性值,还允许输入以下两种:
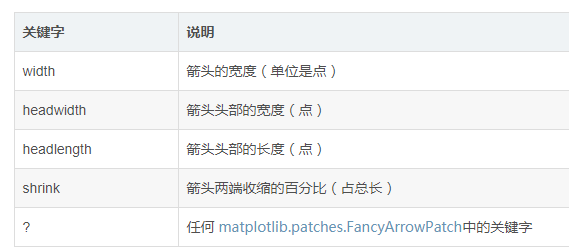
- arrowprops:箭头的样式,dict(字典)型数据,如果该属性非空,则会在注释文本和被注释点之间画一个箭头。如果不设置
'arrowstyle'关键字,则允许包含以下关键字:
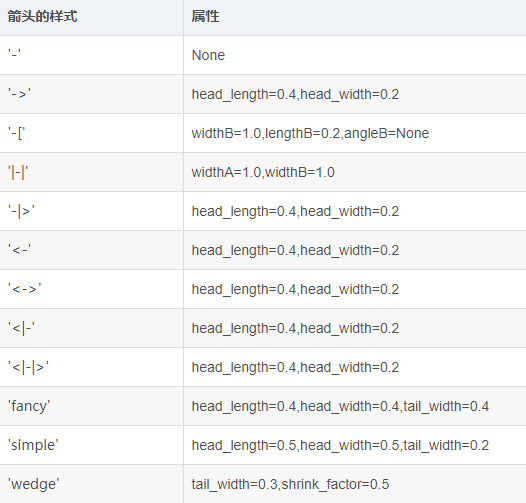
- 如果设置了‘arrowstyle’关键字,以上关键字就不能使用。允许的值有:
- annotation_clip : 布尔值,可选参数,默认为空。设为True时,只有被注释点在子图区内时才绘制注释;设为False时,无论被注释点在哪里都绘制注释。仅当xycoords为‘data’时,默认值空相当于True。
二、 例子
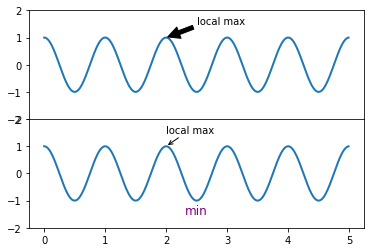
import numpy as np
import matplotlib.pyplot as plt

fig, ax = plt.subplots(2,1,sharex = True,sharey = True)
plt.subplots_adjust(wspace=0, hspace=0)

# 绘制一个余弦曲线
t = np.arange(0.0, 5.0, 0.01)
s = np.cos(2*np.pi*t)
line, = ax[0].plot(t, s, lw=2)

# 绘制一个黑色,两端缩进的箭头
ax[0].annotate('local max', xy=(2, 1), xytext=(2.5, 1.5),
            xycoords='data',
            arrowprops=dict(color='black', shrink=0.05)
            )
ax[0].set_ylim(-2, 2)


t = np.arange(0.0, 5.0, 0.01)
s = np.cos(2*np.pi*t)
line, = ax[1].plot(t, s, lw=2)

# 绘制一个黑色,两端缩进的箭头
ax[1].annotate('local max', xy=(2, 1), xytext=(2, 1.5),
            xycoords='data',arrowprops=dict(arrowstyle = '->'
            ))
plt.text(2.3, -1.5,'min',fontdict={'size':12,'color':'purple'})
plt.show()
三、text函数
plt.text(x,y,string,fontdict = {'size':12,'color':'red'})


 浙公网安备 33010602011771号