在vue中使用 Echarts组件化 父子组件--> 分辨率适配
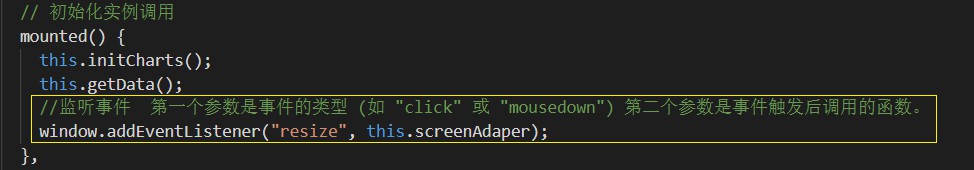
通过事件监听:
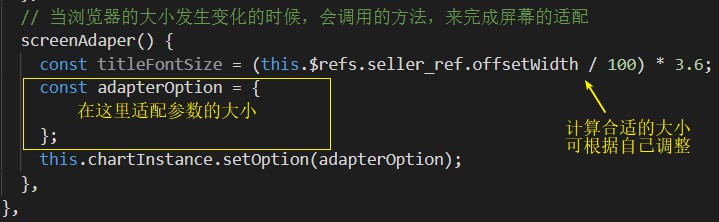
适配参数:
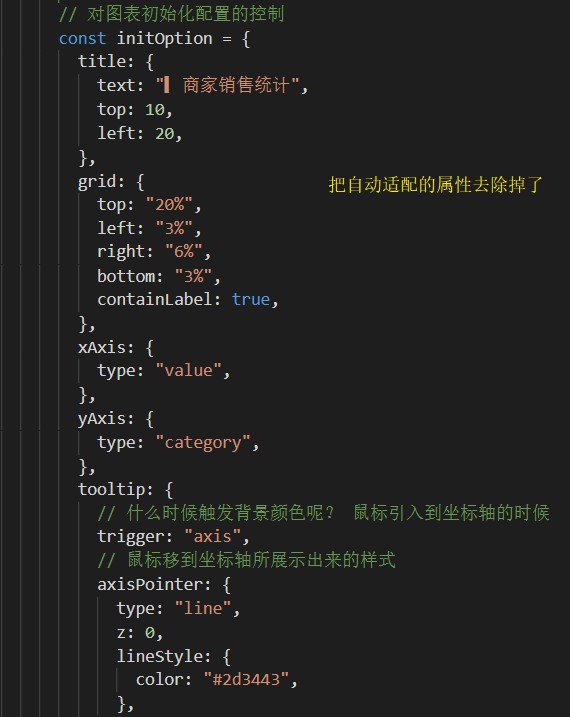
在初始化实例调用的时候已经完成了 屏幕的适配,所以在图表初始化的时候,可以把固定的数值给去除
到分辨率适配的完整代码:
<!--
要呈现的具体的组件
-->
<template>
<div class="com-container">
<div class="com-chart" ref="seller_ref"></div>
</div>
</template>
<script>
export default {
data() {
return {
chartInstance: null,
// 服务器返回的数据
allDate: null,
// 当前显示的页数
currentPage: 1,
// 一共有多少页
totalPage: 0,
// 定时器的标识
timerID: null,
};
},
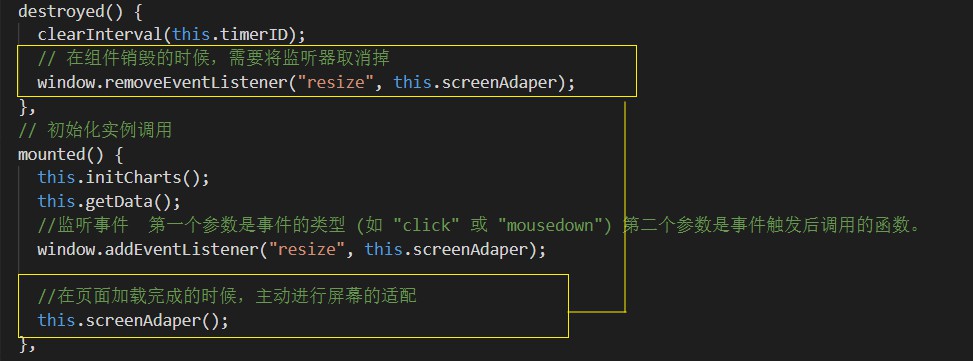
destroyed() {
clearInterval(this.timerID);
// 在组件销毁的时候,需要将监听器取消掉
window.removeEventListener("resize", this.screenAdaper);
},
// 初始化实例调用
mounted() {
this.initCharts();
this.getData();
//监听事件 第一个参数是事件的类型 (如 "click" 或 "mousedown") 第二个参数是事件触发后调用的函数。
window.addEventListener("resize", this.screenAdaper);
//在页面加载完成的时候,主动进行屏幕的适配
this.screenAdaper();
},
methods: {
// 初始化 chartInstance 对象
initCharts() {
//创建 chartInstance 对象
this.chartInstance = this.$echarts.init(this.$refs.seller_ref, "dark");
/*
1.init() 需要传递一个参数 => 图表最终要显示的dom元素 => com-chart
2.为了更方便的 获取这个元div 我们给这个div设置 ref="seller_ref"
在 init() 中通过 this.$refs.seller_ref 获取这个div
3.init() 的返回值就是一个 chartInstance 对象 ,我们可以把这个对象
保存到 data() 当中
4.那么什么时候调用 initCharts() 这个方法呢?
在 initCharts() 中 我们 获取了dom的元素
在Vue的生命周期中 什么时候代表 dom元素加载完毕了呢? => mounted()方法
所以在 mounted 方法中调用 initCharts() 这个方法
**/
// 对图表初始化配置的控制
const initOption = {
title: {
text: "▎商家销售统计",
top: 10,
left: 20,
},
grid: {
top: "20%",
left: "3%",
right: "6%",
bottom: "3%",
containLabel: true,
},
xAxis: {
type: "value",
},
yAxis: {
type: "category",
},
tooltip: {
// 什么时候触发背景颜色呢? 鼠标引入到坐标轴的时候
trigger: "axis",
// 鼠标移到坐标轴所展示出来的样式
axisPointer: {
type: "line",
z: 0,
lineStyle: {
color: "#2d3443",
},
},
},
series: [
{
type: "bar",
label: {
show: true,
position: "right",
textStyle: {
color: "white",
},
},
itemStyle: {
// 线性渐变对象 => 指明颜色渐变方向 => 指明不同颜色下 百分比的值
color: new this.$echarts.graphic.LinearGradient(0, 0, 1, 0, [
// 百分之0状态下的颜色值
{ offset: 0, color: "#5052ee" },
// 百分之100状态下的颜色值
{ offset: 1, color: "#ab6ee5" },
]),
},
},
],
};
this.chartInstance.setOption(initOption);
//对图表对象 进行 鼠标事件的监听
this.chartInstance.on("mouseover", () => {
clearInterval(this.timerID);
});
this.chartInstance.on("mouseout", () => {
this.startInterval(this.timerID);
});
},
// 获取服务器的数据
async getData() {
//http:// ip:端口/文件路径
// const ret = await this.$axios.get("http://127.0.0.1:80/api/sellers");
// 从服务器请求的数据
const ret = [
{ name: "商品1", value: 50 },
{ name: "商品2", value: 60 },
{ name: "商品3", value: 70 },
{ name: "商品4", value: 80 },
{ name: "商品5", value: 90 },
{ name: "商品6", value: 100 },
{ name: "商品7", value: 110 },
{ name: "商品8", value: 120 },
];
this.allDate = ret;
//对数组进行排序 通过回调函数来决定是 从大到小 还是 从小到大
this.allDate.sort((a, b) => {
return b.value - a.value; //从大到小 (从小到大 => a.value - b.value )
});
// 每5个元素显示一页
this.totalPage =
this.allDate.length % 5 === 0
? this.allDate.length / 5
: this.allDate.length / 5 + 1;
this.updateChart();
// 启动定时器 ,每隔3秒改变 currentPage 的 值
this.startInterval();
/*
this.$axios.get("") 返回的是promise对象 ,可以用 await 来解析数据
当一个方法用 await 解析 ,方法前面需要加上 async 修饰
**/
},
// 更新图表
updateChart() {
//从 allDate 中 取一部分数据 slice() 截取数组:包含第一个数值 不包含后面的数值 比如 slice(0,5)截取 0-4
const start = (this.currentPage - 1) * 5;
const end = this.currentPage * 5;
const showData = this.allDate.slice(start, end);
const sellerNames = showData.map((item) => {
return item.name;
});
const sellerValues = showData.map((item) => {
return item.value;
});
const dataOption = {
yAxis: {
data: sellerNames,
},
series: [
{
data: sellerValues,
},
],
};
this.chartInstance.setOption(dataOption);
},
// 定时器 决定 动态刷新的效果
startInterval() {
// 小技巧:一般定时器前 先判断 关闭一下
if (this.timerID) {
clearInterval(this.timerID);
}
this.timerID = setInterval(() => {
this.currentPage++;
// 如果 数据currentPage自增到 超出总页数 就让他从头计算
if (this.currentPage > this.totalPage) {
this.currentPage = 1;
}
this.updateChart();
}, 3000);
},
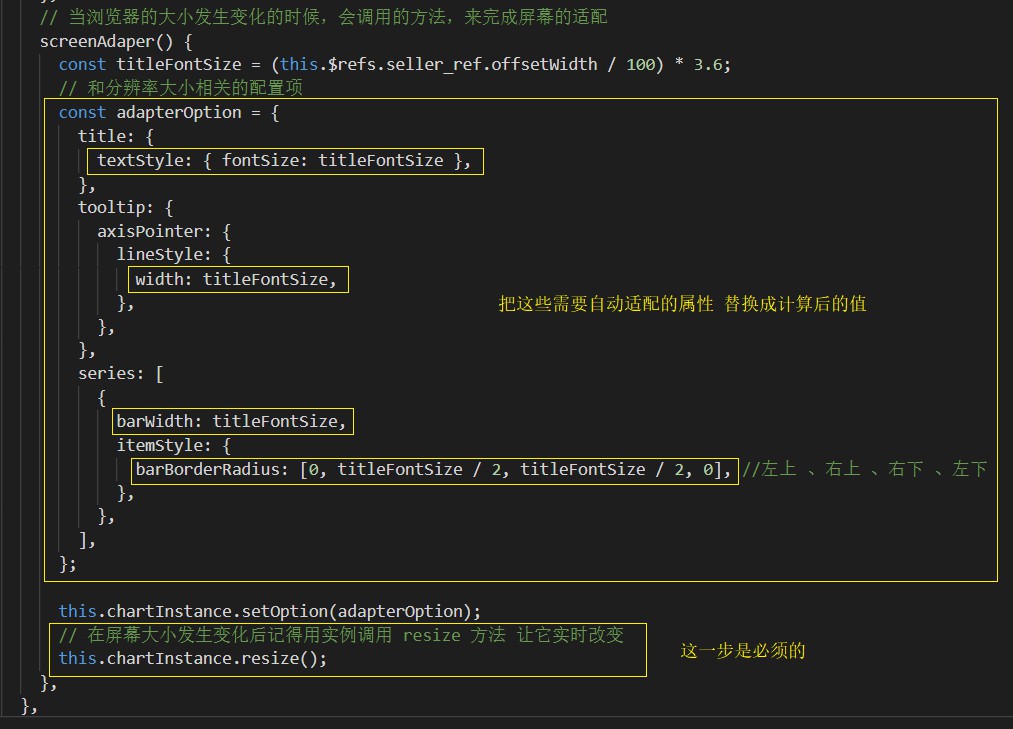
// 当浏览器的大小发生变化的时候,会调用的方法,来完成屏幕的适配
screenAdaper() {
const titleFontSize = (this.$refs.seller_ref.offsetWidth / 100) * 3.6;
// 和分辨率大小相关的配置项
const adapterOption = {
title: {
textStyle: { fontSize: titleFontSize },
},
tooltip: {
axisPointer: {
lineStyle: {
width: titleFontSize,
},
},
},
series: [
{
barWidth: titleFontSize,
itemStyle: {
barBorderRadius: [0, titleFontSize / 2, titleFontSize / 2, 0], //左上 、右上 、右下 、左下
},
},
],
};
this.chartInstance.setOption(adapterOption);
// 在屏幕大小发生变化后记得用实例调用 resize 方法 让它实时改变
this.chartInstance.resize();
},
},
};
</script>
<style>
</style>

 浙公网安备 33010602011771号