[Metricbeat] Metricbeat监控golang服务器
0x0 前言
最近这几天研究了一下ElasticSearch相关的技术栈。前面一篇转发了别人些的非常详细的ElasticSearch和Kibana搭建的过程。发现Elastic家族还有Metricbeat这个神器,今天我们把前面搭建的和这个工具一起利用起来。
0x1 需求
需求是这样:我有很多个Golang写的应用程序,每程序连接一个Redis数据库,每个程序开在一台物理机上。我需要把每个golang应用每个Redis数据库和每个所在的物理机监控起来。
0x2 启动Metricbeat
1. 下载Metricbeat https://www.elastic.co/downloads/beats/metricbeat,注意和前面ElasticSearch和Kibana版本匹配,我用的全是6.8.0的版本。
2. 修改配置
1)修改根目录下metricbeat.yml配置。主要是general里的name和Elasticsearch output里的hosts,以及Kibana里的host。general的name自己取一个特征名字就行,这个步骤很关键,为后面能区分不同的服务器的数据用。
#================================ General =====================================

# The name of the shipper that publishes the network data. It can be used to group
# all the transactions sent by a single shipper in the web interface.
name: "server-1"

#-------------------------- Elasticsearch output ------------------------------
output.elasticsearch:
  # Array of hosts to connect to.
  hosts: ["localhost:9200"]

#============================== Kibana =====================================

# Starting with Beats version 6.0.0, the dashboards are loaded via the Kibana API.
# This requires a Kibana endpoint configuration.
setup.kibana:

  # Kibana Host
  # Scheme and port can be left out and will be set to the default (http and 5601)
  # In case you specify and additional path, the scheme is required: http://localhost:5601/path
  # IPv6 addresses should always be defined as: https://[2001:db8::1]:5601
  host: "localhost:5601"
2)修改modules.d下module配置
i. 复制一份golang.yml.disable改名成golang.yml。修改配置如下
# Module: golang
# Docs: https://www.elastic.co/guide/en/beats/metricbeat/6.8/metricbeat-module-golang.html

- module: golang
  metricsets:
    - expvar
    - heap
  period: 10s
  hosts: ["localhost:10000"]
  heap.path: "/debug/vars"
  expvar:
    namespace: "example"
    path: "/debug/vars"
ii. 复制一份redis.yml.disabled改名成redis.yml。修改配置如下
# Module: redis
# Docs: https://www.elastic.co/guide/en/beats/metricbeat/6.8/metricbeat-module-redis.html

- module: redis
  metricsets:
    - info
    - keyspace
  period: 10s

  # Redis hosts
  hosts: ["127.0.0.1:6379"]

  # Network type to be used for redis connection. Default: tcp
  #network: tcp

  # Max number of concurrent connections. Default: 10
  #maxconn: 10

  # Redis AUTH password. Empty by default.
  # password: foobared
3. 给ElasticSearch和Kibana导入index的mapping和dashboard。
./metricbeat setup
如果前面的ElasticSearch和Kibana的配置不对这步会报错
4. 启动Metricbeat ./metricbeat -e -v -c ./metricbeat.yml
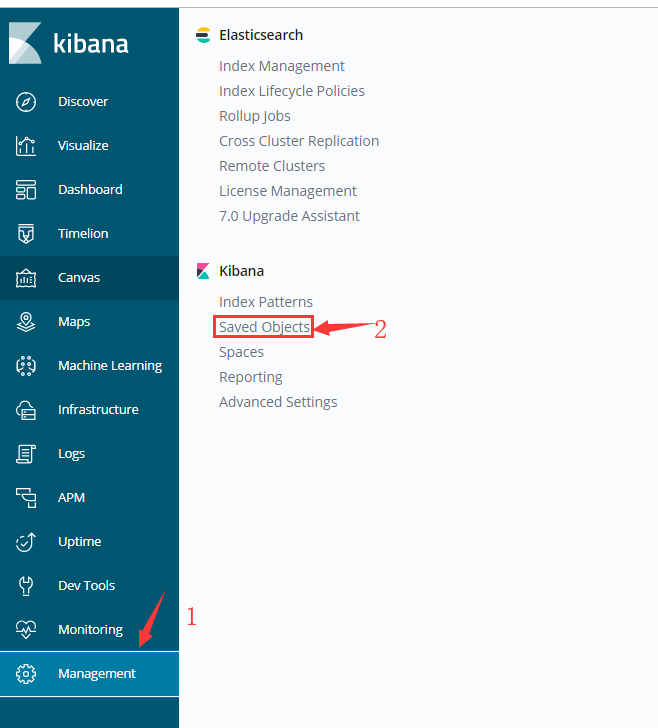
0x3 配置Kibana
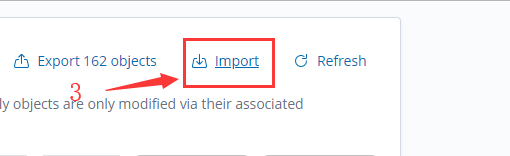
导入我这个dashboard展示数据(UI是我调的,可以根据自己需求调整)。
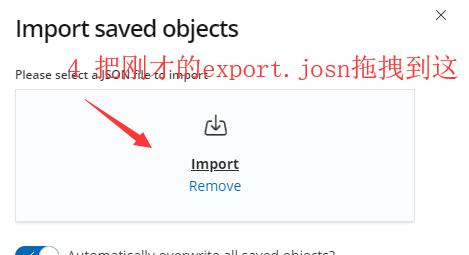
1. 把下面这个保存成一个文件名命export.json。
[
  {
    "_id": "198d2300-7c3d-11e9-98c8-6b014c613efb",
    "_type": "dashboard",
    "_source": {
      "title": "Server Info",
      "hits": 0,
      "description": "Overview of Go profiling information",
      "panelsJSON": "[{\"gridData\":{\"x\":0,\"y\":0,\"w\":48,\"h\":15,\"i\":\"8\"},\"id\":\"58000780-f529-11e6-844d-b170e2f0a07e\",\"panelIndex\":\"8\",\"type\":\"visualization\",\"version\":\"6.8.0\"},{\"gridData\":{\"x\":0,\"y\":15,\"w\":16,\"h\":20,\"i\":\"9\"},\"id\":\"95388680-f52a-11e6-969c-518c48c913e4\",\"panelIndex\":\"9\",\"type\":\"visualization\",\"version\":\"6.8.0\"},{\"gridData\":{\"x\":32,\"y\":15,\"w\":16,\"h\":20,\"i\":\"10\"},\"id\":\"b59a5200-f52a-11e6-969c-518c48c913e4\",\"panelIndex\":\"10\",\"type\":\"visualization\",\"version\":\"6.8.0\"},{\"gridData\":{\"x\":16,\"y\":15,\"w\":16,\"h\":20,\"i\":\"11\"},\"id\":\"9a9a8bf0-f52a-11e6-969c-518c48c913e4\",\"panelIndex\":\"11\",\"type\":\"visualization\",\"version\":\"6.8.0\"},{\"gridData\":{\"x\":24,\"y\":35,\"w\":24,\"h\":20,\"i\":\"12\"},\"id\":\"b046cb80-f52a-11e6-969c-518c48c913e4\",\"panelIndex\":\"12\",\"type\":\"visualization\",\"version\":\"6.8.0\"},{\"gridData\":{\"x\":0,\"y\":35,\"w\":24,\"h\":20,\"i\":\"13\"},\"id\":\"ab226b50-f52a-11e6-969c-518c48c913e4\",\"panelIndex\":\"13\",\"type\":\"visualization\",\"version\":\"6.8.0\"},{\"gridData\":{\"x\":24,\"y\":71,\"w\":24,\"h\":9,\"i\":\"14\"},\"version\":\"6.8.0\",\"panelIndex\":\"14\",\"type\":\"visualization\",\"id\":\"bfa5e400-1b16-11e7-b09e-037021c4f8df\",\"embeddableConfig\":{}},{\"gridData\":{\"x\":0,\"y\":80,\"w\":24,\"h\":12,\"i\":\"15\"},\"version\":\"6.8.0\",\"panelIndex\":\"15\",\"type\":\"visualization\",\"id\":\"e0f001c0-1b18-11e7-b09e-037021c4f8df\",\"embeddableConfig\":{}},{\"gridData\":{\"x\":24,\"y\":80,\"w\":24,\"h\":12,\"i\":\"16\"},\"version\":\"6.8.0\",\"panelIndex\":\"16\",\"type\":\"visualization\",\"id\":\"2e224660-1b19-11e7-b09e-037021c4f8df\",\"embeddableConfig\":{}},{\"gridData\":{\"x\":0,\"y\":71,\"w\":24,\"h\":9,\"i\":\"17\"},\"version\":\"6.8.0\",\"panelIndex\":\"17\",\"type\":\"visualization\",\"id\":\"ab2d1e90-1b1a-11e7-b09e-037021c4f8df\",\"embeddableConfig\":{}},{\"gridData\":{\"x\":24,\"y\":92,\"w\":24,\"h\":9,\"i\":\"18\"},\"version\":\"6.8.0\",\"panelIndex\":\"18\",\"type\":\"visualization\",\"id\":\"089b85d0-1b16-11e7-b09e-037021c4f8df\",\"embeddableConfig\":{}},{\"gridData\":{\"x\":0,\"y\":55,\"w\":48,\"h\":8,\"i\":\"27\"},\"version\":\"6.8.0\",\"panelIndex\":\"27\",\"type\":\"visualization\",\"id\":\"Redis-hosts\",\"embeddableConfig\":{}},{\"gridData\":{\"x\":0,\"y\":92,\"w\":24,\"h\":9,\"i\":\"32\"},\"version\":\"6.8.0\",\"panelIndex\":\"32\",\"type\":\"visualization\",\"id\":\"6b7b9a40-faa1-11e6-86b1-cd7735ff7e23\",\"embeddableConfig\":{}},{\"gridData\":{\"x\":16,\"y\":101,\"w\":18,\"h\":10,\"i\":\"33\"},\"version\":\"6.8.0\",\"panelIndex\":\"33\",\"type\":\"visualization\",\"id\":\"4d546850-1b15-11e7-b09e-037021c4f8df\",\"embeddableConfig\":{}},{\"gridData\":{\"x\":0,\"y\":101,\"w\":16,\"h\":10,\"i\":\"39\"},\"version\":\"6.8.0\",\"panelIndex\":\"39\",\"type\":\"visualization\",\"id\":\"4e4bb1e0-1b1b-11e7-b09e-037021c4f8df\",\"embeddableConfig\":{}},{\"gridData\":{\"x\":22,\"y\":63,\"w\":5,\"h\":8,\"i\":\"41\"},\"version\":\"6.8.0\",\"panelIndex\":\"41\",\"type\":\"visualization\",\"id\":\"34f97ee0-1b96-11e7-8ada-3df93aab833e\",\"embeddableConfig\":{}},{\"gridData\":{\"x\":44,\"y\":63,\"w\":4,\"h\":8,\"i\":\"43\"},\"version\":\"6.8.0\",\"panelIndex\":\"43\",\"type\":\"visualization\",\"id\":\"96976150-4d5d-11e7-aa29-87a97a796de6\",\"embeddableConfig\":{}},{\"gridData\":{\"x\":34,\"y\":101,\"w\":7,\"h\":10,\"i\":\"44\"},\"version\":\"6.8.0\",\"panelIndex\":\"44\",\"type\":\"visualization\",\"id\":\"99381c80-4d60-11e7-9a4c-ed99bbcaa42b\",\"embeddableConfig\":{}},{\"gridData\":{\"x\":41,\"y\":101,\"w\":7,\"h\":10,\"i\":\"45\"},\"version\":\"6.8.0\",\"panelIndex\":\"45\",\"type\":\"visualization\",\"id\":\"c5e3cf90-4d60-11e7-9a4c-ed99bbcaa42b\",\"embeddableConfig\":{}},{\"gridData\":{\"x\":35,\"y\":63,\"w\":5,\"h\":8,\"i\":\"48\"},\"version\":\"6.8.0\",\"panelIndex\":\"48\",\"type\":\"visualization\",\"id\":\"522ee670-1b92-11e7-bec4-a5e9ec5cab8b\",\"embeddableConfig\":{}},{\"gridData\":{\"x\":40,\"y\":63,\"w\":4,\"h\":8,\"i\":\"49\"},\"version\":\"6.8.0\",\"panelIndex\":\"49\",\"type\":\"visualization\",\"id\":\"1aae9140-1b93-11e7-8ada-3df93aab833e\",\"embeddableConfig\":{}},{\"gridData\":{\"x\":5,\"y\":63,\"w\":5,\"h\":8,\"i\":\"51\"},\"version\":\"6.8.0\",\"panelIndex\":\"51\",\"type\":\"visualization\",\"id\":\"d3166e80-1b91-11e7-bec4-a5e9ec5cab8b\",\"embeddableConfig\":{}},{\"gridData\":{\"x\":0,\"y\":63,\"w\":5,\"h\":8,\"i\":\"52\"},\"version\":\"6.8.0\",\"panelIndex\":\"52\",\"type\":\"visualization\",\"id\":\"83e12df0-1b91-11e7-bec4-a5e9ec5cab8b\",\"embeddableConfig\":{}},{\"gridData\":{\"x\":27,\"y\":63,\"w\":4,\"h\":8,\"i\":\"54\"},\"version\":\"6.8.0\",\"panelIndex\":\"54\",\"type\":\"visualization\",\"id\":\"590a60f0-5d87-11e7-8884-1bb4c3b890e4\",\"embeddableConfig\":{}},{\"gridData\":{\"x\":10,\"y\":63,\"w\":4,\"h\":8,\"i\":\"55\"},\"version\":\"6.8.0\",\"panelIndex\":\"55\",\"type\":\"visualization\",\"id\":\"825fdb80-4d1d-11e7-b5f2-2b7c1895bf32\",\"embeddableConfig\":{}},{\"gridData\":{\"x\":31,\"y\":63,\"w\":4,\"h\":8,\"i\":\"56\"},\"version\":\"6.8.0\",\"panelIndex\":\"56\",\"type\":\"visualization\",\"id\":\"d2e80340-4d5c-11e7-aa29-87a97a796de6\",\"embeddableConfig\":{}},{\"gridData\":{\"x\":14,\"y\":63,\"w\":4,\"h\":8,\"i\":\"57\"},\"version\":\"6.8.0\",\"panelIndex\":\"57\",\"type\":\"visualization\",\"id\":\"26732e20-1b91-11e7-bec4-a5e9ec5cab8b\",\"embeddableConfig\":{}},{\"gridData\":{\"x\":18,\"y\":63,\"w\":4,\"h\":8,\"i\":\"58\"},\"version\":\"6.8.0\",\"panelIndex\":\"58\",\"type\":\"visualization\",\"id\":\"19e123b0-4d5a-11e7-aee5-fdc812cc3bec\",\"embeddableConfig\":{}}]",
      "optionsJSON": "{\"darkTheme\":false,\"useMargins\":true}",
      "version": 1,
      "timeRestore": false,
      "kibanaSavedObjectMeta": {
        "searchSourceJSON": "{\"filter\":[{\"$state\":{\"store\":\"appState\"},\"meta\":{\"alias\":null,\"disabled\":true,\"index\":\"metricbeat-*\",\"key\":\"beat.name\",\"negate\":false,\"params\":{\"query\":\"sanguo-HOSTIP\",\"type\":\"phrase\"},\"type\":\"phrase\",\"value\":\"sanguo-HOSTIP\"},\"query\":{\"match\":{\"beat.name\":{\"query\":\"sanguo-HOSTIP\",\"type\":\"phrase\"}}}},{\"$state\":{\"store\":\"appState\"},\"meta\":{\"alias\":null,\"disabled\":false,\"index\":\"metricbeat-*\",\"key\":\"beat.name\",\"negate\":false,\"params\":{\"query\":\"BPC2797\",\"type\":\"phrase\"},\"type\":\"phrase\",\"value\":\"BPC2797\"},\"query\":{\"match\":{\"beat.name\":{\"query\":\"BPC2797\",\"type\":\"phrase\"}}}}],\"query\":{\"language\":\"lucene\",\"query\":{\"query_string\":{\"analyze_wildcard\":true,\"default_field\":\"*\",\"query\":\"*\"}}},\"version\":true,\"highlightAll\":true}"
      }
    }
  }
]
2. 导入Kibana。
0x4 给golang程序增加监控代码
这个比较简单直接在main.go的import里加入 _ "expvar",然后开启http服务器就行了http.ListenAndServe。注意这个端口要和上面golang.yml里配的端口6060一致。
然后把这个程序运行起来
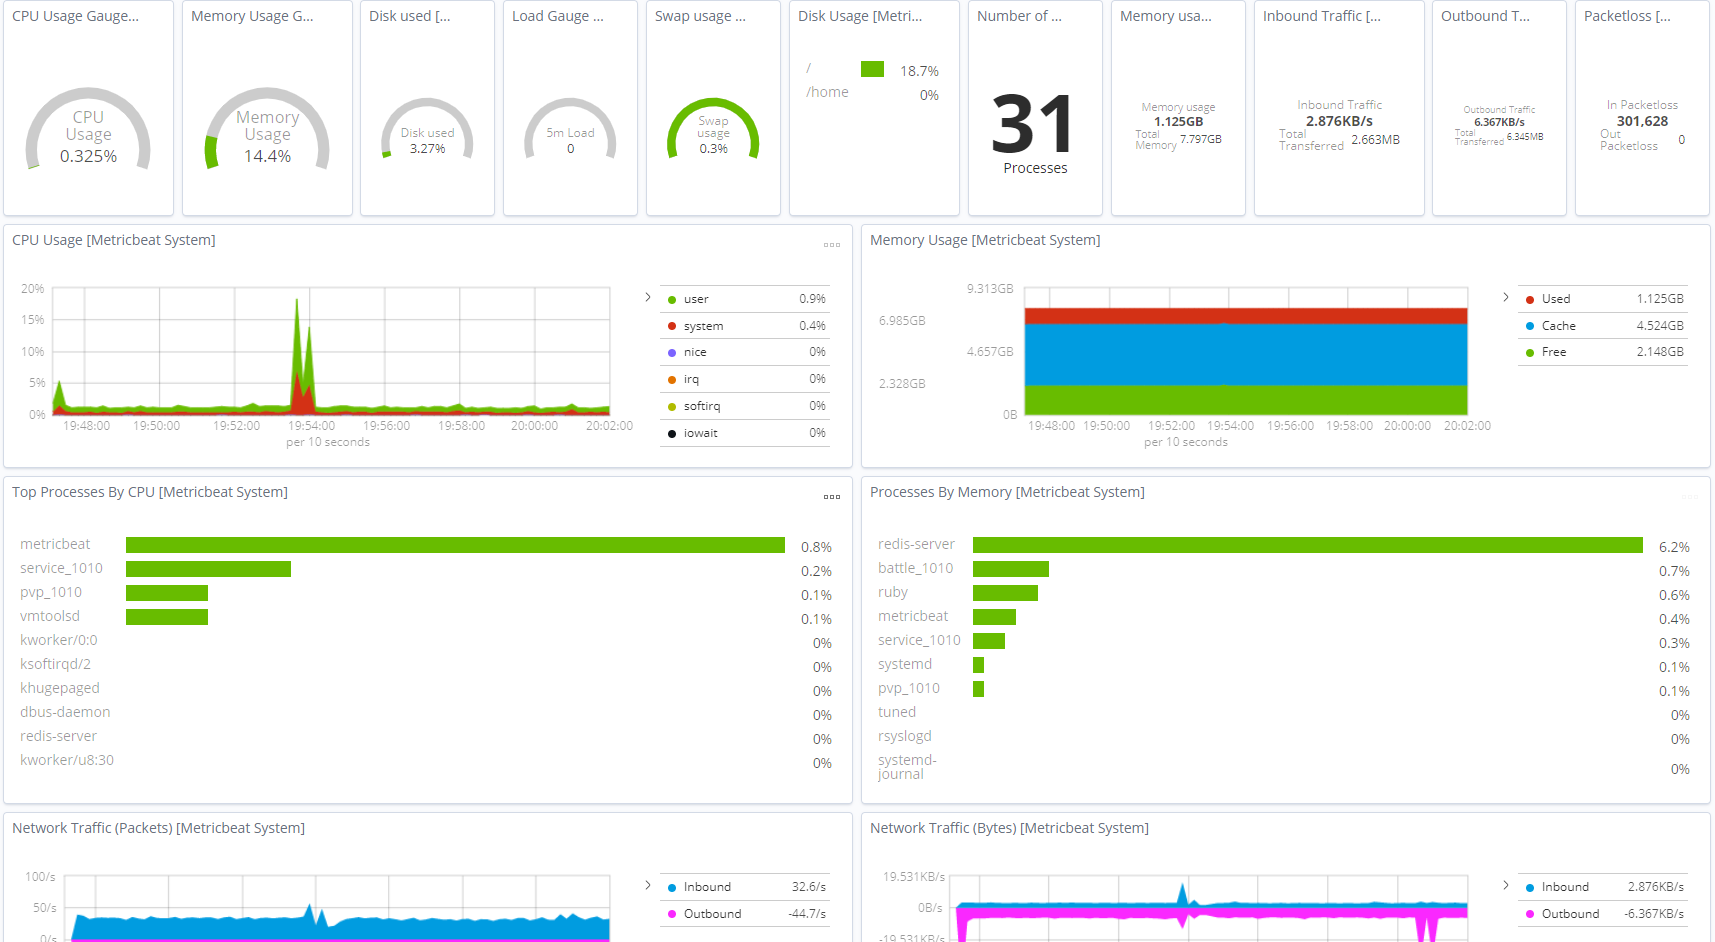
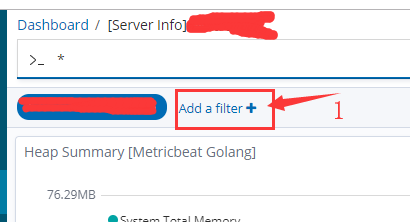
0x5 效果图
回到Kibana,进入Dashboard页,里面增加了一个Server Info的项,点进去看到如下效果就成了

0x6 区分多个golang应用程序
在步骤2里就要填metricbeat.yml里的name那个字段:server-1,当你开了多个metricbeat时就可以用不通的名字过滤。然后把这个模板clone一份再保存


 浙公网安备 33010602011771号