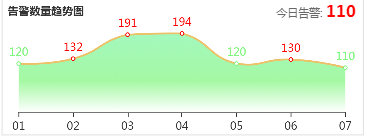
echarts折线图相关
optionJKDLine = {
  title: {
  text: '告警数量趋势图',
  textStyle:{  //标题样式
    fontStyle:'normal',
    fontFamily:'sans-serif',
    fontSize:12
    }
  },
  tooltip: {trigger: 'axis'},
  legend: {  //图例,默认显示
  },
  grid: {  //图表距离
    left: '-3%',
    right: '5%',
    bottom: '3%',
    top:'20%',
    containLabel: true
  },
  toolbox: {  //右侧工具栏
    feature: {
      saveAsImage: {}
    }
  },
  visualMap: {//区间内控制显示颜色 折线点的颜色变化
    show: false,
    dimension: 1,
    pieces: [
      {
        gte: 0, lte: 140, color: '#7EF57C' //表示0-140之间的数值,是这个#7EF57C颜色,大于这个140,则#ff0000颜色。
      }],
     outOfRange: {
      color: '#ff0000'
    }
  },
  xAxis: {
    type: 'category',
    boundaryGap: false,
    data: ['01', '02', '03', '04', '05', '06', '07']
  },
  yAxis: {
    type: 'value',
    show:false  //不显示Y轴
  },
  yAxis : [{  //显示Y轴,但不显示数值
    axisLabel : {
    formatter: function(){
      return "";
      }
    }
  }],
  series: [{
    name:'告警数量',
    type:'line',
    symbol: 'circle', // 拐点类型
    smooth: true, // 当为true时,就是光滑的曲线(默认为true)
     symbolSize: 3, // 拐点圆的大小
    data: [120, 132, 191, 194, 120, 130, 110],
    smooth: true,
    itemStyle : {
      normal : {
      label : {show: true},
      color:'#ED7967',// 折线条的颜色
      borderColor: '#0bb6db', // 拐点边框颜色
      lineStyle:{
        color:'#EDC167'
      }
  }],
  areaStyle: {  //折线图区域颜色线性渐变显示
    normal: {
    color: new echarts.graphic.LinearGradient(0, 0, 0, 1,
       [
      {offset: 0, color: '#7CF5A2'},
      {offset: 0.6, color: '#7EF57C'},
      {offset: 1, color: '#fff'}]
        )
      }
    },
  ]
};
实现如下:


 浙公网安备 33010602011771号