react使用Echarts绘制高亮可点击选中的省市地图
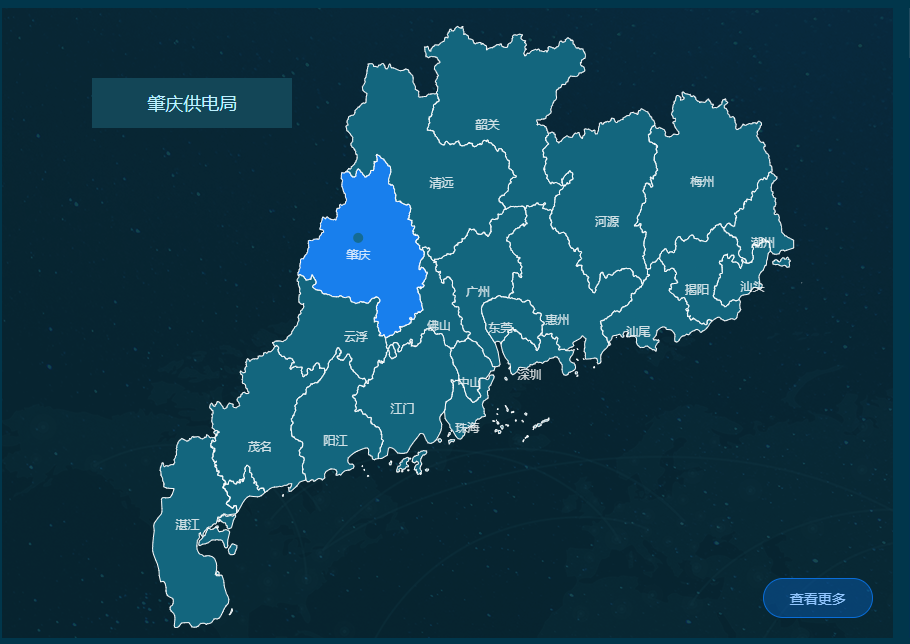
最近做项目遇到一个需求,需要显示广东省各个地级市的地图,并且鼠标移入高亮显示,鼠标点击可以选中某个地级市。在网上查阅了大量资料之后,最后选择了使用echarts实现该需求。在此记录一下,希望可以帮到有需求的小伙伴。本人初次使用,有不足之处希望大家可以指出,先看看效果图:
该需求主要有以下几个关键点:
首先我们需要初始化一个地图坐标系,可以在网上下载一个地图的json文件。
import GDJson from '../../../../statics/cdn/guangdong.json';

echarts.registerMap('GD', GDJson);
然后就是通过配置option绘制出具体的地图,此处我是通过绘制一个散点图,实现的各个地级市名字的显示,需要知道各个市的经纬度,这个可以在网上查到。然后通过dataRange设置了不同的value值所显示的颜色。具体配置如下所示:
var provienceData = [
      { name: '广州', type: 'areaCenterCity', value: 0, departId: '001021' },
      { name: '深圳', type: 'areaCenterCity', value: 0, departId: '001020' },
      { name: '佛山', type: 'areaCenterCity', value: 0, departId: '001004' },
      { name: '东莞', type: 'areaCenterCity', value: 0, departId: '001008' },
      { name: '中山', type: 'areaCenterCity', value: 0, departId: '001019' },
      { name: '珠海', type: 'areaCenterCity', value: 0, departId: '001011' },
      { name: '江门', type: 'areaCenterCity', value: 0, departId: '001015' },
      { name: '肇庆', type: 'areaCenterCity', value: 0, departId: '001005' },
      { name: '惠州', type: 'areaCenterCity', value: 0, departId: '001010' },
      { name: '汕头', type: 'areaCenterCity', value: 0, departId: '001007' },
      { name: '潮州', type: 'areaCenterCity', value: 0, departId: '001009' },
      { name: '揭阳', type: 'areaCenterCity', value: 0, departId: '001006' },
      { name: '汕尾', type: 'areaCenterCity', value: 0, departId: '001001' },
      { name: '湛江', type: 'areaCenterCity', value: 0, departId: '001018' },
      { name: '茂名', type: 'areaCenterCity', value: 0, departId: '001003' },
      { name: '阳江', type: 'areaCenterCity', value: 0, departId: '001016' },
      { name: '韶关', type: 'areaCenterCity', value: 0, departId: '001013' },
      { name: '清远', type: 'areaCenterCity', value: 0, departId: '001017' },
      { name: '云浮', type: 'areaCenterCity', value: 0, departId: '001002' },
      { name: '梅州', type: 'areaCenterCity', value: 0, departId: '001014' },
      { name: '河源', type: 'areaCenterCity', value: 0, departId: '001012' },
    ];
let option = {
      dataRange: {
        show: false,
        x: 'left',
        y: 'bottom',
        splitList: [
          { start: 0, end: 0, color: '#13667e' },//当值为5时,区域背景
          { start: 5, end: 5, color: '#187fed' },//当值为5时,区域背景
        ],
      },
      geo: {
        map: 'GD',
        roam: false,
        zoom: 0.94,
        tooltip: {
          show: false,       //不显示提示标签
        },
        center: [113.122717, 22.900762],
        label: {
          normal: {
            show: false,//显示省份标签
            textStyle: { color: "#333333" }//省份标签字体颜色
          },
          emphasis: {//对应的鼠标悬浮效果
            show: false,
            textStyle: { color: "#333333" }
          }
        },
        itemStyle: {
          normal: {
            borderWidth: 1,//区域边框宽度
            borderColor: '#ffffff',//区域边框颜色
            areaColor: "#fff",//区域颜色
            label: { show: false }
          },
          emphasis: {
            areaColor: "#187fed",
          }
        },
      },
      series: [
        {
          type: 'scatter',  //'line'(折线图) | 'bar'(柱状图) | 'scatter'(散点图) | 'k'(K线图)
          //'pie'(饼图) | 'radar'(雷达图) | 'chord'(和弦图) | 'force'(力导向布局图) | 'map'(地图)
          coordinateSystem: 'geo',
          data: this.convertData(provienceData),
          symbolSize: 10,
          symbolRotate: 40,
          geoIndex: 0,
          label: {
            normal: {
              formatter: '{b}',
              position: 'bottom',
              show: true,
              color: '#fff',
            },
            emphasis: {
              show: false
            }
          },
          tooltip: {
            show: false,       //不显示提示标签
            formatter: '{c}',      //提示标签格式
            backgroundColor: "#fff",//提示标签背景颜色
            borderColor: '#ccc',
            borderWidth: 5,
            textStyle: { color: "#ccc" } //提示标签字体颜色
          },
          itemStyle: {
            normal: {
              color: '#fff'
            }
          }
        },
        {
          type: 'map',
          mapType: 'GD',
          geoIndex: 0,
          roam: false,
          zoom: 0.94,
          center: [113.122717, 22.900762],
          tooltip: {
            show: false,       //不显示提示标签
          },
          label: {
            normal: {
              show: false    //显示省份标签
            },
            emphasis: {
              show: false,
            }
          },
          itemStyle: {
            //正常样式
            normal: {
              borderWidth: 1,      //区域边框宽度
              borderColor: '#ffffff',  //区域边框颜色
              areaColor: "#187fed",
            },
            //鼠标事件区块样式
            emphasis: {
              areaColor: "#187fed",
            }
          },
          data: provienceData
        }
      ],
    }
    myChart.setOption(option);
convertData(data) {
    const geoCoordMap = {
      '广州': [113.480637, 23.325178],
      '深圳': [114.085947, 22.597],
      '佛山': [113.022717, 23.028762],
      '东莞': [113.746262, 23.006237],
      '中山': [113.382391, 22.521113],
      '珠海': [113.353986, 22.124979],
      '江门': [112.594942, 22.290431],
      '肇庆': [112.072529, 23.651546],
      '惠州': [114.412599, 23.079404],
      '汕头': [116.708463, 23.37102],
      '潮州': [116.832301, 23.761701],
      '揭阳': [116.055733, 23.343778],
      '汕尾': [115.364238, 22.974485],
      '湛江': [110.064977, 21.274898],
      '茂名': [110.919229, 21.959751],
      '阳江': [111.805107, 22.009222],
      '韶关': [113.591544, 24.801322],
      '清远': [113.051227, 24.285022],
      '云浮': [112.044439, 22.929801],
      '梅州': [116.117582, 24.299112],
      '河源': [114.997802, 23.946266],
    }
    var res = [];
    for (var i = 0; i < data.length; i++) {
      var geoCoord = geoCoordMap[data[i].name];
      if (geoCoord) {
        res.push({
          name: data[i].name,
          value: geoCoord.concat(data[i].value),
          area: data[i].area,
          type: data[i].type,
        });
      }
    }
    return res;
  }
最后则是为地图添加点击事件,点击某个区域的时候,更改某个区域的value值,进而改变其颜色
myChart.on('click', function (params) {
      for (let i = 0; i < provienceData.length; i++) {
        provienceData[i].value = 0
        if (params.name === provienceData[i].name && _this.state.departName !== params.data.name) {
          provienceData[i].value = 5
        }
      }

     myChart.setOption(option);
});
最后来一波总体代码
import React from 'react'
import echarts from 'echarts';
import GDJson from '../../../../statics/cdn/guangdong.json';
componentDidMount() {
    this.initalECharts()
 }
// 初始化地图
  initalECharts() {
    if(!document.getElementById('map')){
      return
    }
    let _this = this
    var provienceData = [
      { name: '广州', type: 'areaCenterCity', value: 0, departId: '001021' },
      { name: '深圳', type: 'areaCenterCity', value: 0, departId: '001020' },
      { name: '佛山', type: 'areaCenterCity', value: 0, departId: '001004' },
      { name: '东莞', type: 'areaCenterCity', value: 0, departId: '001008' },
      { name: '中山', type: 'areaCenterCity', value: 0, departId: '001019' },
      { name: '珠海', type: 'areaCenterCity', value: 0, departId: '001011' },
      { name: '江门', type: 'areaCenterCity', value: 0, departId: '001015' },
      { name: '肇庆', type: 'areaCenterCity', value: 0, departId: '001005' },
      { name: '惠州', type: 'areaCenterCity', value: 0, departId: '001010' },
      { name: '汕头', type: 'areaCenterCity', value: 0, departId: '001007' },
      { name: '潮州', type: 'areaCenterCity', value: 0, departId: '001009' },
      { name: '揭阳', type: 'areaCenterCity', value: 0, departId: '001006' },
      { name: '汕尾', type: 'areaCenterCity', value: 0, departId: '001001' },
      { name: '湛江', type: 'areaCenterCity', value: 0, departId: '001018' },
      { name: '茂名', type: 'areaCenterCity', value: 0, departId: '001003' },
      { name: '阳江', type: 'areaCenterCity', value: 0, departId: '001016' },
      { name: '韶关', type: 'areaCenterCity', value: 0, departId: '001013' },
      { name: '清远', type: 'areaCenterCity', value: 0, departId: '001017' },
      { name: '云浮', type: 'areaCenterCity', value: 0, departId: '001002' },
      { name: '梅州', type: 'areaCenterCity', value: 0, departId: '001014' },
      { name: '河源', type: 'areaCenterCity', value: 0, departId: '001012' },
    ];
    echarts.registerMap('GD', GDJson);
    //初始化ECharts实例
    const myChart = echarts.init(document.getElementById('map'));
    let option = {
      dataRange: {
        show: false,
        x: 'left',
        y: 'bottom',
        splitList: [
          { start: 0, end: 0, color: '#13667e' },//当值为5时,区域背景
          { start: 5, end: 5, color: '#187fed' },//当值为5时,区域背景
        ],
      },
      geo: {
        map: 'GD',
        roam: false,
        zoom: 0.94,
        tooltip: {
          show: false,       //不显示提示标签
        },
        center: [113.122717, 22.900762],
        label: {
          normal: {
            show: false,//显示省份标签
            textStyle: { color: "#333333" }//省份标签字体颜色
          },
          emphasis: {//对应的鼠标悬浮效果
            show: false,
            textStyle: { color: "#333333" }
          }
        },
        itemStyle: {
          normal: {
            borderWidth: 1,//区域边框宽度
            borderColor: '#ffffff',//区域边框颜色
            areaColor: "#fff",//区域颜色
            label: { show: false }
          },
          emphasis: {
            areaColor: "#187fed",
          }
        },
      },
      series: [
        {
          type: 'scatter',  //'line'(折线图) | 'bar'(柱状图) | 'scatter'(散点图) | 'k'(K线图)
          //'pie'(饼图) | 'radar'(雷达图) | 'chord'(和弦图) | 'force'(力导向布局图) | 'map'(地图)
          coordinateSystem: 'geo',
          data: this.convertData(provienceData),
          symbolSize: 10,
          symbolRotate: 40,
          geoIndex: 0,
          label: {
            normal: {
              formatter: '{b}',
              position: 'bottom',
              show: true,
              color: '#fff',
            },
            emphasis: {
              show: false
            }
          },
          tooltip: {
            show: false,       //不显示提示标签
            formatter: '{c}',      //提示标签格式
            backgroundColor: "#fff",//提示标签背景颜色
            borderColor: '#ccc',
            borderWidth: 5,
            textStyle: { color: "#ccc" } //提示标签字体颜色
          },
          itemStyle: {
            normal: {
              color: '#fff'
            }
          }
        },
        {
          type: 'map',
          mapType: 'GD',
          geoIndex: 0,
          roam: false,
          zoom: 0.94,
          center: [113.122717, 22.900762],
          tooltip: {
            show: false,       //不显示提示标签
          },
          label: {
            normal: {
              show: false    //显示省份标签
            },
            emphasis: {
              show: false,
            }
          },
          itemStyle: {
            //正常样式
            normal: {
              borderWidth: 1,      //区域边框宽度
              borderColor: '#ffffff',  //区域边框颜色
              areaColor: "#187fed",
            },
            //鼠标事件区块样式
            emphasis: {
              areaColor: "#187fed",
            }
          },
          data: provienceData
        }
      ],
    }
    myChart.setOption(option);

    myChart.on('click', function (params) {
      for (let i = 0; i < provienceData.length; i++) {
        provienceData[i].value = 0
        if (params.name === provienceData[i].name && _this.state.departName !== params.data.name) {
          provienceData[i].value = 5
        }
      }
      if (_this.state.departName !== params.data.name) {
        _this.setState({ departName: params.data.name, departId: params.data.departId }, () => {
          _this.getData()
        })
      } else {
        _this.setState({ departName: '', departId: '' }, () => {
          _this.getData()
        })
      }
      myChart.setOption(option);
    });
    window.addEventListener('resize', () => {
      if (myChart && myChart.resize) {
        myChart.resize();
      }
    });

  }
  // 添加地图每个市的坐标
  convertData(data) {
    const geoCoordMap = {
      '广州': [113.480637, 23.325178],
      '深圳': [114.085947, 22.597],
      '佛山': [113.022717, 23.028762],
      '东莞': [113.746262, 23.006237],
      '中山': [113.382391, 22.521113],
      '珠海': [113.353986, 22.124979],
      '江门': [112.594942, 22.290431],
      '肇庆': [112.072529, 23.651546],
      '惠州': [114.412599, 23.079404],
      '汕头': [116.708463, 23.37102],
      '潮州': [116.832301, 23.761701],
      '揭阳': [116.055733, 23.343778],
      '汕尾': [115.364238, 22.974485],
      '湛江': [110.064977, 21.274898],
      '茂名': [110.919229, 21.959751],
      '阳江': [111.805107, 22.009222],
      '韶关': [113.591544, 24.801322],
      '清远': [113.051227, 24.285022],
      '云浮': [112.044439, 22.929801],
      '梅州': [116.117582, 24.299112],
      '河源': [114.997802, 23.946266],
    }
    var res = [];
    for (var i = 0; i < data.length; i++) {
      var geoCoord = geoCoordMap[data[i].name];
      if (geoCoord) {
        res.push({
          name: data[i].name,
          value: geoCoord.concat(data[i].value),
          area: data[i].area,
          type: data[i].type,
        });
      }
    }
    return res;
  }
render(){
  return(<div className={styles.map} id="map"></div>)
}
我是摸鱼君,你的【三连】就是摸鱼君创作的最大动力,如果本篇文章有任何错误和建议,欢迎大家留言!
文章持续更新,可以微信搜索 【码农爱摸鱼】关注公众号第一时间阅读。


 浙公网安备 33010602011771号