

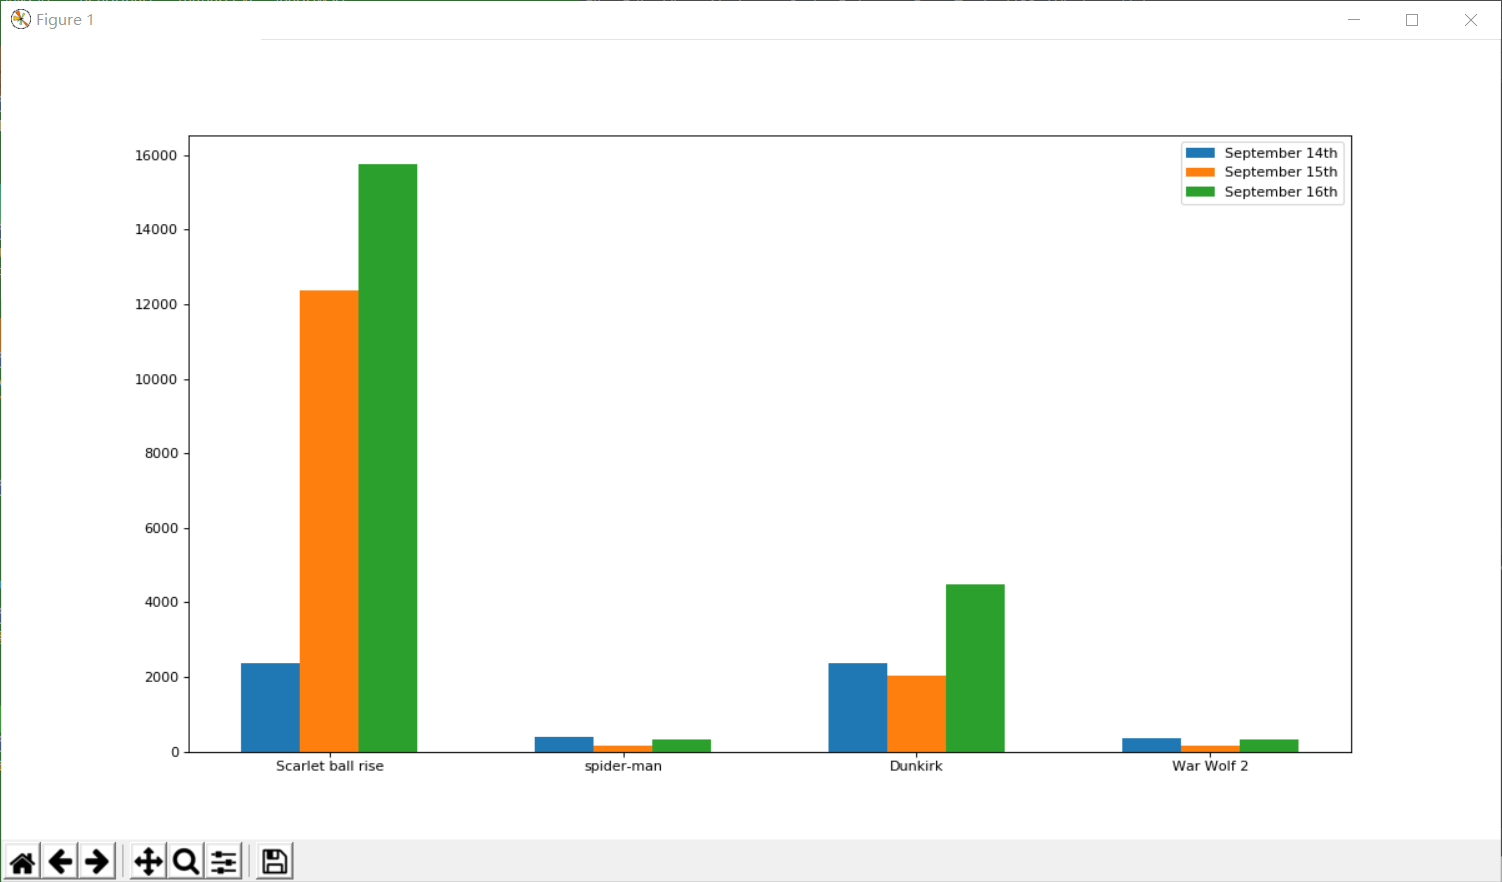
绘制条形图
# coding = utf - 8
from matplotlib import pyplot as plt

a = ["Scarlet ball rise", "spider-man", "Dunkirk", "War Wolf 2"]
b_16 = [15746, 312,4497,319]
b_15 = [12357,156,2045,168]
b_14 = [2358,399,2358,362]

bar_width = 0.2

x_14 = list(range(len(a)))
x_15 = [i + bar_width for i in x_14]
x_16 = [i + bar_width * 2 for i in x_14]

# 设置图形大小
plt.figure(figsize=(15, 8), dpi=80)

plt.bar(range(len(a)), b_14, width=bar_width, label = "September 14th")
plt.bar(x_15, b_15, width=bar_width, label = "September 15th")
plt.bar(x_16, b_16, width=bar_width, label = "September 16th")

# 设置x轴的刻度
plt.xticks(x_15, a)

# 设置图例
plt.legend()

plt.show()
# coding = utf - 8
from matplotlib import pyplot as plt
# a = ["战狼2", "速度与激情8", "功夫瑜伽", "西游伏妖篇", "变形金刚5", "摔跤吧爸爸"]
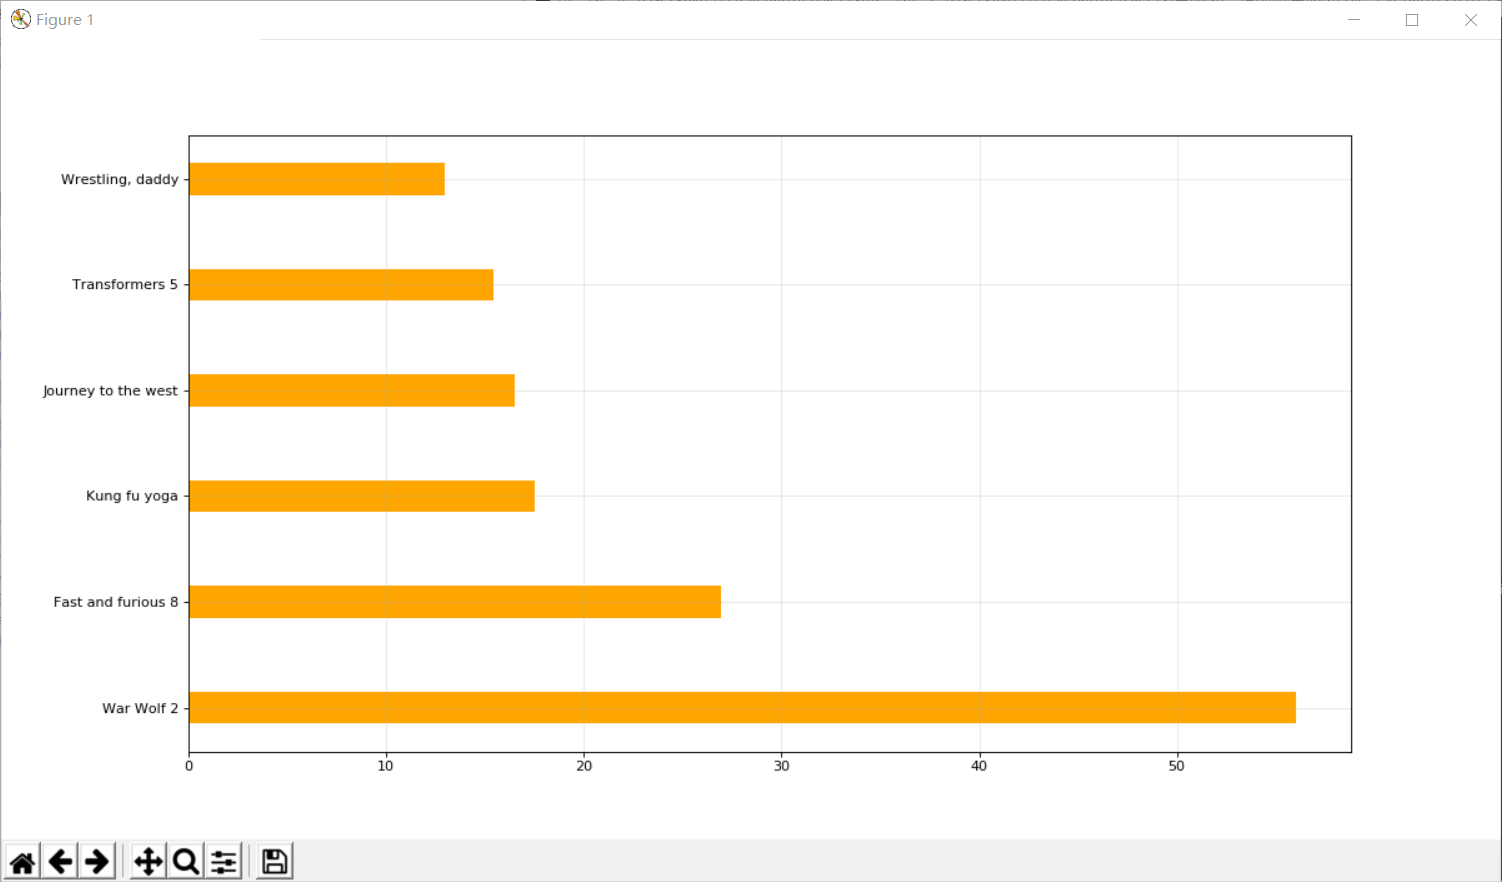
a = ["War Wolf 2", "Fast and furious 8", "Kung fu yoga", "Journey to the west", "Transformers 5", "Wrestling, daddy"]
b = [56.01,26.94,17.53,16.49,15.45,12.96]
# 设置图片大小
plt.figure(figsize=(15, 8), dpi=80)
# 绘制横向条形图
plt.barh(range(len(a)), b, height =0.3, color = "orange")
# 设置字符串到x轴
plt.yticks(range(len(a)), a)
# 绘制网格
plt.grid(alpha = 0.3)
plt.savefig("./movie.png")
plt.show()
# coding = utf - 8
from matplotlib import pyplot as plt
# a = ["战狼2", "速度与激情8", "功夫瑜伽", "西游伏妖篇", "变形金刚5", "摔跤吧爸爸"]
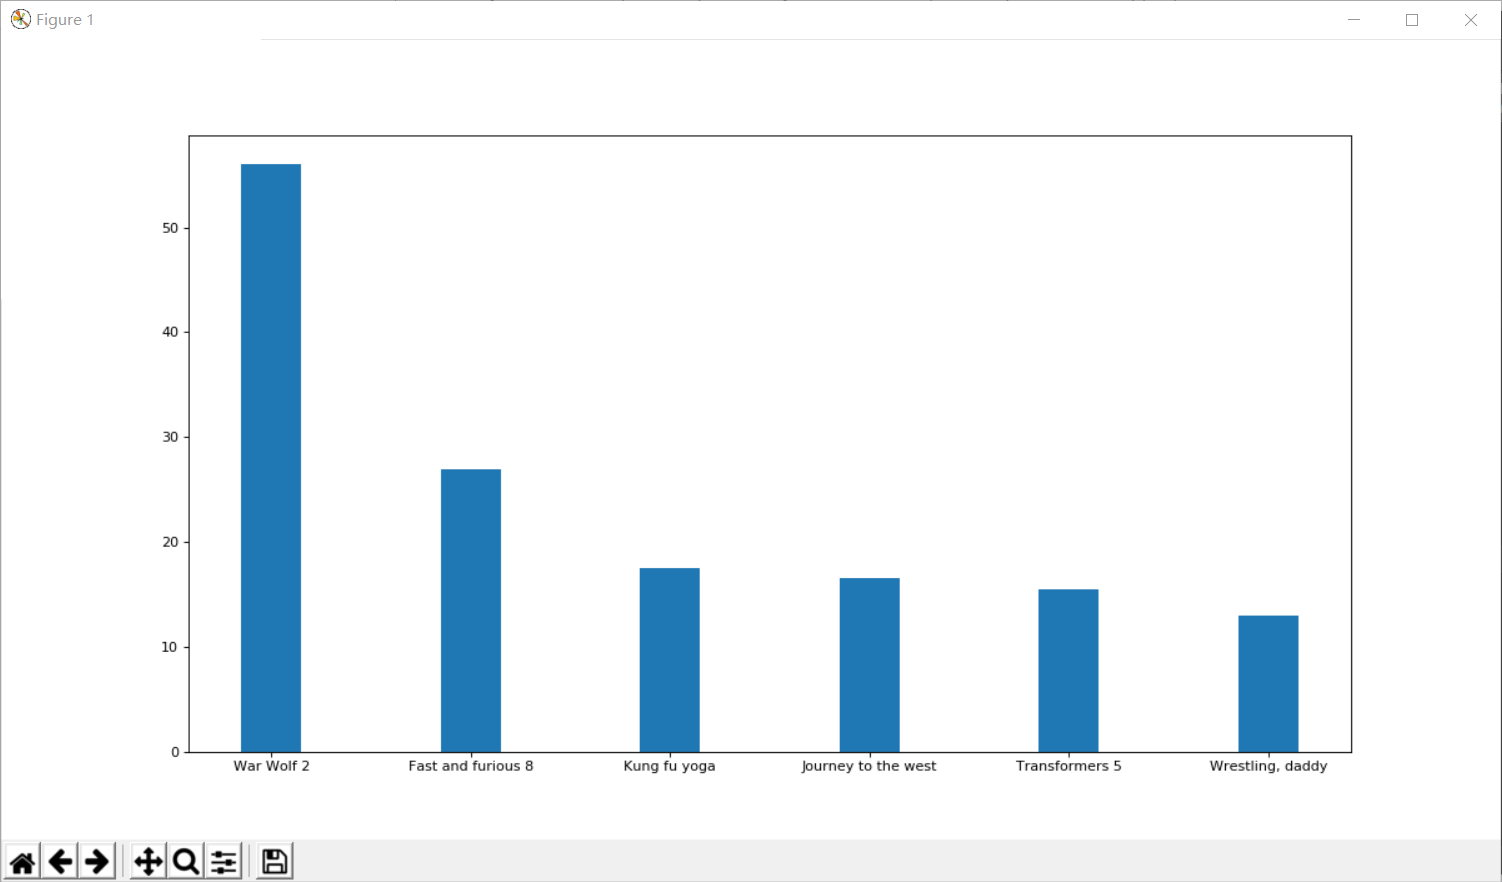
a = ["War Wolf 2", "Fast and furious 8", "Kung fu yoga", "Journey to the west", "Transformers 5", "Wrestling, daddy"]
b = [56.01,26.94,17.53,16.49,15.45,12.96]
# 设置图片大小
plt.figure(figsize=(15, 8), dpi=80)
# 绘制条形图
plt.bar(range(len(a)), b, width=0.3)
# 设置字符串到x轴
plt.xticks(range(len(a)), a)
plt.savefig("./movie.png")
plt.show()

 浙公网安备 33010602011771号