

OpenTelemetry安装和使用
- 环境查看
系统环境
# cat /etc/redhat-release
Rocky Linux release 9.3 (Blue Onyx)
# uname -a
Linux Rocky9Opentelemetry003078 5.14.0-362.18.1.el9_3.0.1.x86_64 #1 SMP PREEMPT_DYNAMIC Sun Feb 11 13:49:23 UTC 2024 x86_64 x86_64 x86_64 GNU/Linux
软件环境
# go version
go version go1.24.1 linux/amd64
# docker version
Client: Docker Engine - Community
 Version:           25.0.3
 API version:       1.44
 Go version:        go1.21.6
 Git commit:        4debf41
 Built:             Tue Feb  6 21:14:42 2024
 OS/Arch:           linux/amd64
 Context:           default

Server: Docker Engine - Community
 Engine:
  Version:          25.0.3
  API version:      1.44 (minimum version 1.24)
  Go version:       go1.21.6
  Git commit:       f417435
  Built:            Tue Feb  6 21:13:06 2024
  OS/Arch:          linux/amd64
  Experimental:     false
 containerd:
  Version:          1.6.28
  GitCommit:        ae07eda36dd25f8a1b98dfbf587313b99c0190bb
 runc:
  Version:          1.1.12
  GitCommit:        v1.1.12-0-g51d5e94
 docker-init:
  Version:          0.19.0
  GitCommit:        de40ad0
# docker-compose version
Docker Compose version v2.23.3
-
简介
OpenTelemetry 也被称为 OTel,是一个供应商中立的、开源的可观测性框架, 可用于插桩、生成、采集和导出链路、 指标和日志等遥测数据。
OpenTelemetry 作为一个行业标准,得到了 40 多个可观测供应商的支持, 被许多代码库、服务和应用集成,被众多最终用户采用。
![image]()
-
安装
安装前提条件

- Docker或其他容器工具
- Go 1.20或更高版本
安装Go参考https://www.cnblogs.com/minseo/p/18778878 - GOBIN
设置GOBIN及go语言的可执行bin目录
# export GOBIN=${GOBIN:-$(go env GOPATH)/bin}
# echo $GOBIN
/root/go/bin
安装
下载镜像
# docker pull otel/opentelemetry-collector-contrib:0.122.0
安装遥测实用程序
# go install github.com/open-telemetry/opentelemetry-collector-contrib/cmd/telemetrygen@latest
该实用程序可以模拟客户端生成轨迹,指标和日志。
启动收集器
在端口4317(用于OTLP GRPC),4318(对于OTLP HTTP)和55679(ZPAGES)上
# docker run \
  -p 4317:4317 \
  -p 4318:4318 \
  -p 55679:55679 \
  otel/opentelemetry-collector-contrib:0.121.0 \
  2>&1 | tee collector-output.txt
在单独的终端窗口生成一些示例跟踪
# $GOBIN/telemetrygen traces --otlp-insecure --traces 3
在实用程序生成的输出中,您应该看到确认生成轨迹的确认:
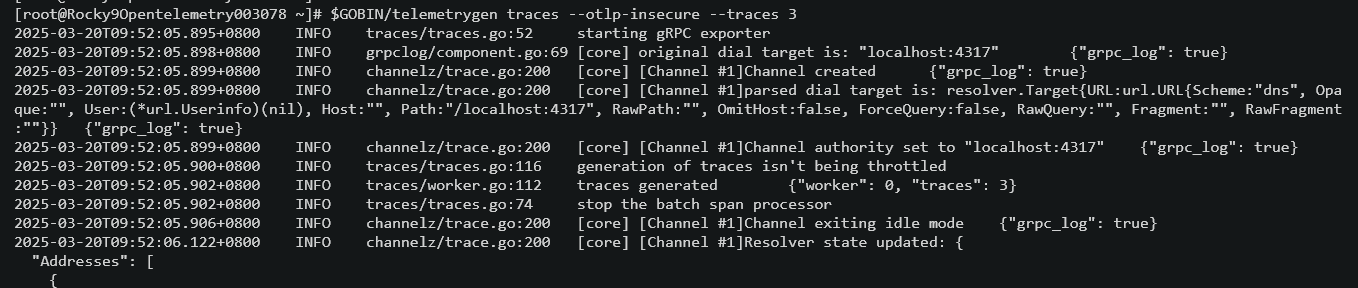
在运行收集器容器的终端窗口中,您应该看到跟踪摄入活动类似于以下示例中显示的内容:
打开http://ip:55679/debug/tracez
然后选择表中的样本之一,以查看您刚刚生成的痕迹

2025-08-19补充开始
下面以docker-compose.yml配置
# pwd
/root/opentelemetry
# cat docker-compose.yml
version: "3.9"
services:
otel-collector:
image: otel/opentelemetry-collector-contrib
volumes:
- ./otel-collector-config.yaml:/etc/otelcol-contrib/config.yaml
ports:
- 1888:1888 # pprof 扩展
- 8888:8888 # Collector 暴露的 Prometheus 指标
- 8889:8889 # Prometheus 导出器指标
- 13133:13133 # health_check 扩展
- 4317:4317 # OTLP gRPC 接收器
- 4318:4318 # OTLP HTTP 接收器
- 55679:55679 # zpages 扩展
restart: always
# 配置文件如下
# cat otel-collector-config.yaml
extensions:
health_check:
pprof:
endpoint: 0.0.0.0:1777
zpages:
endpoint: 0.0.0.0:55679
receivers:
otlp:
protocols:
grpc:
endpoint: 0.0.0.0:4317
http:
endpoint: 0.0.0.0:4318
prometheus:
config:
scrape_configs:
- job_name: 'otel-collector'
scrape_interval: 10s
static_configs:
- targets: ['0.0.0.0:8888']
jaeger:
protocols:
grpc:
endpoint: 0.0.0.0:14250
thrift_binary:
endpoint: 0.0.0.0:6832
thrift_compact:
endpoint: 0.0.0.0:6831
thrift_http:
endpoint: 0.0.0.0:14268
zipkin:
endpoint: 0.0.0.0:9411
processors:
batch:
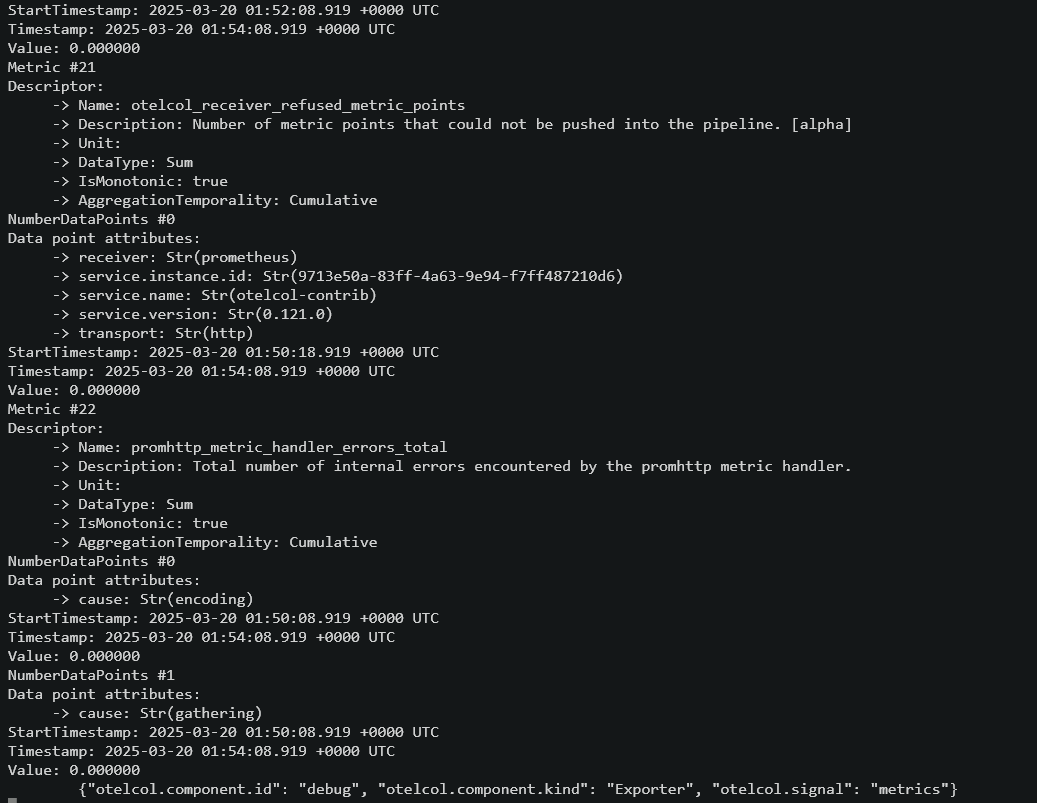
exporters:
debug:
verbosity: detailed
prometheus:
endpoint: "0.0.0.0:8889"
service:
pipelines:
traces:
receivers: [otlp, jaeger, zipkin]
processors: [batch]
exporters: [debug]
metrics:
receivers: [otlp, prometheus]
processors: [batch]
exporters: [debug, prometheus]
logs:
receivers: [otlp]
processors: [batch]
exporters: [debug]
extensions: [health_check, pprof, zpages]
启动
# docker-compose up -d
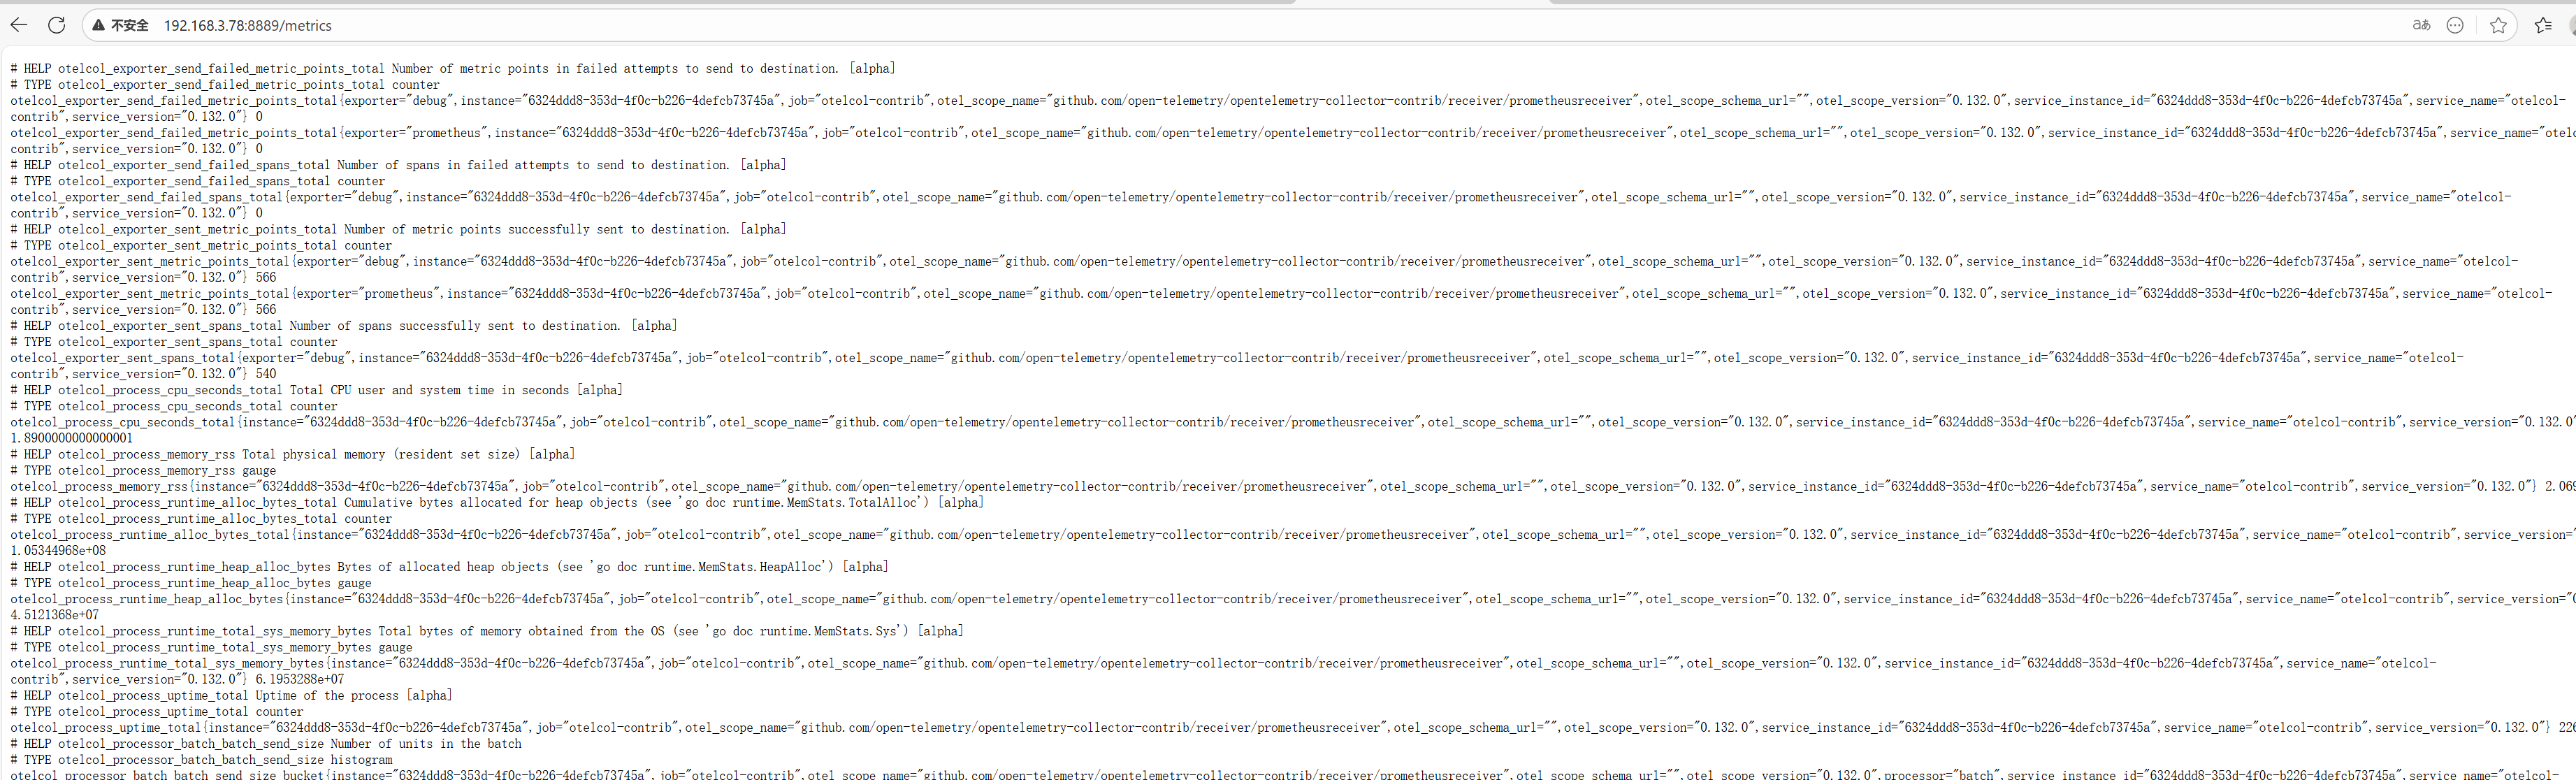
在Web页面查看是否暴露指标
http://192.168.3.78:8889/metrics
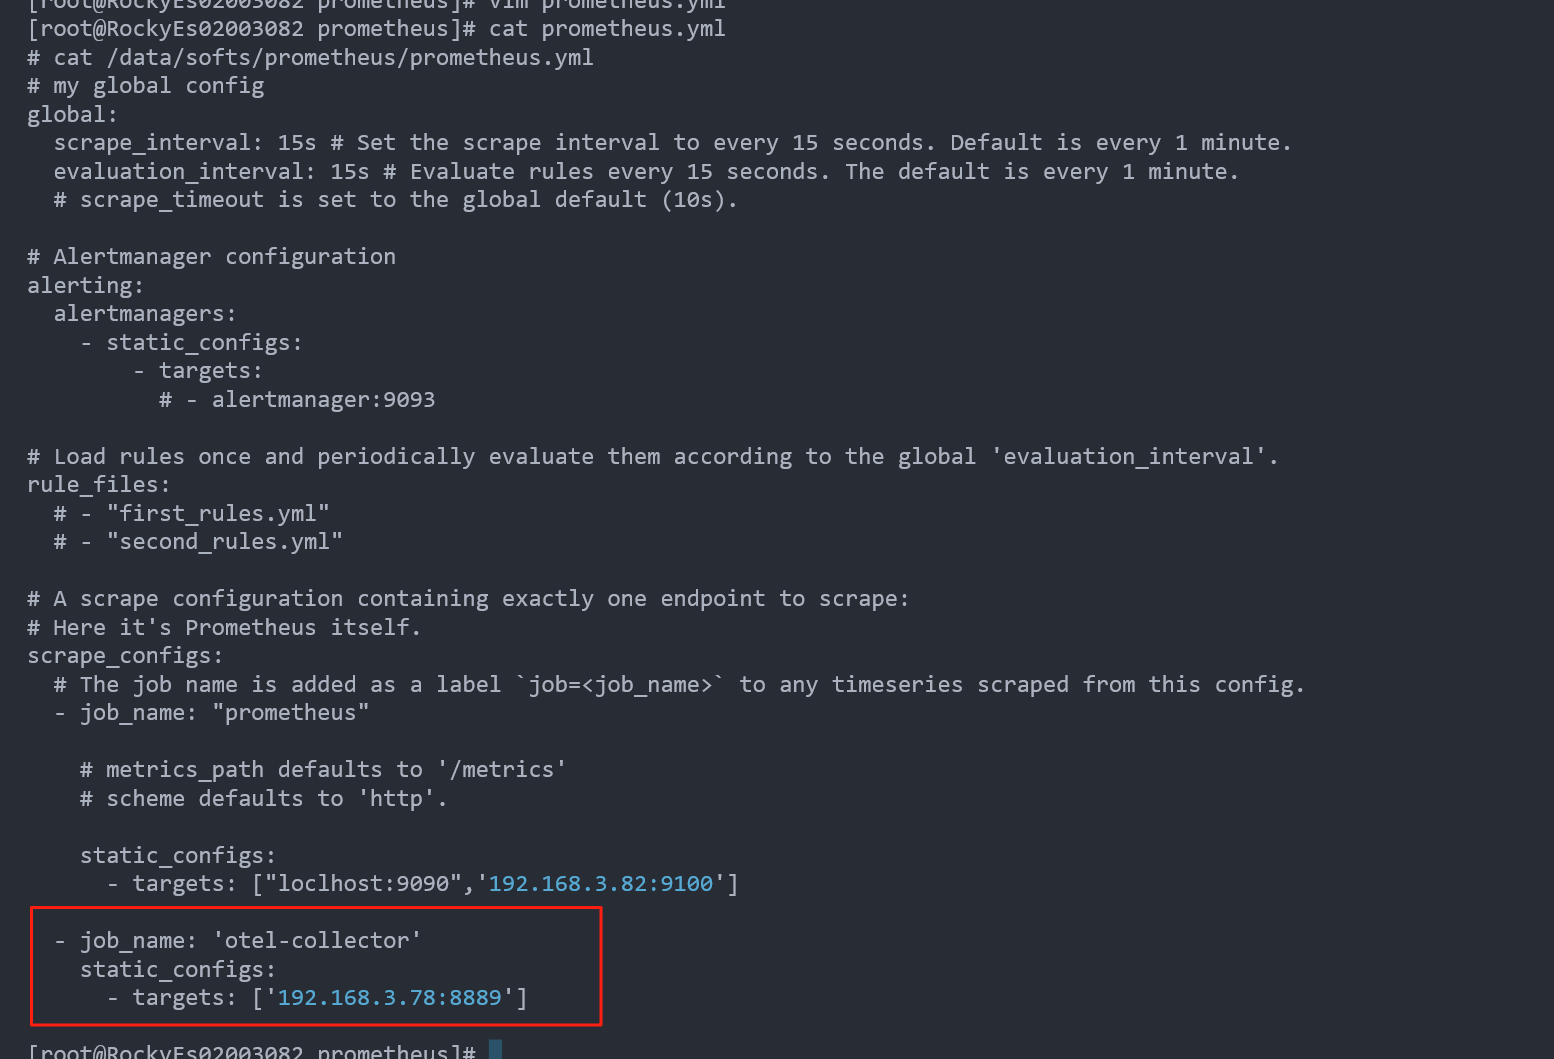
设置普罗米修斯收集数据
修改配置
# cat prometheus.yml
# cat /data/softs/prometheus/prometheus.yml
# my global config
global:
  scrape_interval: 15s # Set the scrape interval to every 15 seconds. Default is every 1 minute.
  evaluation_interval: 15s # Evaluate rules every 15 seconds. The default is every 1 minute.
  # scrape_timeout is set to the global default (10s).

# Alertmanager configuration
alerting:
  alertmanagers:
    - static_configs:
        - targets:
          # - alertmanager:9093

# Load rules once and periodically evaluate them according to the global 'evaluation_interval'.
rule_files:
  # - "first_rules.yml"
  # - "second_rules.yml"

# A scrape configuration containing exactly one endpoint to scrape:
# Here it's Prometheus itself.
scrape_configs:
  # The job name is added as a label `job=<job_name>` to any timeseries scraped from this config.
  - job_name: "prometheus"

    # metrics_path defaults to '/metrics'
    # scheme defaults to 'http'.

    static_configs:
      - targets: ["loclhost:9090",'192.168.3.82:9100']

  - job_name: 'otel-collector'
    static_configs:
      - targets: ['192.168.3.78:8889']
添加配置如下
在普罗米修斯web页面查看配置是否生效
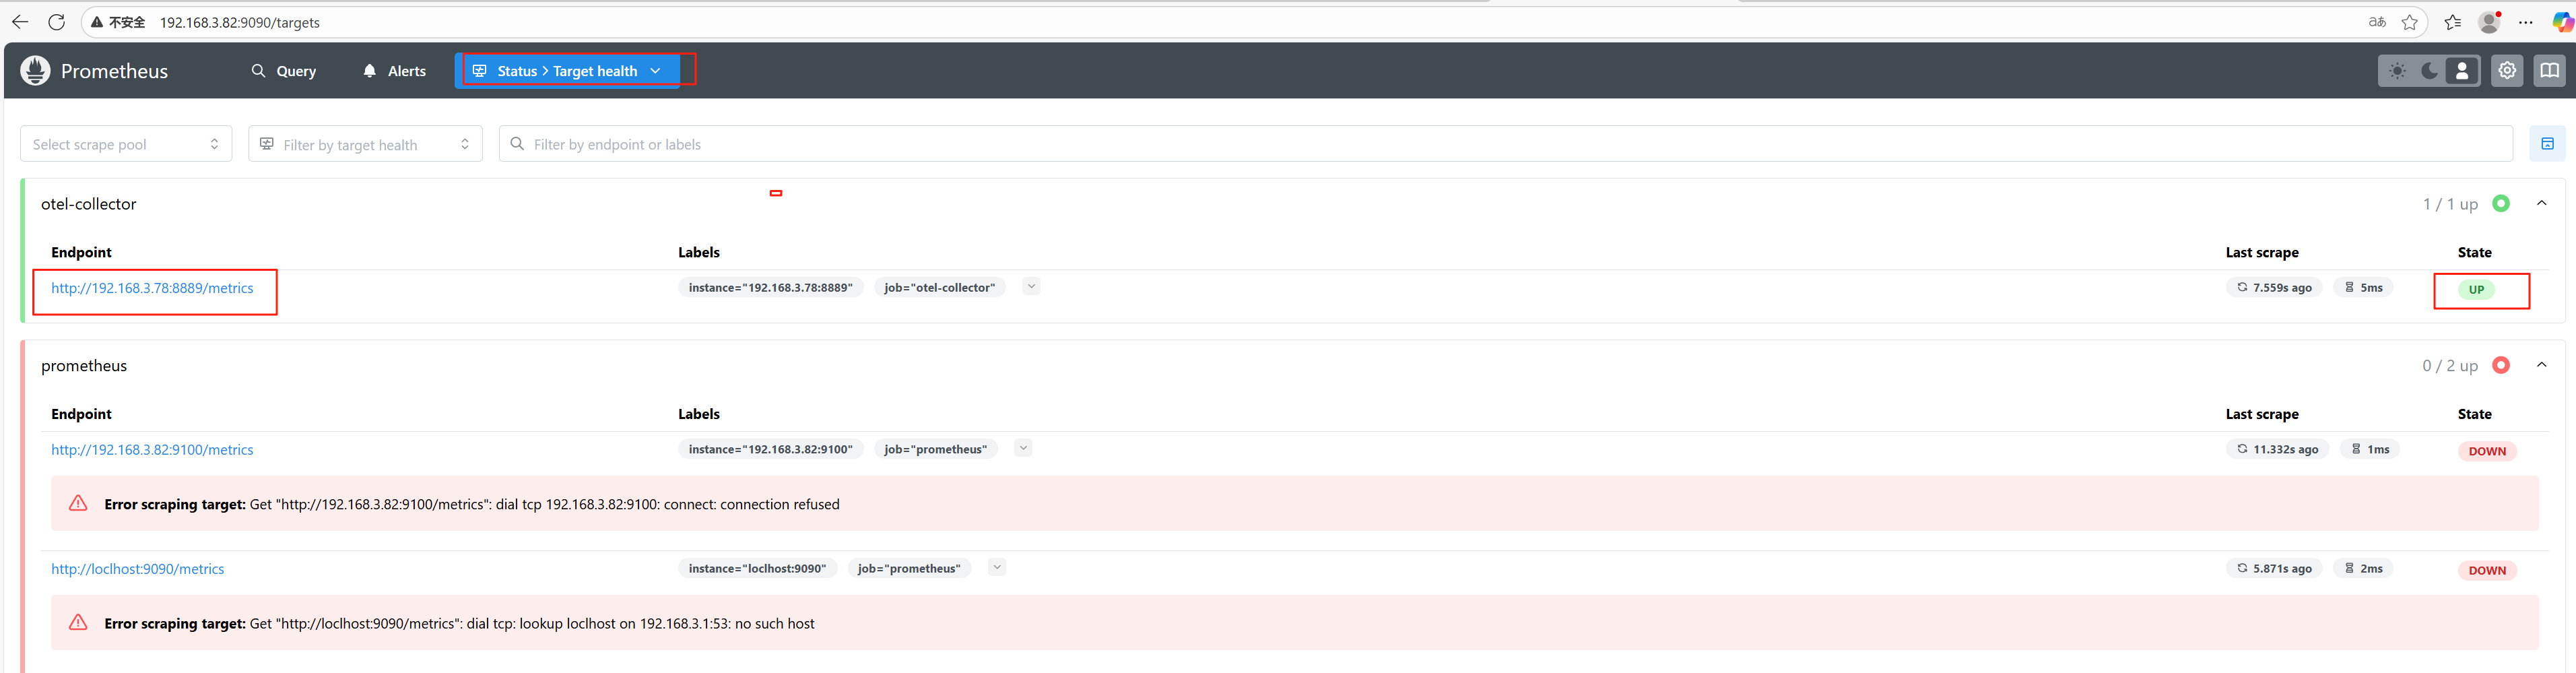
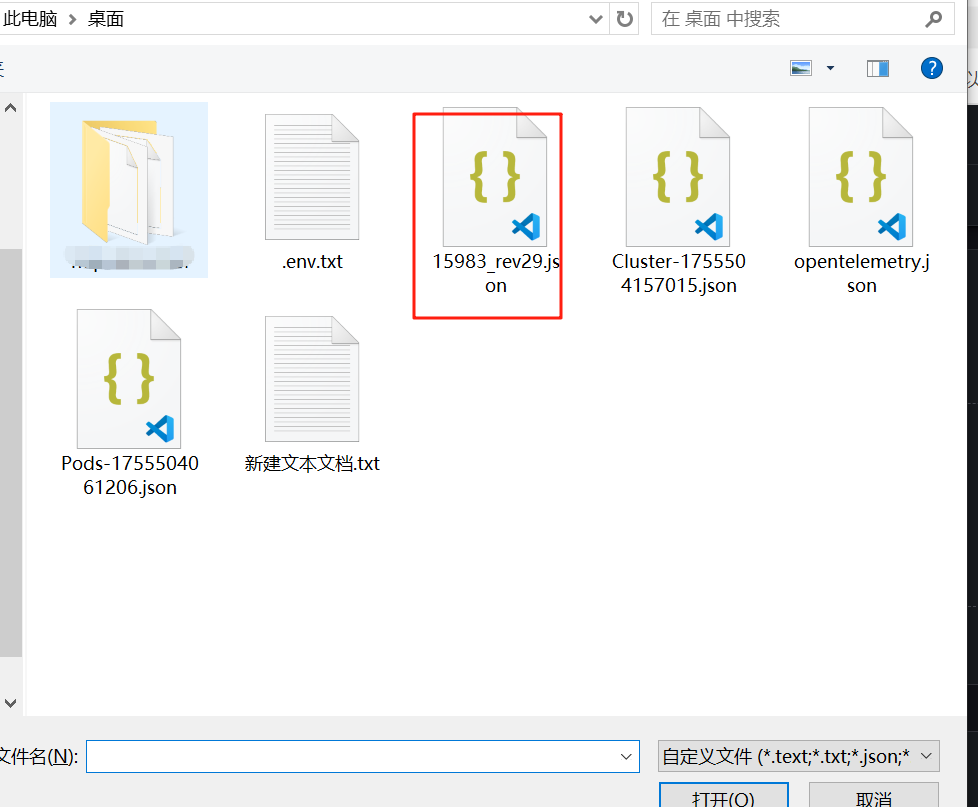
去grafana官网下载OpenTelemetry Collector模版
https://grafana.com/grafana/dashboards/15983-opentelemetry-collector/
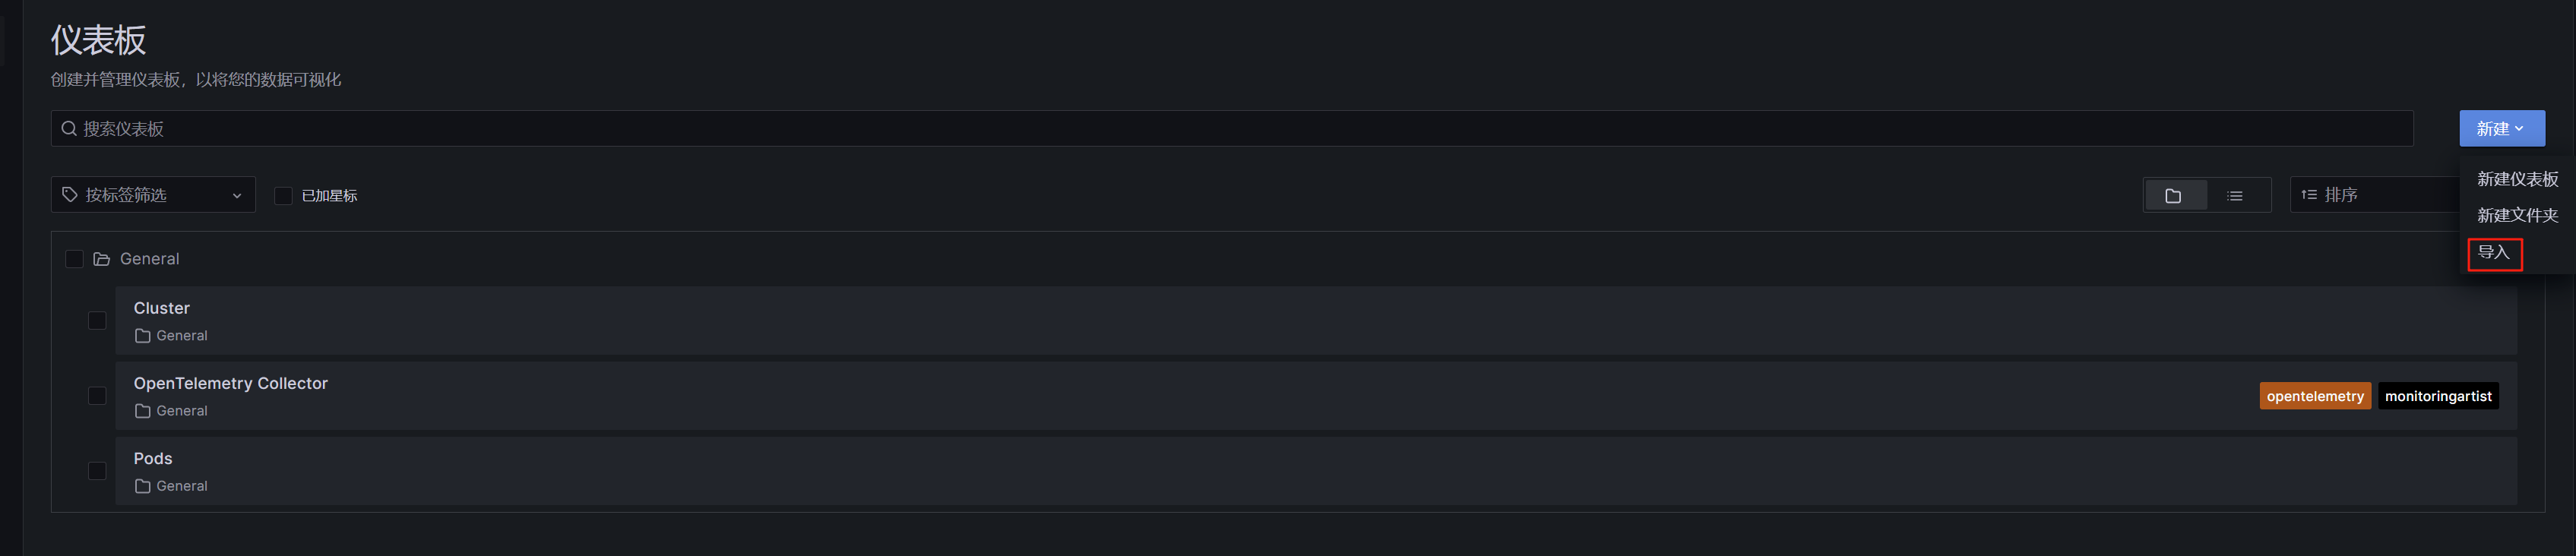
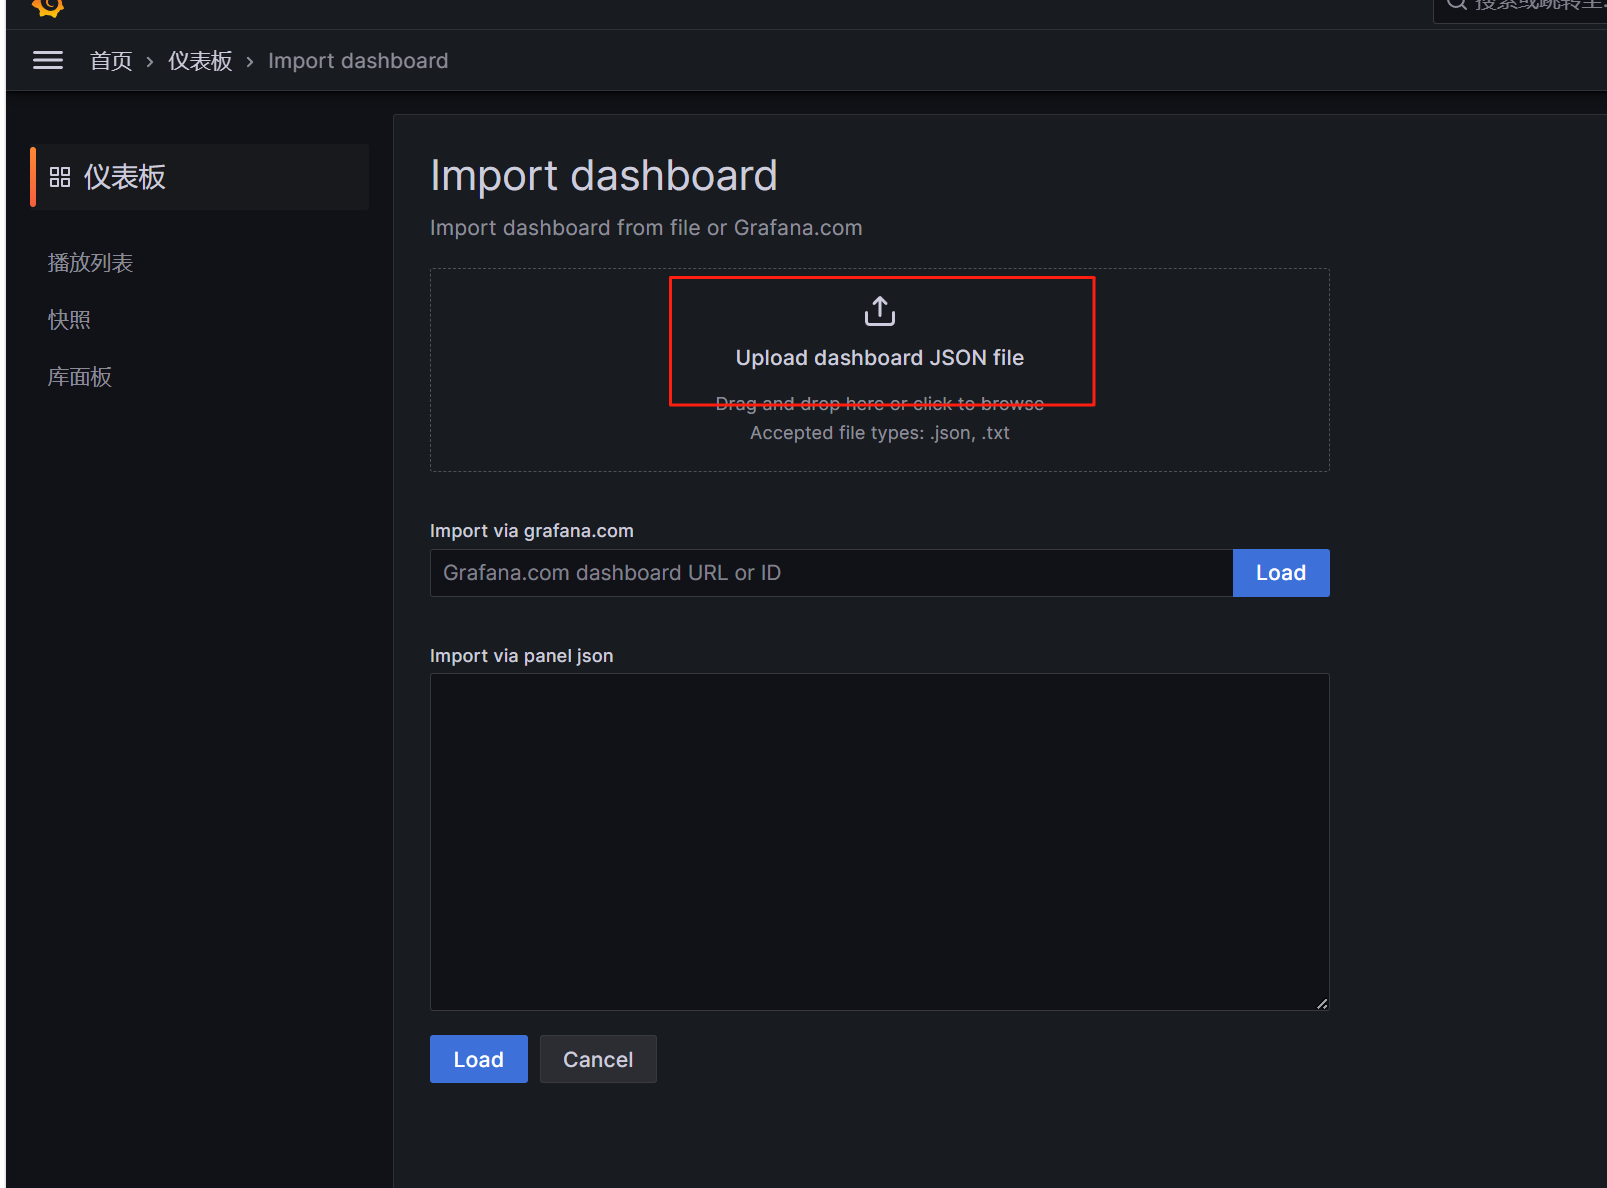
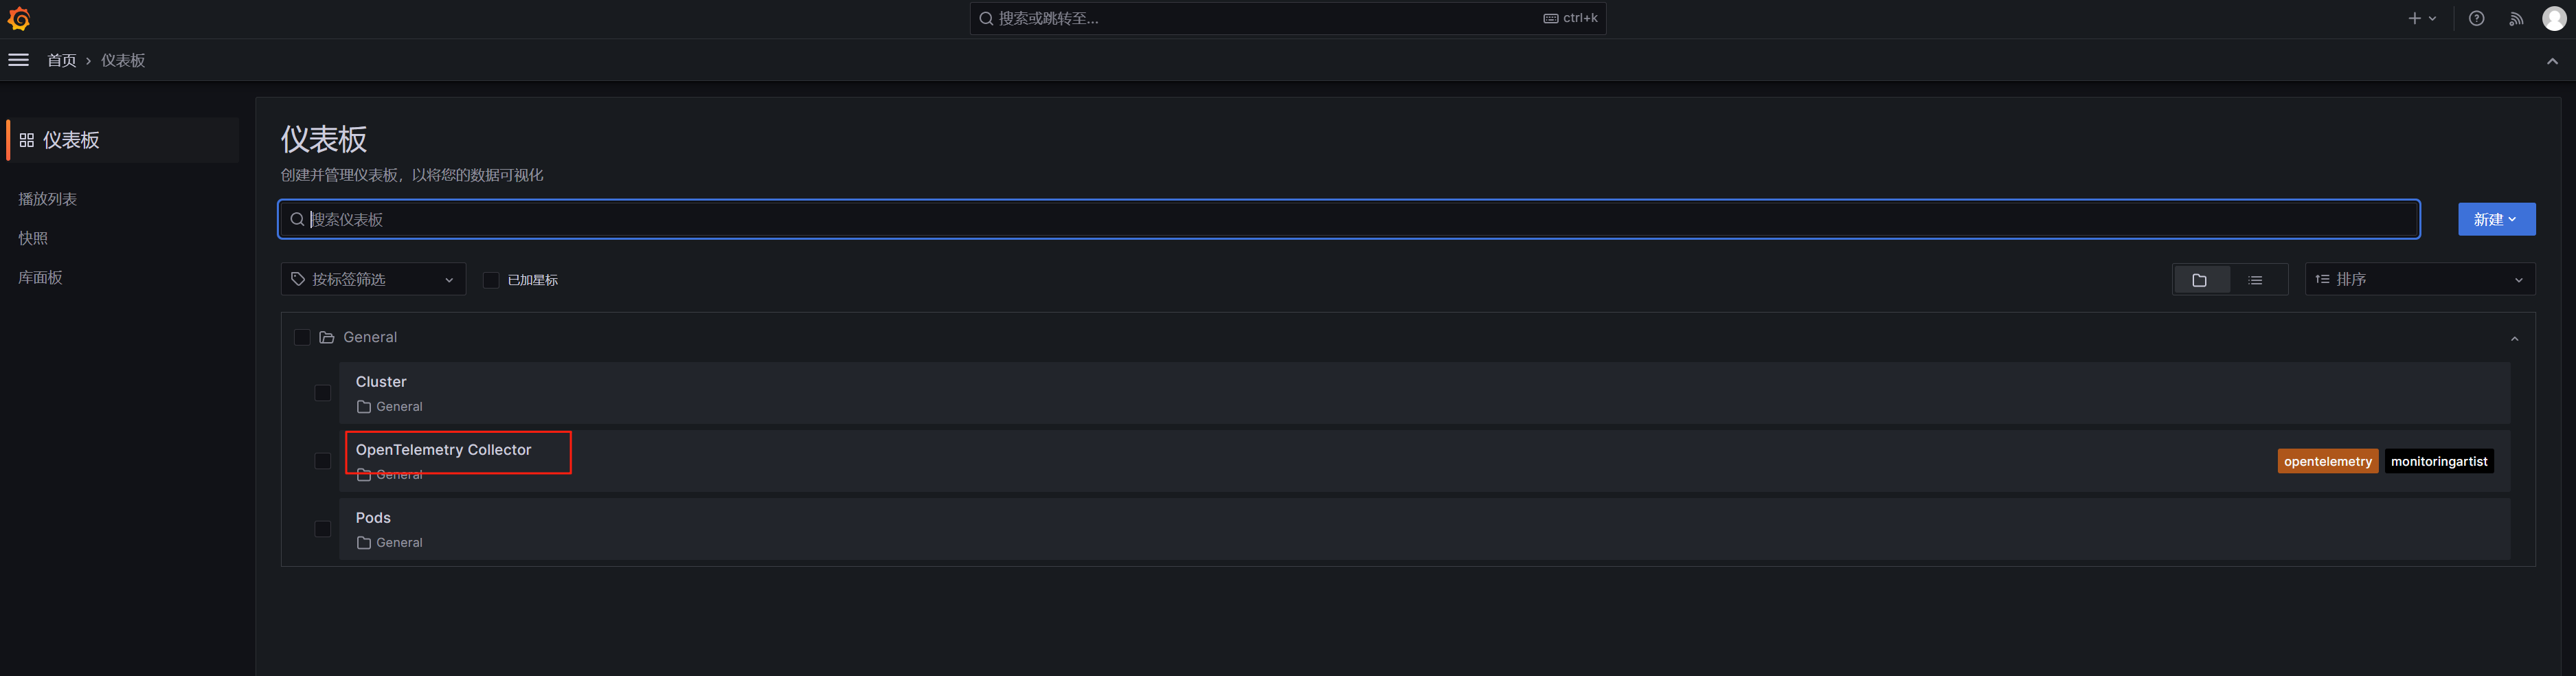
在grafana首页导入模版
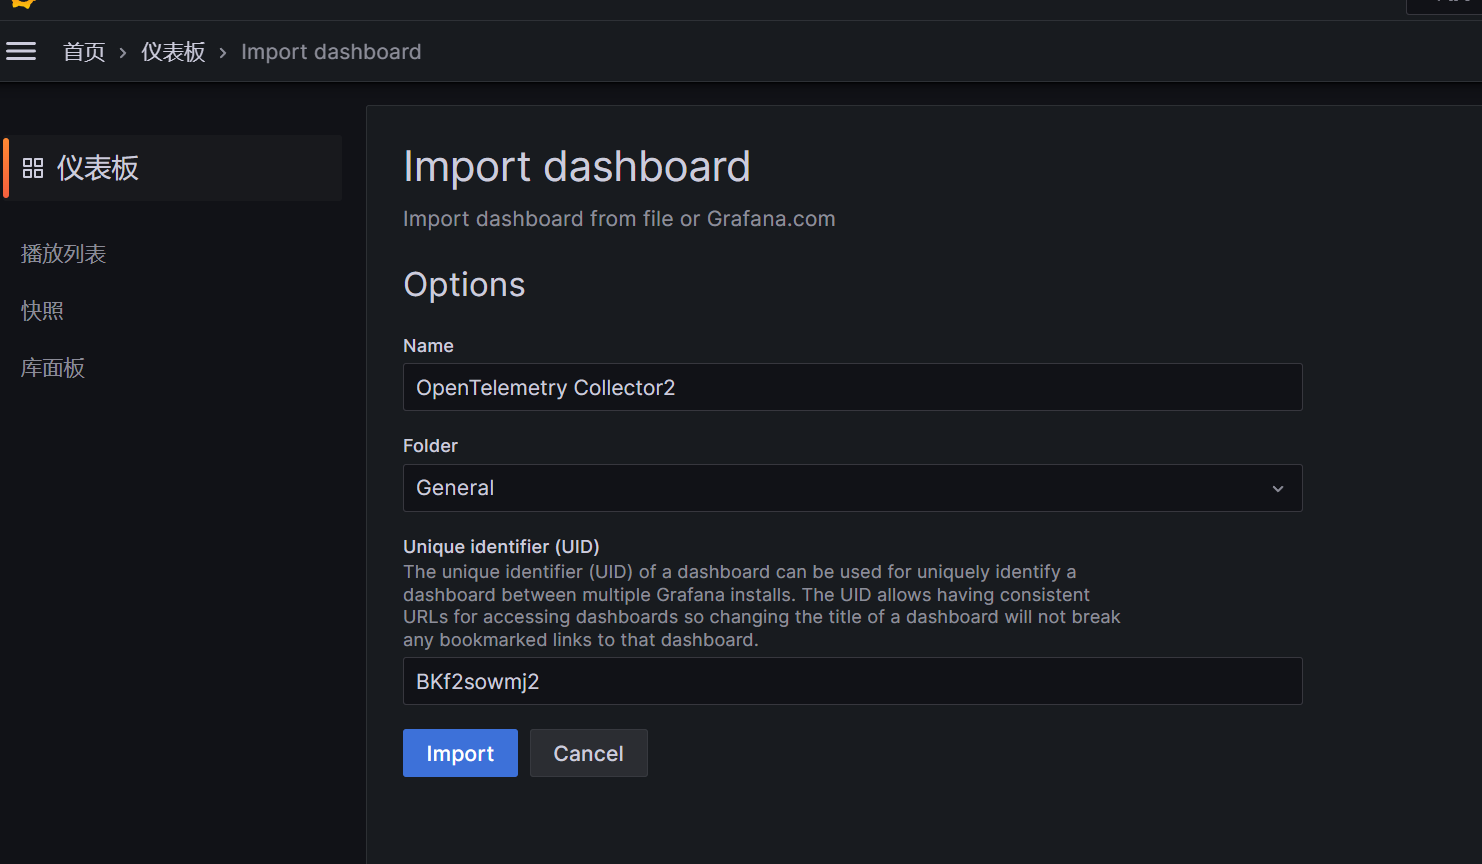
查看仪表盘
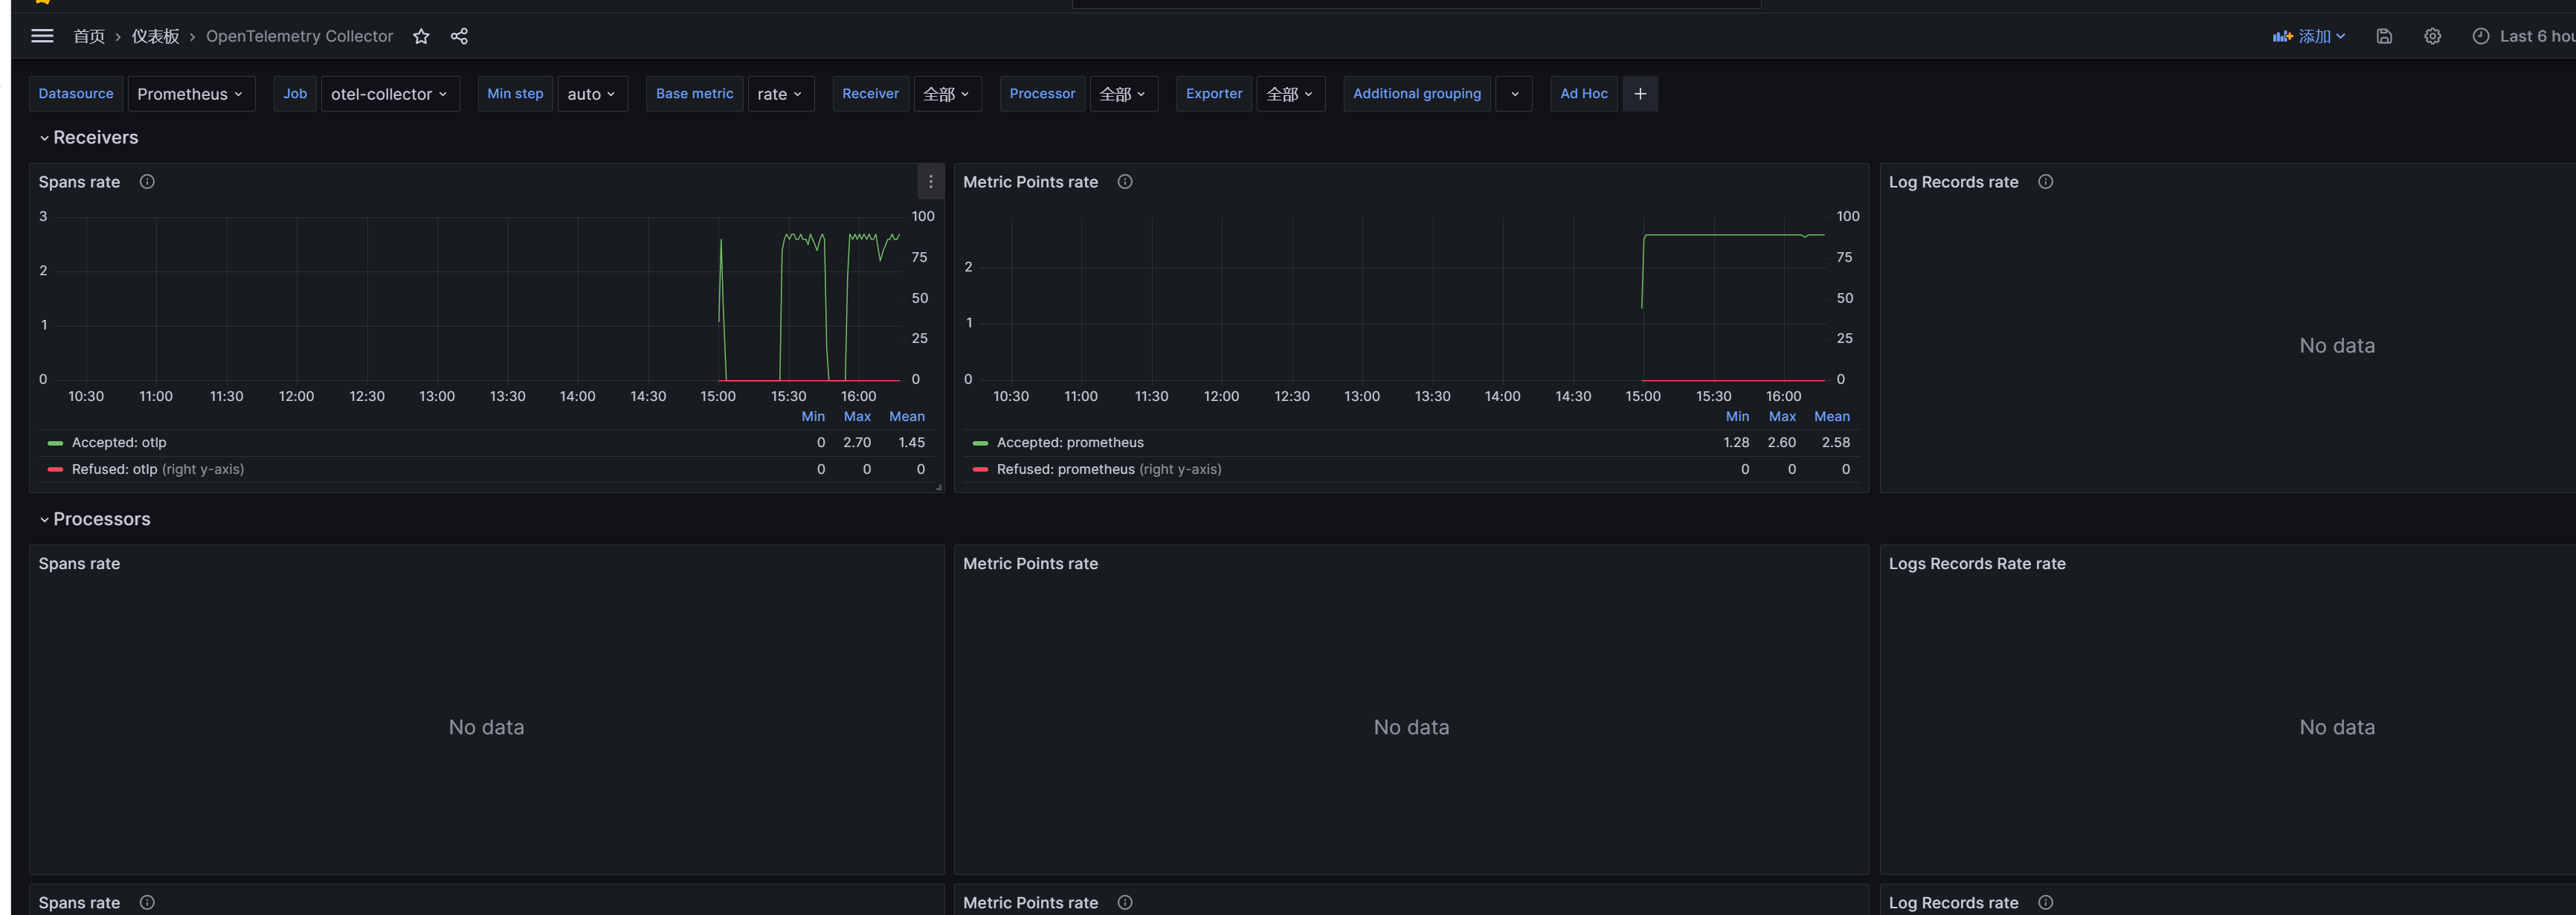
持续模拟发送数据
# for i in {1..5000};do telemetrygen traces --otlp-insecure --traces 3;sleep 2;done
2025-08-19补充结束

 浙公网安备 33010602011771号