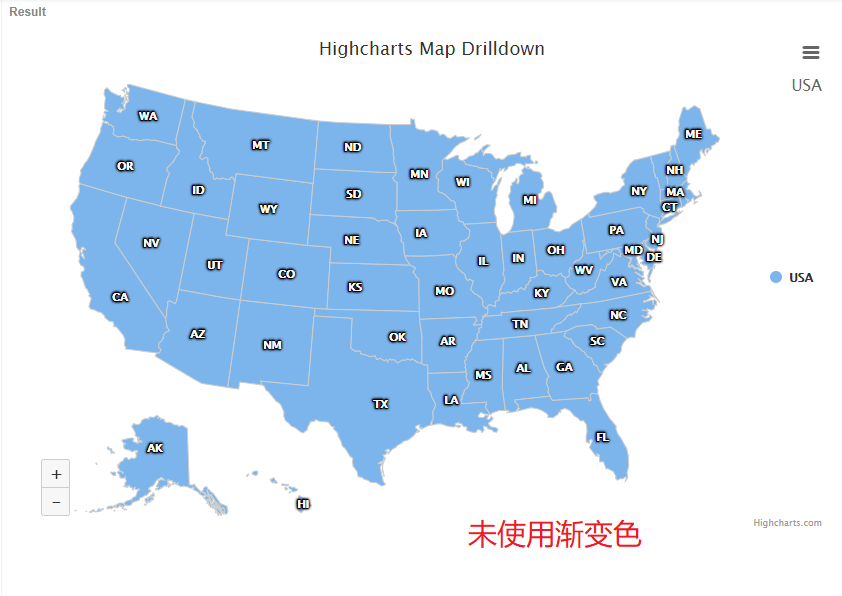
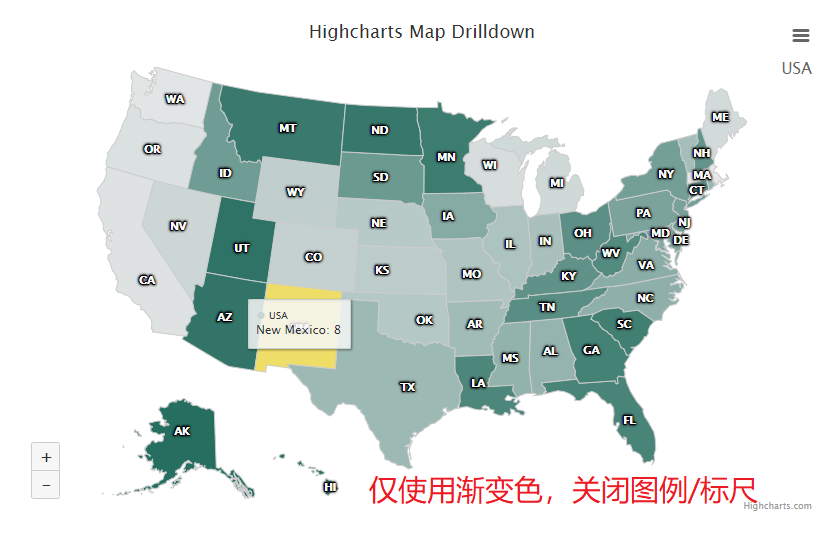
HighChartsmap 地图 按数据使用渐变颜色以及标尺、图例的取消

![]()
js部分
/*
TODO:
- Check data labels after drilling. Label rank? New positions?
- Not US Mainland text
- Separators
*/
var data = Highcharts.geojson(Highcharts.maps['countries/us/us-all']),
	container = document.getElementById('container'),
	// Some responsiveness
	small = container.clientWidth < 400;
// Set drilldown pointers
Highcharts.each(data, function (d,i) {
	d.drilldown = d.properties['hc-key'];
	d.value = i; // Non-random bogus data
});
// Instanciate the map
Highcharts.mapChart(container, {
	chart : {
		events: {
			drilldown: function (e) {
				if (!e.seriesOptions) {
					var chart = this,
						mapKey = 'countries/us/' + e.point.drilldown + '-all',
						// Handle error, the timeout is cleared on success
						fail = setTimeout(function () {
							if (!Highcharts.maps[mapKey]) {
								chart.showLoading('<i class="icon-frown"></i> Failed loading ' + e.point.name);
								fail = setTimeout(function () {
									chart.hideLoading();
								}, 1000);
							}
						}, 3000);
					// Show the spinner
					chart.showLoading('<i class="icon-spinner icon-spin icon-3x"></i>'); // Font Awesome spinner
					// Load the drilldown map
					$.getScript('https://img.hcharts.cn/mapdata/' + mapKey + '.js', function () {
						data = Highcharts.geojson(Highcharts.maps[mapKey]);
						// Set a non-random bogus value
						$.each(data, function (i) {
							this.value = i;
						});
						// Hide loading and add series
						chart.hideLoading();
						clearTimeout(fail);
						chart.addSeriesAsDrilldown(e.point, {
							name: e.point.name,
							data: data,
							dataLabels: {
								enabled: true,
								format: '{point.name}'
							}
						});
					});
				}
				this.setTitle(null, { text: e.point.name });
			},
			drillup: function () {
				this.setTitle(null, { text: 'USA' });
			}
		}
	},
	title : {
		text : 'Highcharts Map Drilldown'
	},
	subtitle: {
		text: 'USA',
		floating: true,
		align: 'right',
		y: 50,
		style: {
			fontSize: '16px'
		}
	},
             //这里是图例部分 enabled可以控制图例的开启
	legend: small ? {} : {
		layout: 'vertical',
		align: 'right',
		verticalAlign: 'middle',
		enabled:true //false
	},
           //在这里定义渐变颜色
	colorAxis: {
		min: 0,
		minColor: '#E6E7E8',  //变化初始色
		maxColor: '#005645'   //变化结束色
	},
	mapNavigation: {
		enabled: true,
		buttonOptions: {
			verticalAlign: 'bottom'
		}
	},
	plotOptions: {
		map: {
			states: {
				hover: {
					color: '#EEDD66'
				}
			}
		}
	},
	series : [{
		data : data,
		name: 'USA',
		dataLabels: {
			enabled: true,
			format: '{point.properties.postal-code}'
		}
	}],
	drilldown: {
		//series: drilldownSeries,
		activeDataLabelStyle: {
			color: '#FFFFFF',
			textDecoration: 'none',
			textShadow: '0 0 3px #000000'
		},
		drillUpButton: {
			relativeTo: 'spacingBox',
			position: {
				x: 0,
				y: 60
			}
		}
	}
});
依赖资源
<!-- 所有地图数据详情见:https://img.hcharts.cn/mapdata/index.html -->
<script src="https://img.hcharts.cn/mapdata/countries/us/us-all.js"></script>
<link href="https://img.hcharts.cn/libs/font-awesome/css/font-awesome.css" rel="stylesheet">
<div id="container" style="height: 500px; min-width: 310px; max-width: 800px; margin: 0 auto"></div>
渐变色说明
渐变色在 colorAxis中定义 minColor: '#E6E7E8', minColor为变化初始色 maxColor: '#005645' maxColor为变化结束色 也可设置多种颜色过度
图例/标尺的开启/关闭legend中的 enabled属性 开:true 关false

 浙公网安备 33010602011771号