系统进程与线程
系统进程与线程
1.进程
进程通常被定义为程序执行时的一个实例,是任何多道程序设计的操作系统中的基本概念。在linux源码中,进程通常被称为"任务"。每个进程都在cpu虚拟内存中分配地址空间中运行,每个进程的地址空间是完全独立的,因为不同进程之间不会意识到其它进程的存在。两个进程如果想相互通信,则必须要借助内核来实现。
linux为多任务系统,表面上同时在运行多个进程,但是实际系统中同时只会遇到不超过cpu核心的进程,也就是一个cpu核心中只会运行一个进程。
因为不可能存在让某一个进程直接运行完成,所以内核将cpu的运行时间切割成很多时间片段,通过内核来进行调度,依次优先度对各个进程进行执行与切换,这个切换也就是系统中的cpu上下文切换(context switch),可以通过top命令来查看
2.线程
可以简单的理解为线程是cpu调试的最少单元。更为简单的可以理解成线程为同一个程序里面的多个函数同时运行,进程是线程集。
3.线程与进程的渊源
在传统进程模式中,进程的内涵可以分为两个方面:
a.调试、执行的基本单位
b.资源所有权
因为是两个独立的功能,所以现代操作系统就将其进行分裂
执行与调试的基本单位:thread(线程)
资源所有权:process(进程)
在这种模式之下,内核调试的基本单位是线程而非进程,进程只需要负责管理资源,这些资源则由同一进程下的线程共享。
线程出现之后,带来了以下便利:
a.创建、终止、切换thread的开销要比process小很多
b.由于地址空间共享,所以线程通信与进程通信高效很多
不过在linux中,内核使用task_struct这一数据结构代表传统意义上的进程、线程,而不是为二者分别定义数据结构(如大多数操作系统)
在linux中,无论进程还是线程,根本上都是通过clone一个已经存在的task(进程/线程)来实现的,两者的差别就在于clone时flags的传递,当共享地址空间设置时(clone_VM位),创建线程,当没设置时则创建进程。
在linus一封对线程与进程解释的信件中,有一段话很有意思
There is NO reason to think that "threads" and "processes" are separateentities. That's how it's traditionally done, but I personally think it's amajor mistake to think that way. The only reason to think that way ishistorical baggage.

Both threads and processes are really just one thing: a "context of execution". Trying to artificially distinguish different cases is justself-limiting.

A "context of execution", hereby called COE, is just the conglomerate of all the state of that COE. That state includes things like CPU state (registers etc), MMU state (page mappings), permission state (uid, gid) and various "communication states" (open files, signal handlers etc).

Traditionally, the difference between a "thread" and a "process" has beenmainly that a threads has CPU state (+ possibly some other minimal state),while all the other context comes from the process. However, that's just_one_ way of dividing up the total state of the COE, and there is nothingthat says that it's the right way to do it. Limiting yourself to that kind ofimage is just plain stupid.

The way Linux thinks about this (and the way I want things to work) is thatthere _is_ no such thing as a "process" or a "thread". There is only thetotality of the COE (called "task" by Linux). Different COE's can share partsof their context with each other, and one _subset_ of that sharing is thetraditional "thread"/"process" setup, but that should really be seen as ONLYa subset (it's an important subset, but that importance comes not fromdesign, but from standards: we obviusly want to run standards-conformingthreads programs on top of Linux too). In short: do NOT design around the thread/process way of thinking. The kernel should be designed around the COE way of thinking, and then the pthreads _library_ can export the limited pthreads interface to users who want to use that way of looking at COE's.
进程状态
因为程序并不是一次性运行,因为其被搁置等有不同的状态。所有状态有如下几种:
运行态:running(R),进程正在cpu上运行中。
就绪态:ready(R),进程处于准备运行状态,它被放置在一个运行队列中,等待系统分配 CPU 资源给它,只有在该状态的进程才可能在cpu上运行
睡眠态:其中包括两种状态
可中断:interruptable(S),即进程在休眠中,由于在等待某个事件的完成(或等待某个条件的形成或等待某个信号等),一般情况下,进程列表中绝大多数进程都处于该状态。
不可中断:uninterruptable(D),不可中断指的并不是CPU不响应外部硬件的中断,而是指进程不响应异步信号,无法用kill命令杀死,进程必须等待直到有中断发生。处于这个状态的进程通常需要等待某个资源,而且在等待过程中进程会忽略任何信号。
停止态:stopped(T),暂停于内存中,但不会被调试,除非手动启动之:stopped
僵死态:zombie(Z),也就是处于僵死状态。如果该子进程的父进程没有收到SIGCHLD信号,故未调用wait(如wait4、waitid)处理函数等待子进程结束,又没有显示忽略该信号,该子进程就一直保持僵死状态。只要父进程不退出,这个僵死的子进程就一直存在。
PID
系统中每个进程都由一个正整数来进行唯一标识描述,这个值就是叫pid。pid值是系统随机分配的,当进程结束之后,其pid也会回收。
当一个程序启动时,会向内核发送pid申请请求,如果系统发现其pid存在,则判定其为启动状态,则返回一个启动错误的信息,从而保证一个程序多次启动。
当然在linux中子进程并不是单独生成的,其都是依据其父进程来进行fork,因为进程之前会有资源共享,所以直接对父进程进行fork,在2000之后,linux引入新的system call,也就是clone(),通过clone来进行子进程的生成。
在centos6中的,所有的进程都是基于init进程来进行fork。使用pstree可以查看,init的id值就是1
[root@iZ2ze4pxwbsbyvwn8l6qxbZ ~]# pstree
init─┬─AliYunDun───13*[{AliYunDun}]
     ├─AliYunDunUpdate───3*[{AliYunDunUpdat}]
     ├─aliyun-service
     ├─atd
     ├─auditd───{auditd}
     ├─bundle─┬─3*[bundle───{bundle}]
     │        └─2*[{bundle}]
     ├─crond
     ├─freeswitch───30*[{freeswitch}]
     ├─httpd───8*[httpd]
     ├─master─┬─pickup
     │        └─qmgr
     ├─6*[mingetty]
     ├─mysqld_safe───mysqld───20*[{mysqld}]
     ├─ntpd
     ├─rsyslogd───3*[{rsyslogd}]
     ├─runsvdir─┬─runsv─┬─redis-server───2*[{redis-server}]
     │          │       └─svlogd
     以下略
而在centos7中,因为已经使用systemd取代了init
[root@iZ25e35hsefZ ~]# pstree
systemd─┬─AliYunDun───14*[{AliYunDun}]
        ├─AliYunDunUpdate───3*[{AliYunDunUpdate}]
        ├─agetty
        ├─aliyun-service
        ├─crond
        ├─dbus-daemon
        ├─iprdump
        ├─iprinit
        ├─iprupdate
        ├─lvmetad
        ├─mysqld_safe───mysqld───27*[{mysqld}]
        ├─nginx───4*[nginx]
        ├─nscd───7*[{nscd}]
        ├─ntpd
        ├─php-fpm───20*[php-fpm]
        ├─polkitd───5*[{polkitd}]
        ├─qpidd───5*[{qpidd}]
        ├─redis-server───2*[{redis-server}]
        ├─rsyslogd───2*[{rsyslogd}]
        ├─sshd─┬─2*[sshd───bash]
        │      ├─sshd───sshd───bash───mysql
        │      └─sshd───bash───pstree
        ├─systemd-journal
        ├─systemd-logind
        ├─systemd-udevd
        ├─vsftpd
        └─zabbix_agentd───5*[zabbix_agentd]
PPID
每个进程除了有pid值,还会有ppid值,也就是其父进程的id值,可以依据ps命令来查看ppid值
[root@iZ25b31bdp0Z ~]# ps ax -o user,pid,ppid,stat,command
USER       PID  PPID STAT COMMAND
root         1     0 Ss   /usr/lib/systemd/systemd --switched-root --system --deserialize 22
root       939     1 Ss+  /sbin/agetty --noclear tty1 linux
zabbix     952     1 S    /usr/sbin/zabbix_agentd -c /etc/zabbix/zabbix_agentd.conf
zabbix     960   952 S    /usr/sbin/zabbix_agentd: collector [idle 1 sec]
zabbix     961   952 S    /usr/sbin/zabbix_agentd: listener #1 [waiting for connection]
zabbix     962   952 S    /usr/sbin/zabbix_agentd: listener #2 [waiting for connection]
zabbix     963   952 S    /usr/sbin/zabbix_agentd: listener #3 [waiting for connection]
zabbix     964   952 S    /usr/sbin/zabbix_agentd: active checks #1 [idle 1 sec]
mysql     1013     1 Ss   /bin/sh /usr/bin/mysqld_safe --basedir=/usr
named     1194     1 Ssl  /usr/sbin/named -u named
以下略
进程管理查看工具
1.top
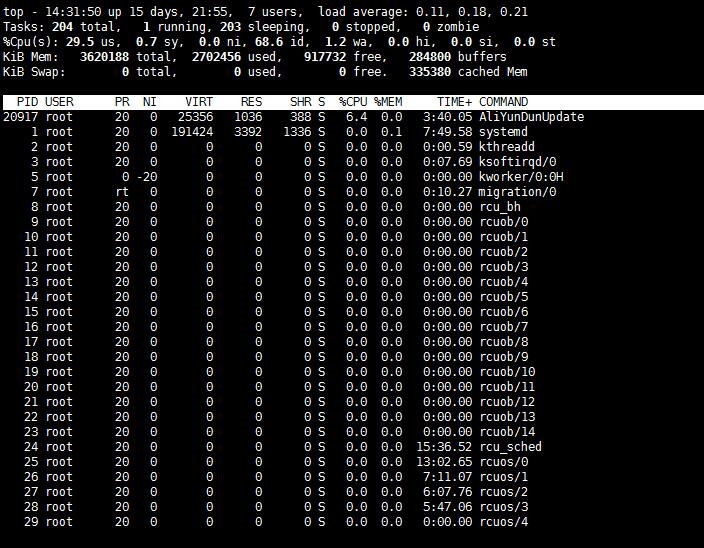
top命令是centos自带的命令,可以在其中查看cpu,mem的使用量及程序各个对的资源的占用量
top - 14:18:59 up 15 days, 21:42,  6 users,  load average: 0.02, 0.20, 0.22
Tasks: 201 total,   2 running, 199 sleeping,   0 stopped,   0 zombie
%Cpu(s):  0.3 us,  0.7 sy,  0.0 ni, 98.9 id,  0.1 wa,  0.0 hi,  0.0 si,  0.0 st
KiB Mem:   3620188 total,  2350684 used,  1269504 free,   219640 buffers
KiB Swap:        0 total,        0 used,        0 free.   117888 cached Mem

  PID USER      PR  NI    VIRT    RES    SHR S  %CPU %MEM     TIME+ COMMAND
 1473 mysql     20   0 3078344 437568   3456 S   0.0 12.1  29:10.51 mysqld
32658 git       20   0 1029176 400692   5812 S   0.7 11.1   6:15.10 .ruby.bin
 9923 nobody    20   0 2342904 116044  14608 S   0.0  3.2   8:00.54 httpd
 9767 nobody    20   0 2342900 115468  13132 S   0.0  3.2   5:59.61 httpd
 9770 nobody    20   0 2342900 113244  14828 S   0.0  3.1   6:53.30 httpd
 9768 nobody    20   0 2342900 113208  14068 S   0.0  3.1   6:19.60 httpd
 9766 nobody    20   0  731908  40760   2352 S   0.0  1.1   6:55.98 mysqld
32378 root      20   0  549580  36000  27588 S   0.0  1.0   0:02.09 httpd.bin
 1194 named     20   0  397144  28948   1820 S   0.0  0.8   0:29.86 named
32665 postgres  20   0  297784  20508   9212 S   0.0  0.6   0:20.15 postgres.bin
30570 rd        20   0  649288  20160   4440 S   0.0  0.6   0:00.13 php-fpm
30084 rd        20   0  648524  19716   4556 S   0.0  0.5   0:00.21 php-fpm
28940 rd        20   0  647368  19028   5068 S   0.0  0.5   0:00.41 php-fpm
28865 rd        20   0  646820  18576   5076 S   0.0  0.5   0:01.09 php-fpm
28533 rd        20   0  646788  18484   5068 S   0.0  0.5   0:01.07 php-fpm
进入top之后,比较多的有以下几个变量
单按M:程序使用内存量从高到低排列
单按C:程度使用cpu量从高到低
单按1:显示每颗cpu运行状态
相关变量解释为
PID:进程 ID
USER:运行进程的用户身份
PRI:进程的优先级
NI: 进程的 NICE 值,这个值从 -20 ~ 19,数值越小优先级越高
VIRT:进程的虚拟内存使用量
RES:进程的实际物理内存使用量
SHR:进程的内存中使用的共享内存映射的区域大小
S:进程的状态
CPU%:进程的 CPU 使用率
MEM%:进程的内存使用率
TIME+:进程占用 CPU 的累积时长
Command:进程的启动指令
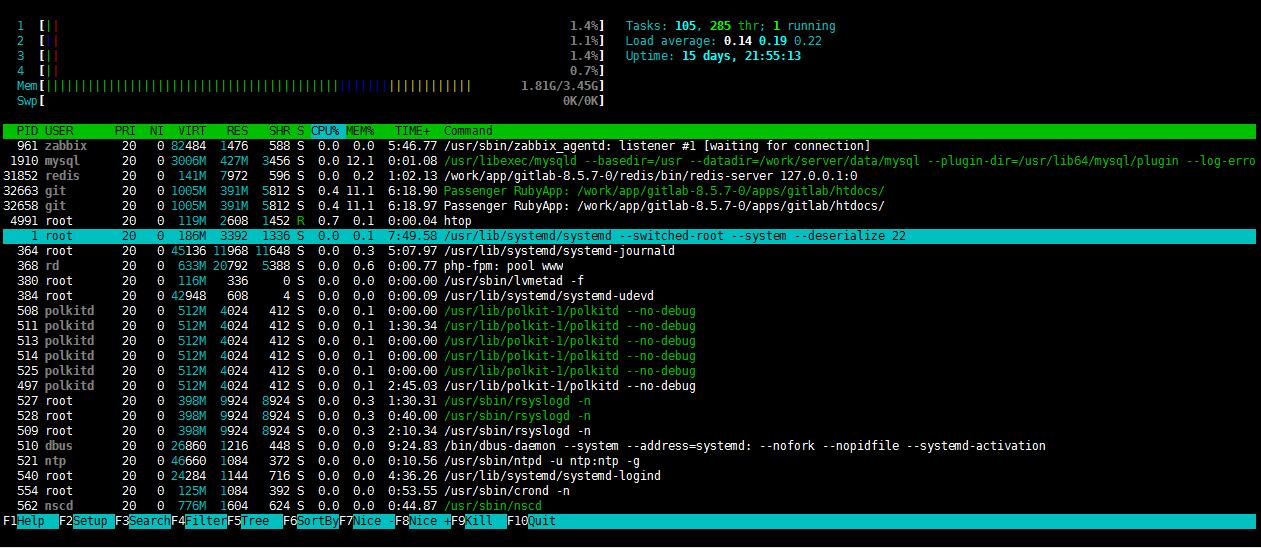
2.htop
htop是epel源中的一个程序,默认不会安装,其与top界面很类似,基本一样,只是在top的基础命令进行了相关的整合。
3.glances
glances与htop一样,也只存在于epel源中,系统并不会默认安装。glances为一款python开发的工具,除了top显示进程的相关信息及资源消耗之外,其还能显示磁盘、网络的状况
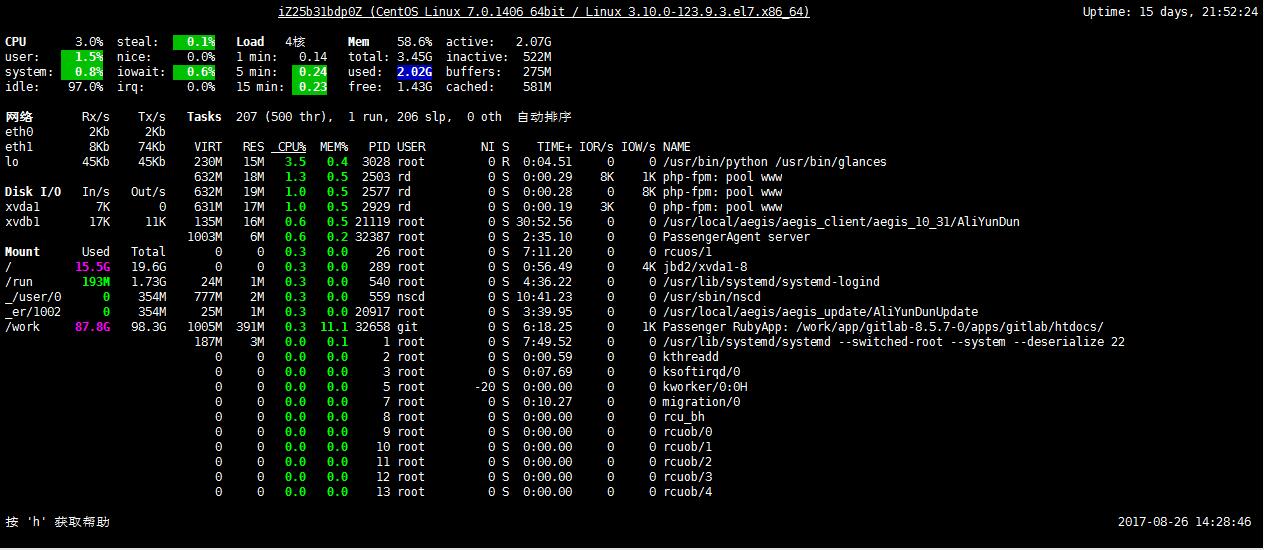
界面中相关的快捷键使用如下:
h:显示帮助信息
q:离开程序退出
c:按照 CPU 实时负载对系统进程进行排序
m:按照内存使用状况对系统进程排序
i:按照 I/O 使用状况对系统进程排序
p:按照进程名称排序
d:显示磁盘读写状况
w:删除日志文件
l:显示日志
s:显示传感器信息
f:显示系统信息
1:轮流显示每个 CPU 内核的使用情况(次选项仅仅使用在多核 CPU 系统)
u:显示网络接口的累积流量

 浙公网安备 33010602011771号