SPC(Statistical Process Control 统计过程控制)图——Python+JS实现
源码
https://github.com/carlosqsilva/pyspc
https://github.com/carlosqsilva/ccharts-online
相关知识
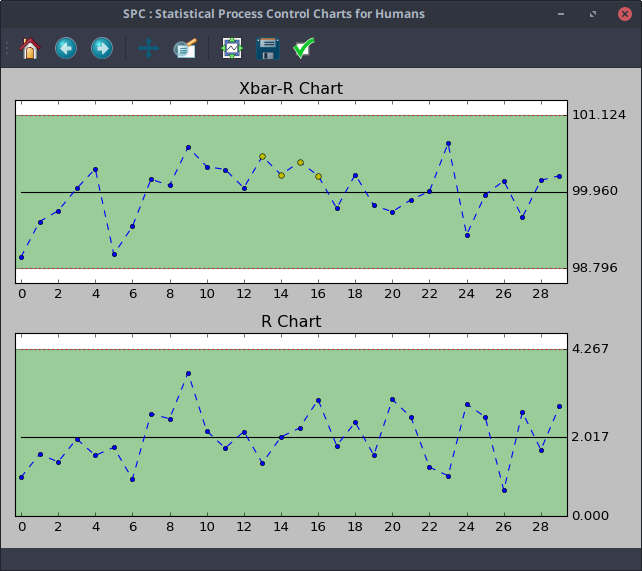
Xbar_Rbar 均值极差控制图
If the sample size is relatively small (say equal to or less than 10), we can use the range instead of the standard deviation of a sample to construct control charts on X and the range, R. The range of a sample is simply the difference between the largest and smallest observation.
如果样本量相对较小(例如等于或小于10),我们可以使用范围而不是样本的标准差来构建X和范围R的控制图。样本的范围只是最大和最小观测值之间的差异。
Xbar_Sbar 均值标准差控制图
X-s chart is very similar to the X-R chart. The major difference is that the subgroup standard deviation is plotted when using the X-s chart, while the subgroup range is plotted when using the X-R chart. One advantage of using the standard deviation instead of the range is that the standard deviation takes into account all the data, not just the maximum and the minimum. As for the X-R chart, frequent data and a method of rationally subgrouping the data are required to use the Xbar-s chart.
X-s图与X-R图非常相似。主要区别在于,当使用X-s图表时绘制子组标准差,而当使用X-R图表时绘制子组极差。使用标准差而不是极差的一个优点是,标准差考虑了所有数据,而不仅仅是最大值和最小值。对于X-R图,使用Xbar-s图需要频繁的数据和合理分组数据的方法。
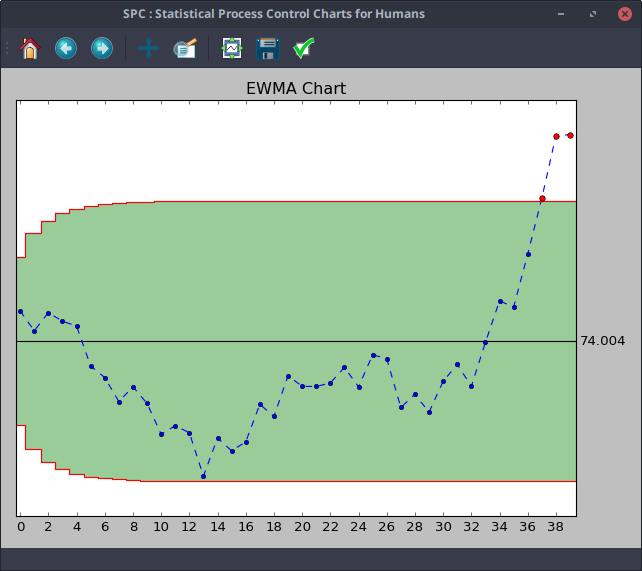
EWMA
The Exponentially Weighted Moving Average (EWMA) is a statistic for monitoring the process that averages the data in a way that gives less and less weight to data as they are further removed in time.
指数加权移动平均(EWMA)是一种统计数据,用于监控对数据进行平均化的过程,随着数据的进一步删除,数据的权重越来越小。
CUSUM
CUSUM charts, while not as intuitive and simple to operate as Shewhart charts, have been shown to be more efficient in detecting small shifts in the mean of a process. In particular, analyzing Average Run Length for CUSUM control charts shows that they are better than Shewhart control charts when it is desired to detect shifts in the mean that are 2 sigma or less.
CUSUM图表虽然不像Shewhart图那样直观、操作简单,但已证明在检测过程均值的微小变化方面更有效。特别是,分析CUSUM控制图的平均运行长度表明,当需要检测2西格玛或更小的平均值偏移时,它们优于Shewhart控制图。
使用
demo地址:
https://carlosqsilva.github.io/ccharts-online/
from pyspc import *

a = spc(pistonrings) + ewma()
print(a)

添加高亮规则
a + rules()
添加更多控制图
a + cusum() + xbar_sbar() + sbar()

包含有18个示例数据库,支持的自定义数据结构有nested lists (嵌套列表), numpy array (numpy数组 )或 pandas DataFrame(pandas 数据帧).
import numpy
from pyspc import *
fake_data = numpy.random.randn(30, 5) + 100
a = spc(fake_data) + xbar_rbar() + rbar() + rules()
print(a)
也可使用GUID,而非编码。(作为独立SPC分析工具可使用GUI,如果集成到应用程序等可使用代码)
$ python3 pyspc_gui.py
功能特点
变量
- Mean and Amplitude
- Mean and Standard Deviation
- Individual Values and Moving Range 移动均值
- Individual values with subgroups 子组
- Exponentially Weighted Moving Average (EWMA)
- Cumulative Sum (CUSUM)
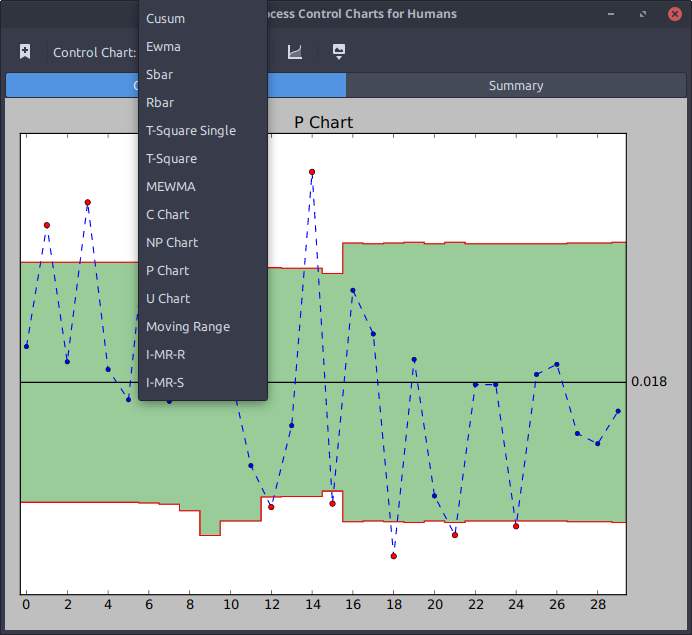
特性
- P Chart
- NP Chart
- C Chart
- U Chart
多变量
- T Square Hotelling
- T Square Hotelling with SubGroup
- Multivariate Exponentially Weighted Moving Average (MEWMA)
安装
$ pip install pyspc
作者:马洪彪
出处:http://www.cnblogs.com/mahongbiao/
本文版权归作者和博客园共有,欢迎转载,但未经作者同意必须保留此段声明,且在文章页面明显位置给出原文连接,否则保留追究法律责任的权利。

 浙公网安备 33010602011771号