
prometheus使用3
不错链接
60、Prometheus-alertmanager、邮件告警配置 https://www.cnblogs.com/ygbh/p/17306539.html
服务发现
基于文件的服务发现
现有配置:
[root@mcw03 ~]# cat /etc/prometheus.yml
# my global config
global:
  scrape_interval:     15s # Set the scrape interval to every 15 seconds. Default is every 1 minute.
  evaluation_interval: 15s # Evaluate rules every 15 seconds. The default is every 1 minute.
  # scrape_timeout is set to the global default (10s).

# Alertmanager configuration
alerting:
  alertmanagers:
  - static_configs:
    - targets:
      # - alertmanager:9093

# Load rules once and periodically evaluate them according to the global 'evaluation_interval'.
rule_files:
  - "rules/node_rules.yml"
  # - "first_rules.yml"
  # - "second_rules.yml"

# A scrape configuration containing exactly one endpoint to scrape:
# Here it's Prometheus itself.
scrape_configs:
  # The job name is added as a label `job=<job_name>` to any timeseries scraped from this config.
  - job_name: 'prometheus'

    # metrics_path defaults to '/metrics'
    # scheme defaults to 'http'.

    static_configs:
    - targets: ['localhost:9090']
  - job_name: 'agent1'
    static_configs:
    - targets: ['10.0.0.14:9100','10.0.0.12:9100']
  - job_name: 'promserver'
    static_configs:
    - targets: ['10.0.0.13:9100']
  - job_name: 'server_mariadb'
    static_configs:
    - targets: ['10.0.0.13:9104']
  - job_name: 'docker'
    static_configs:
    - targets: ['10.0.0.12:8080']
    metric_relabel_configs:
    - regex: 'kernelVersion'
      action: labeldrop
[root@mcw03 ~]#
把static_configs 替换成file_sd_configs
配置刷新重载文件配置的时间。可以不用手动刷新
创建目录并修改配置,指定使用的文件配置
下面红色配置错了,直接指定文件路径就可以,不需要targets键
[root@mcw03 ~]# ls /etc/prometheus.yml
/etc/prometheus.yml
[root@mcw03 ~]# mkdir -p /etc/targets/{nodes,docker}
[root@mcw03 ~]# vim /etc/prometheus.yml
[root@mcw03 ~]# cat /etc/prometheus.yml
# my global config
global:
  scrape_interval:     15s # Set the scrape interval to every 15 seconds. Default is every 1 minute.
  evaluation_interval: 15s # Evaluate rules every 15 seconds. The default is every 1 minute.
  # scrape_timeout is set to the global default (10s).

# Alertmanager configuration
alerting:
  alertmanagers:
  - static_configs:
    - targets:
      # - alertmanager:9093

# Load rules once and periodically evaluate them according to the global 'evaluation_interval'.
rule_files:
  - "rules/node_rules.yml"
  # - "first_rules.yml"
  # - "second_rules.yml"

# A scrape configuration containing exactly one endpoint to scrape:
# Here it's Prometheus itself.
scrape_configs:
  # The job name is added as a label `job=<job_name>` to any timeseries scraped from this config.
  - job_name: 'prometheus'

    # metrics_path defaults to '/metrics'
    # scheme defaults to 'http'.

    static_configs:
    - targets: ['localhost:9090']
  - job_name: 'agent1'
    file_sd_configs:
      - files:
        - targets: targets/nodes/*.json
        refresh_interval: 5m
  - job_name: 'promserver'
    static_configs:
    - targets: ['10.0.0.13:9100']
  - job_name: 'server_mariadb'
    static_configs:
    - targets: ['10.0.0.13:9104']
  - job_name: 'docker'
    file_sd_configs:
      - files:
        - targets: targets/docker/*.json
        refresh_interval: 5m
   # metric_relabel_configs:
   # - regex: 'kernelVersion'
   #   action: labeldrop
[root@mcw03 ~]#
创建配置文件
[root@mcw03 ~]# touch /etc/targets/nodes/nodes.json
[root@mcw03 ~]# touch /etc/targets/docker/daemons.json
[root@mcw03 ~]#
修改到json文件配置中
[root@mcw03 ~]# vim  /etc/targets/nodes/nodes.json
[root@mcw03 ~]# vim /etc/targets/docker/daemons.json
[root@mcw03 ~]# cat /etc/targets/nodes/nodes.json
[{
  "targets": [
    "10.0.0.14:9100",
    "10.0.0.12:9100"
  ]
}]
[root@mcw03 ~]# cat /etc/targets/docker/daemons.json
[{
  "targets": [
    "10.0.0.12:8080"
  ]
}]
[root@mcw03 ~]#
报错了
[root@mcw03 ~]# curl -X POST http://localhost:9090/-/reload
failed to reload config: couldn't load configuration (--config.file="/etc/prometheus.yml"): parsing YAML file /etc/prometheus.yml: yaml: unmarshal errors:
  line 34: cannot unmarshal !!map into string
  line 45: cannot unmarshal !!map into string
[root@mcw03 ~]#
上面配置写错了
[root@mcw03 ~]# vim /etc/prometheus.yml
[root@mcw03 ~]# cat /etc/prometheus.yml
# my global config
global:
  scrape_interval:     15s # Set the scrape interval to every 15 seconds. Default is every 1 minute.
  evaluation_interval: 15s # Evaluate rules every 15 seconds. The default is every 1 minute.
  # scrape_timeout is set to the global default (10s).

# Alertmanager configuration
alerting:
  alertmanagers:
  - static_configs:
    - targets:
      # - alertmanager:9093

# Load rules once and periodically evaluate them according to the global 'evaluation_interval'.
rule_files:
  - "rules/node_rules.yml"
  # - "first_rules.yml"
  # - "second_rules.yml"

# A scrape configuration containing exactly one endpoint to scrape:
# Here it's Prometheus itself.
scrape_configs:
  # The job name is added as a label `job=<job_name>` to any timeseries scraped from this config.
  - job_name: 'prometheus'

    # metrics_path defaults to '/metrics'
    # scheme defaults to 'http'.

    static_configs:
    - targets: ['localhost:9090']
  - job_name: 'agent1'
    file_sd_configs:
      - files:
        - targets/nodes/*.json
        refresh_interval: 5m
  - job_name: 'promserver'
    static_configs:
    - targets: ['10.0.0.13:9100']
  - job_name: 'server_mariadb'
    static_configs:
    - targets: ['10.0.0.13:9104']
  - job_name: 'docker'
    file_sd_configs:
      - files:
        - targets/docker/*.json
        refresh_interval: 5m
   # metric_relabel_configs:
   # - regex: 'kernelVersion'
   #   action: labeldrop
[root@mcw03 ~]# curl -X POST http://localhost:9090/-/reload
[root@mcw03 ~]#
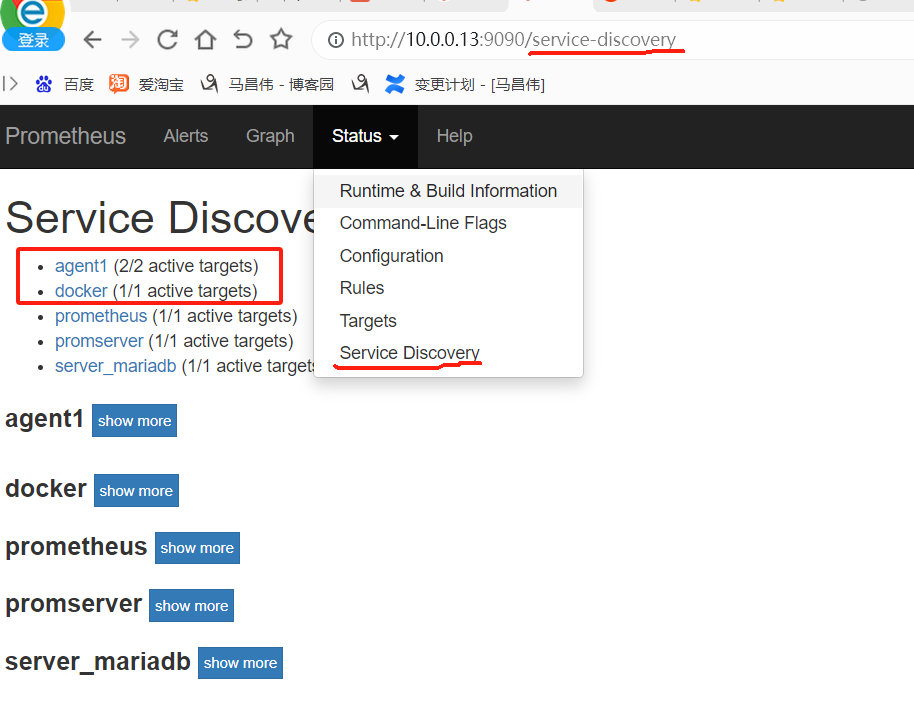
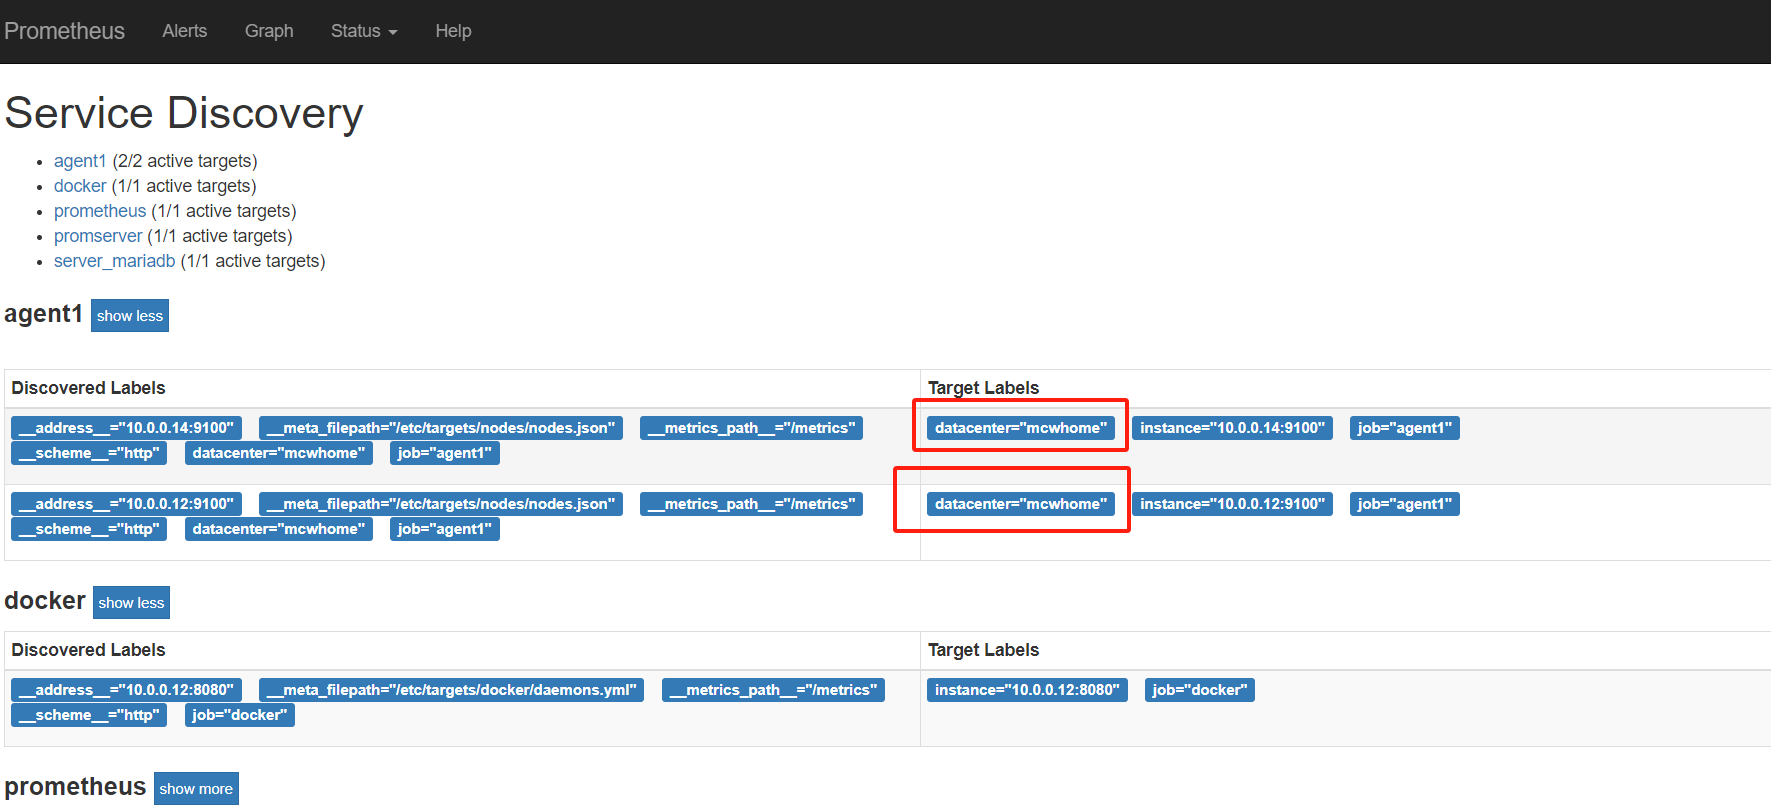
此时看,可以看到服务发现的客户端
http://10.0.0.13:9090/service-discovery
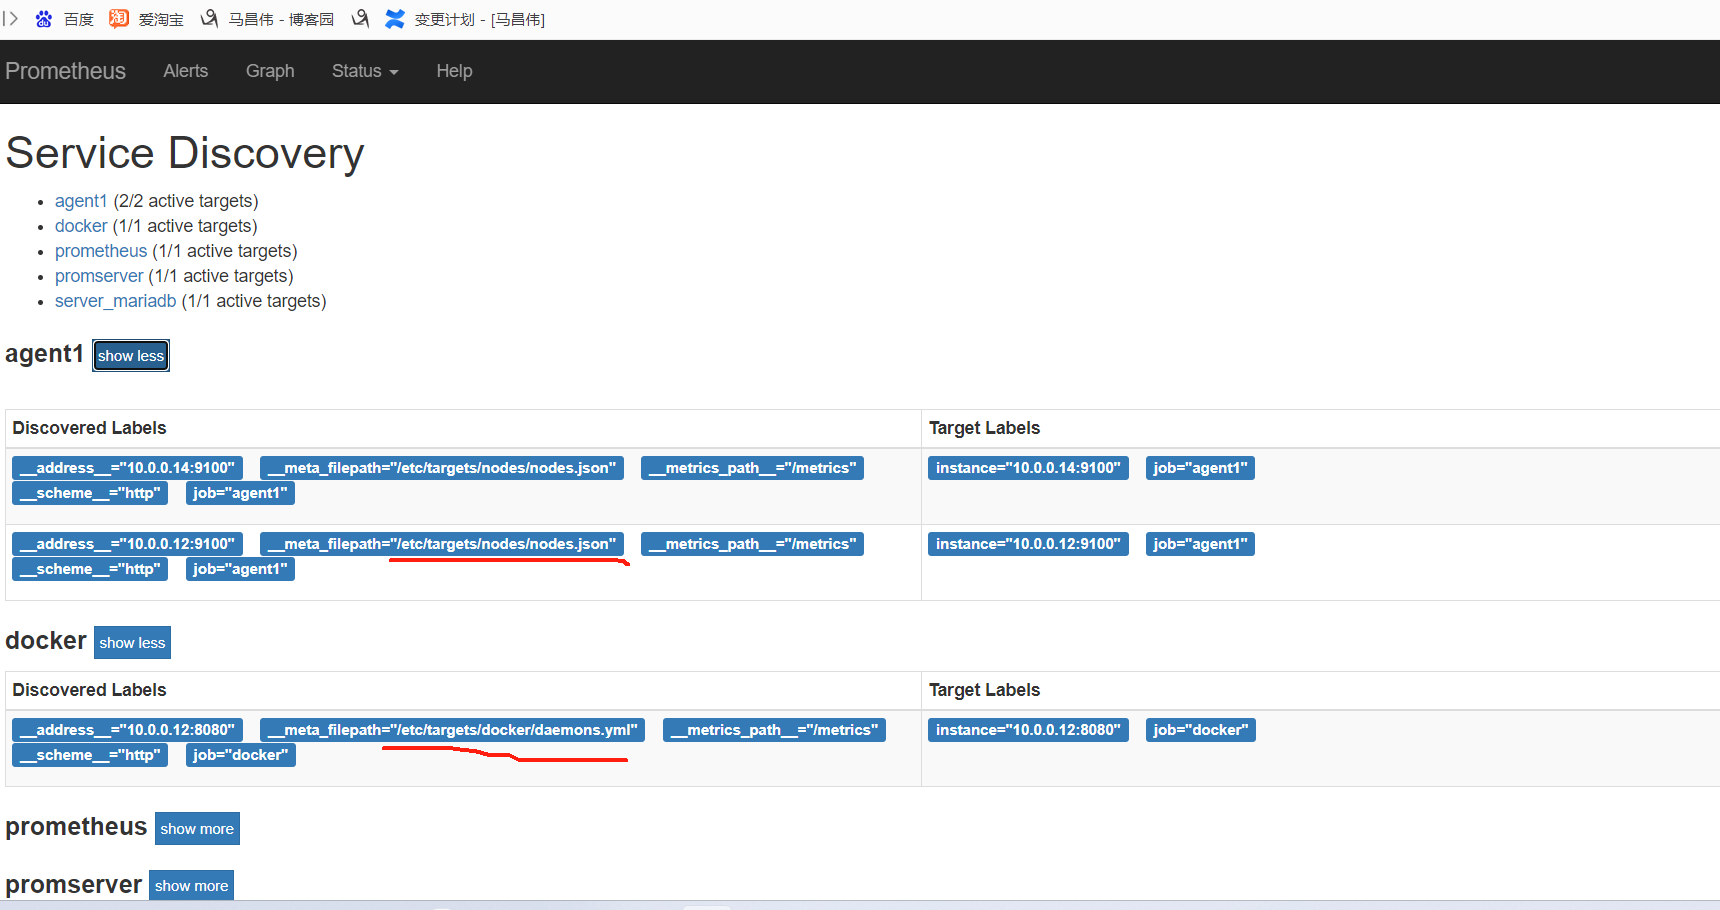
改为yml格式
[root@mcw03 ~]# vim /etc/prometheus.yml
[root@mcw03 ~]# cat /etc/prometheus.yml
# my global config
global:
  scrape_interval:     15s # Set the scrape interval to every 15 seconds. Default is every 1 minute.
  evaluation_interval: 15s # Evaluate rules every 15 seconds. The default is every 1 minute.
  # scrape_timeout is set to the global default (10s).

# Alertmanager configuration
alerting:
  alertmanagers:
  - static_configs:
    - targets:
      # - alertmanager:9093

# Load rules once and periodically evaluate them according to the global 'evaluation_interval'.
rule_files:
  - "rules/node_rules.yml"
  # - "first_rules.yml"
  # - "second_rules.yml"

# A scrape configuration containing exactly one endpoint to scrape:
# Here it's Prometheus itself.
scrape_configs:
  # The job name is added as a label `job=<job_name>` to any timeseries scraped from this config.
  - job_name: 'prometheus'

    # metrics_path defaults to '/metrics'
    # scheme defaults to 'http'.

    static_configs:
    - targets: ['localhost:9090']
  - job_name: 'agent1'
    file_sd_configs:
      - files:
        - targets/nodes/*.json
        refresh_interval: 5m
  - job_name: 'promserver'
    static_configs:
    - targets: ['10.0.0.13:9100']
  - job_name: 'server_mariadb'
    static_configs:
    - targets: ['10.0.0.13:9104']
  - job_name: 'docker'
    file_sd_configs:
      - files:
        - targets/docker/*.yml
        refresh_interval: 5m
   # metric_relabel_configs:
   # - regex: 'kernelVersion'
   #   action: labeldrop
[root@mcw03 ~]# cp  /etc/targets/docker/daemons.json /etc/targets/docker/daemons.yml
[root@mcw03 ~]# vim /etc/targets/docker/daemons.yml
[root@mcw03 ~]# cat /etc/targets/docker/daemons.yml
- targets:
  - "10.0.0.12:8080"
[root@mcw03 ~]#
[root@mcw03 ~]# curl -X POST http://localhost:9090/-/reload
[root@mcw03 ~]#
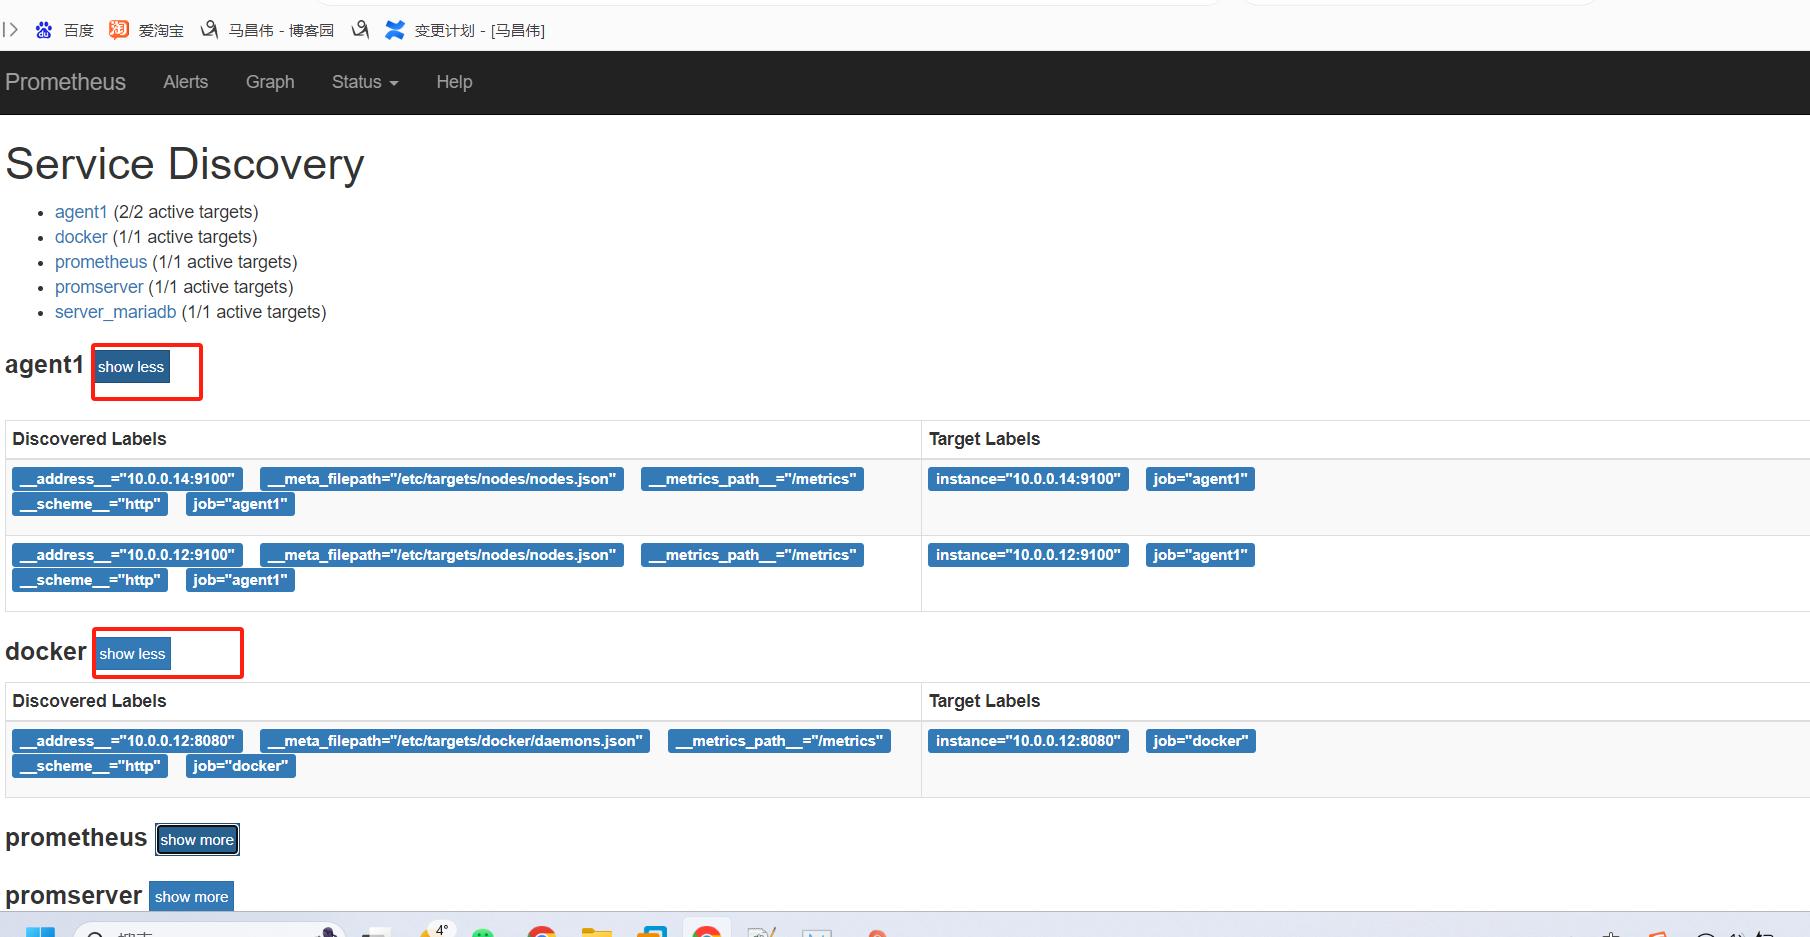
重载之后正常,
从标签里可以看到,服务自动发现来自哪里
因为target是yml或者json数据,所以可以用salt,cmdb等等各种,进行配置集中管理,实现监控
基于文件的自动发现,添加标签的实现
修改配置
[root@mcw03 ~]# vim /etc/targets/nodes/nodes.json
[root@mcw03 ~]# cat /etc/targets/nodes/nodes.json
[{
  "targets": [
    "10.0.0.14:9100",
    "10.0.0.12:9100"
  ],
  "labels": {
     "datacenter": "mcwhome"
  }
}]
[root@mcw03 ~]# vim /etc/targets/docker/daemons.yml
[root@mcw03 ~]# cat /etc/targets/docker/daemons.yml
- targets:
  - "10.0.0.12:8080"
- labels:
    "datacenter": "mcwymlhome"
[root@mcw03 ~]#
不需要重启服务,这个标签自动就有了。不过yml格式的,添加标签,没有生效。不清楚咋添加
基于api的服务发现
基于dns的服务发现
警报管理 alertmanager
安装alertmanager
wget https://github.com/prometheus/alertmanager/download/v0.15.2/alertmanager-0.15.2.linux-amd64.tar.gz
-
下载方式:
-
https://prometheus.io/download/
下载完成后上传到服务器中
步骤一:
解压tar -xzf alertmanager-0.25.0.linux-amd64.tar.gz解压完成后进入alertmanager目录
步骤二:
创建文件夹mkdir /etc/alertmanagermkdir /usr/lib/alertmanager
步骤三:
复制文件和授权cp alertmanager.yml /etc/alertmanager/chown prometheus /var/lib/alertmanager/cp alertmanager /usr/local/bin/
步骤四:
编写系统服务文件vi /etc/systemd/system/alertmanager.service
[Unit]
Description=Prometheus Alertmanager
Wants=network-online.target
After=network-online.target

[Service]
User=prometheus
Group=prometheus
Restart=always
Type=simple
ExecStart=/usr/local/bin/alertmanager --config.file=/etc/alertmanager/alertmanager.yml --storage.path=/var/lib/alertmanager/

[Install]
WantedBy=multi-user.target
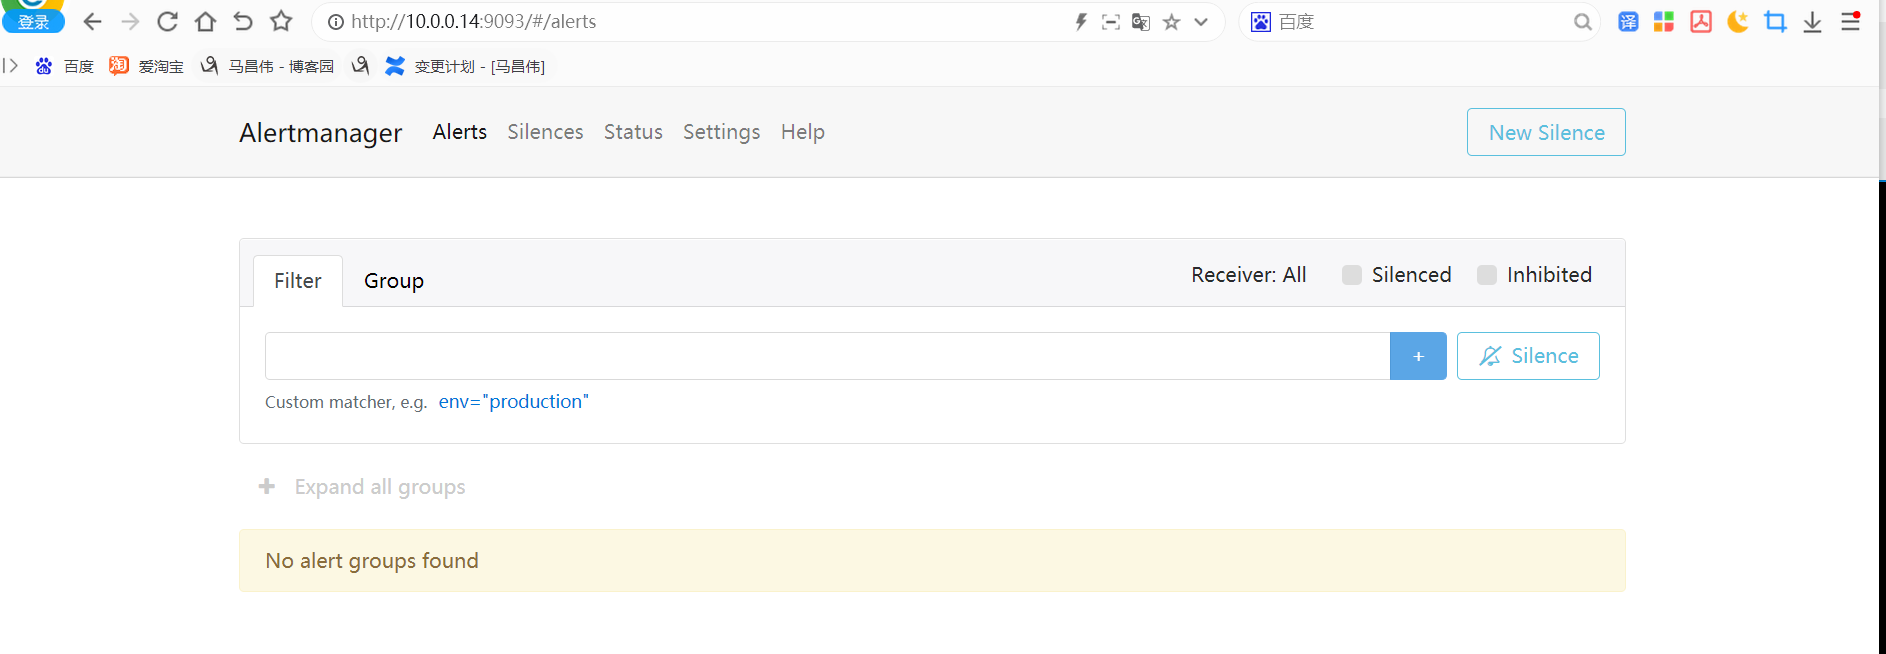
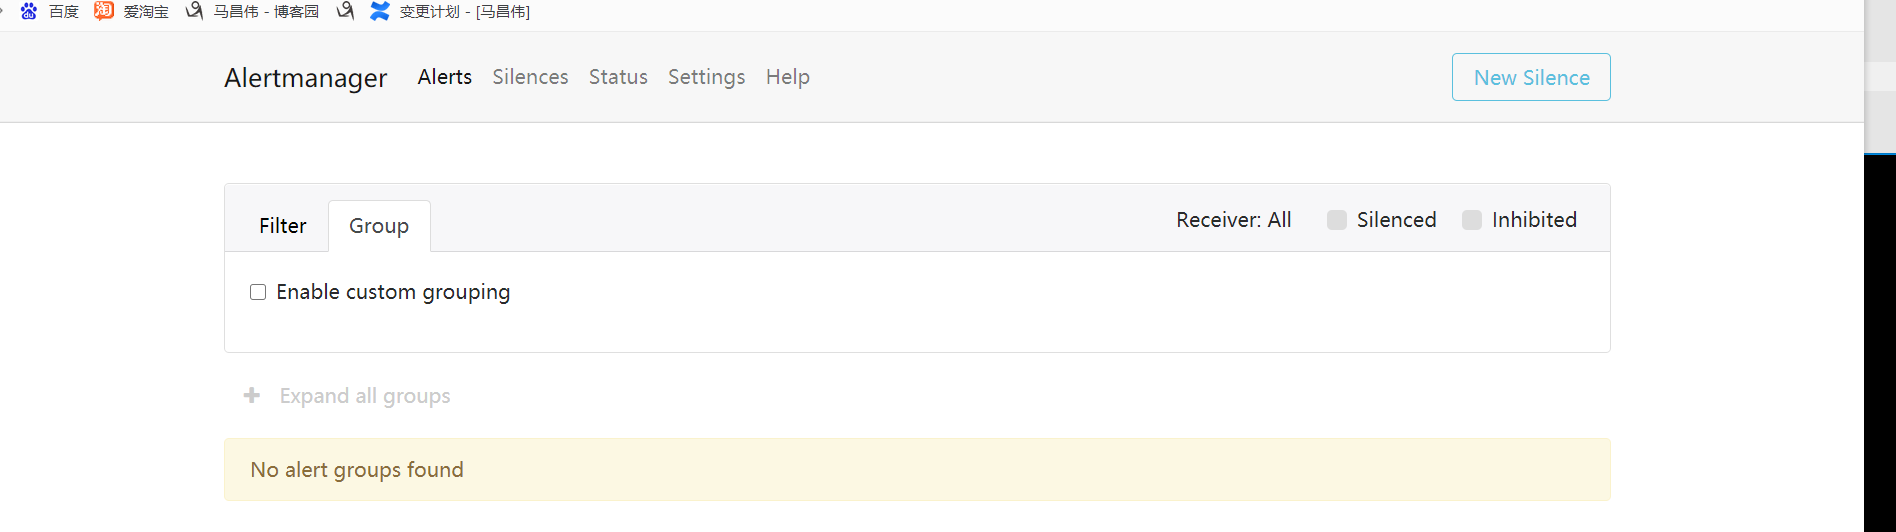
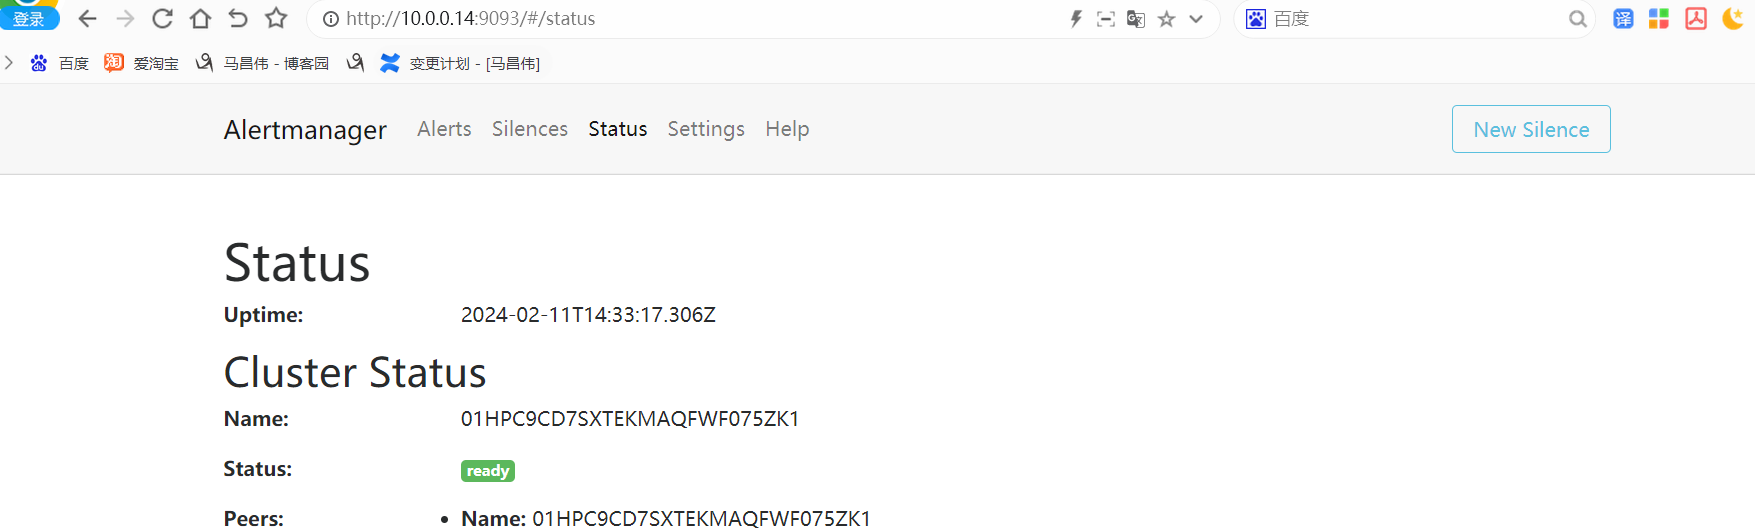
访问:
在浏览器输入 http://IP:9093/
步骤五:
在Prometheus配置文件中添加如下配置
alerting:
  alertmanagers:
    - static_configs:
        - targets:
           - alertmanager:9093
[root@mcw04 tmp]# ls
alertmanager-0.26.0.linux-amd64.tar.gz                                   systemd-private-a0e7e3d7293d454882c643c5f1a8ce7c-vmtoolsd.service-4BK6V6
systemd-private-3cf99c02a7114f738c3140f943aa9417-httpd.service-BpHja5    systemd-private-b04829df8fdd485f9add302ef649283a-chronyd.service-oxOzvx
systemd-private-a0e7e3d7293d454882c643c5f1a8ce7c-chronyd.service-uChRN0  systemd-private-b04829df8fdd485f9add302ef649283a-httpd.service-zRmTsv
systemd-private-a0e7e3d7293d454882c643c5f1a8ce7c-httpd.service-8kD7xq    systemd-private-b04829df8fdd485f9add302ef649283a-mariadb.service-4yFwtp
systemd-private-a0e7e3d7293d454882c643c5f1a8ce7c-mariadb.service-VXa7sc  systemd-private-b04829df8fdd485f9add302ef649283a-vgauthd.service-IRzCTg
systemd-private-a0e7e3d7293d454882c643c5f1a8ce7c-vgauthd.service-uF9wkU  systemd-private-b04829df8fdd485f9add302ef649283a-vmtoolsd.service-UM1nFT
[root@mcw04 tmp]# tar xf alertmanager-0.26.0.linux-amd64.tar.gz
[root@mcw04 tmp]# ls
alertmanager-0.26.0.linux-amd64                                          systemd-private-a0e7e3d7293d454882c643c5f1a8ce7c-vmtoolsd.service-4BK6V6
alertmanager-0.26.0.linux-amd64.tar.gz                                   systemd-private-b04829df8fdd485f9add302ef649283a-chronyd.service-oxOzvx
systemd-private-3cf99c02a7114f738c3140f943aa9417-httpd.service-BpHja5    systemd-private-b04829df8fdd485f9add302ef649283a-httpd.service-zRmTsv
systemd-private-a0e7e3d7293d454882c643c5f1a8ce7c-chronyd.service-uChRN0  systemd-private-b04829df8fdd485f9add302ef649283a-mariadb.service-4yFwtp
systemd-private-a0e7e3d7293d454882c643c5f1a8ce7c-httpd.service-8kD7xq    systemd-private-b04829df8fdd485f9add302ef649283a-vgauthd.service-IRzCTg
systemd-private-a0e7e3d7293d454882c643c5f1a8ce7c-mariadb.service-VXa7sc  systemd-private-b04829df8fdd485f9add302ef649283a-vmtoolsd.service-UM1nFT
systemd-private-a0e7e3d7293d454882c643c5f1a8ce7c-vgauthd.service-uF9wkU
[root@mcw04 tmp]# cd alertmanager-0.26.0.linux-amd64/
[root@mcw04 alertmanager-0.26.0.linux-amd64]# ls
alertmanager  alertmanager.yml  amtool  LICENSE  NOTICE
[root@mcw04 alertmanager-0.26.0.linux-amd64]# mkdir /etc/alertmanager
[root@mcw04 alertmanager-0.26.0.linux-amd64]# mkdir /usr/lib/alertmanager
[root@mcw04 alertmanager-0.26.0.linux-amd64]# cp alertmanager.yml /etc/alertmanager/
[root@mcw04 alertmanager-0.26.0.linux-amd64]# chown prometheus /usr/lib/alertmanager/
chown: invalid user: ‘prometheus’
[root@mcw04 alertmanager-0.26.0.linux-amd64]# useradd prometheus
[root@mcw04 alertmanager-0.26.0.linux-amd64]# chown prometheus /usr/lib/alertmanager/
[root@mcw04 alertmanager-0.26.0.linux-amd64]# cp alertmanager /usr/local/bin/
[root@mcw04 alertmanager-0.26.0.linux-amd64]# vim /etc/systemd/system/alertmanager.service
[root@mcw04 alertmanager-0.26.0.linux-amd64]# mkdir /var/lib/alertmanager
[root@mcw04 alertmanager-0.26.0.linux-amd64]# chown prometheus /var/lib/alertmanager/
[root@mcw04 alertmanager-0.26.0.linux-amd64]# systemctl daemon-reload
[root@mcw04 alertmanager-0.26.0.linux-amd64]# systemctl status alertmanager.service
● alertmanager.service - Prometheus Alertmanager
   Loaded: loaded (/etc/systemd/system/alertmanager.service; disabled; vendor preset: disabled)
   Active: inactive (dead)
[root@mcw04 alertmanager-0.26.0.linux-amd64]# systemctl start alertmanager.service
[root@mcw04 alertmanager-0.26.0.linux-amd64]# ps -ef|grep alertman
prometh+  15558      1  3 21:26 ?        00:00:00 /usr/local/bin/alertmanager --config.file=/etc/alertmanager/alertmanager.yml --storage.path=/var/lib/alertmanager/
root      15574   2038  0 21:26 pts/0    00:00:00 grep --color=auto alertman
[root@mcw04 alertmanager-0.26.0.linux-amd64]#
[root@mcw04 alertmanager-0.26.0.linux-amd64]#
http://10.0.0.14:9093/
访问:
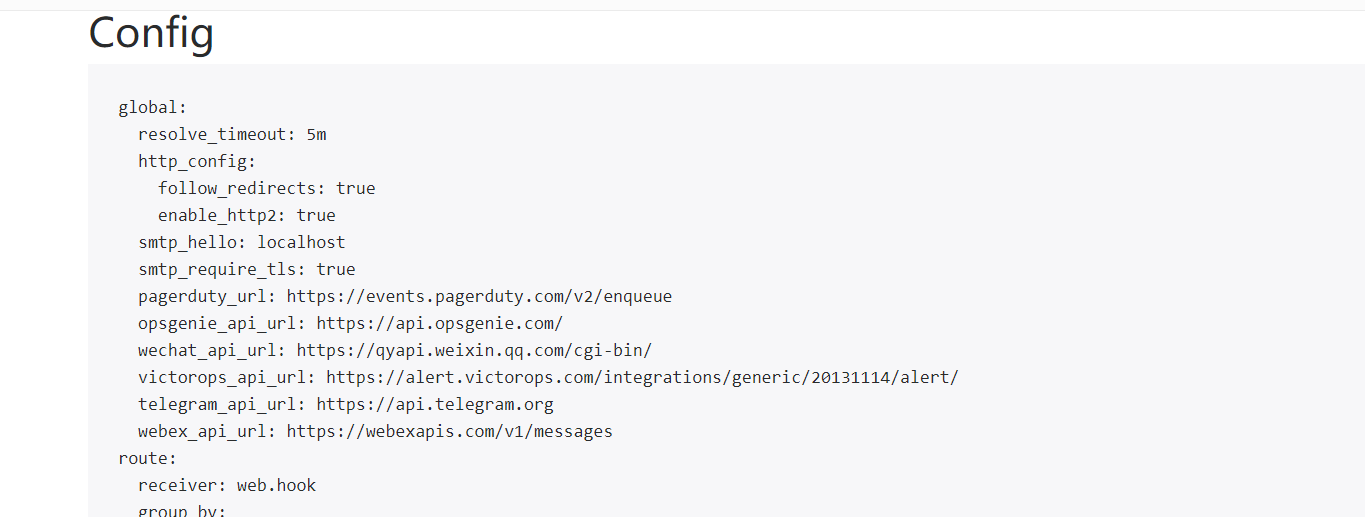
global:
  resolve_timeout: 5m
  http_config:
    follow_redirects: true
    enable_http2: true
  smtp_hello: localhost
  smtp_require_tls: true
  pagerduty_url: https://events.pagerduty.com/v2/enqueue
  opsgenie_api_url: https://api.opsgenie.com/
  wechat_api_url: https://qyapi.weixin.qq.com/cgi-bin/
  victorops_api_url: https://alert.victorops.com/integrations/generic/20131114/alert/
  telegram_api_url: https://api.telegram.org
  webex_api_url: https://webexapis.com/v1/messages
route:
  receiver: web.hook
  group_by:
  - alertname
  continue: false
  group_wait: 30s
  group_interval: 5m
  repeat_interval: 1h
inhibit_rules:
- source_match:
    severity: critical
  target_match:
    severity: warning
  equal:
  - alertname
  - dev
  - instance
receivers:
- name: web.hook
  webhook_configs:
  - send_resolved: true
    http_config:
      follow_redirects: true
      enable_http2: true
    url: <secret>
    url_file: ""
    max_alerts: 0
templates: []

在Prometheus配置里面添加配置。修改前是这样的
# Alertmanager configuration
alerting:
  alertmanagers:
  - static_configs:
    - targets:
      # - alertmanager:9093
修改后是这样的.也可以用主机名代替ip,不过需要本机可以解析
# Alertmanager configuration
alerting:
  alertmanagers:
  - static_configs:
    - targets:
       - 10.0.0.14:9093
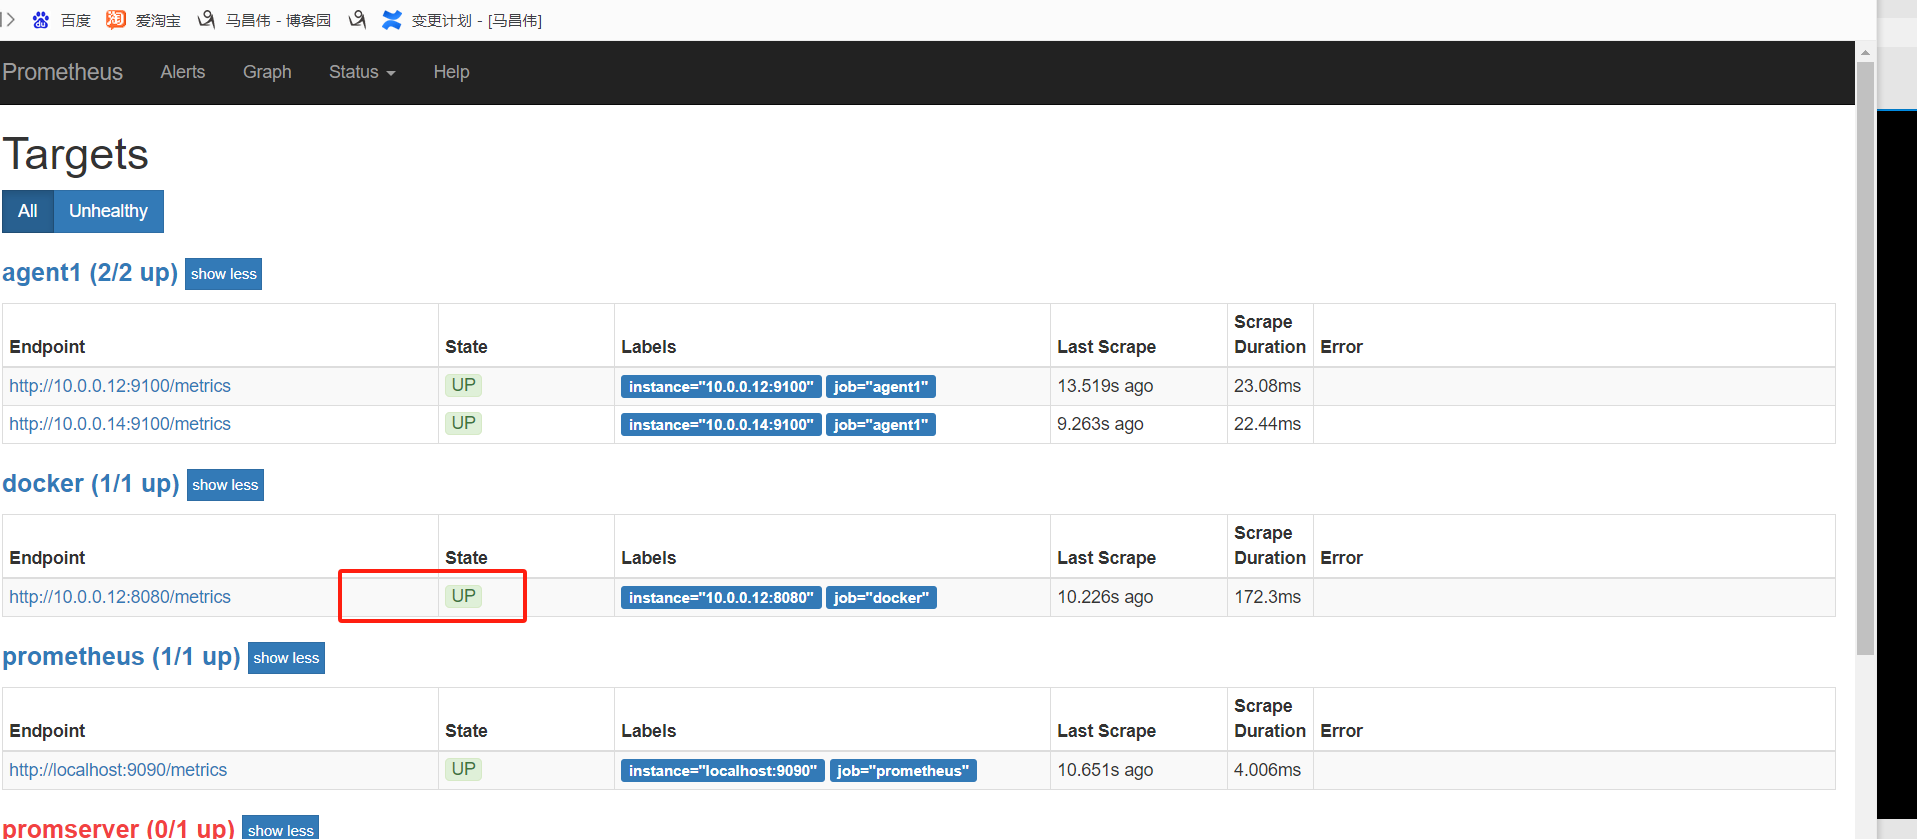
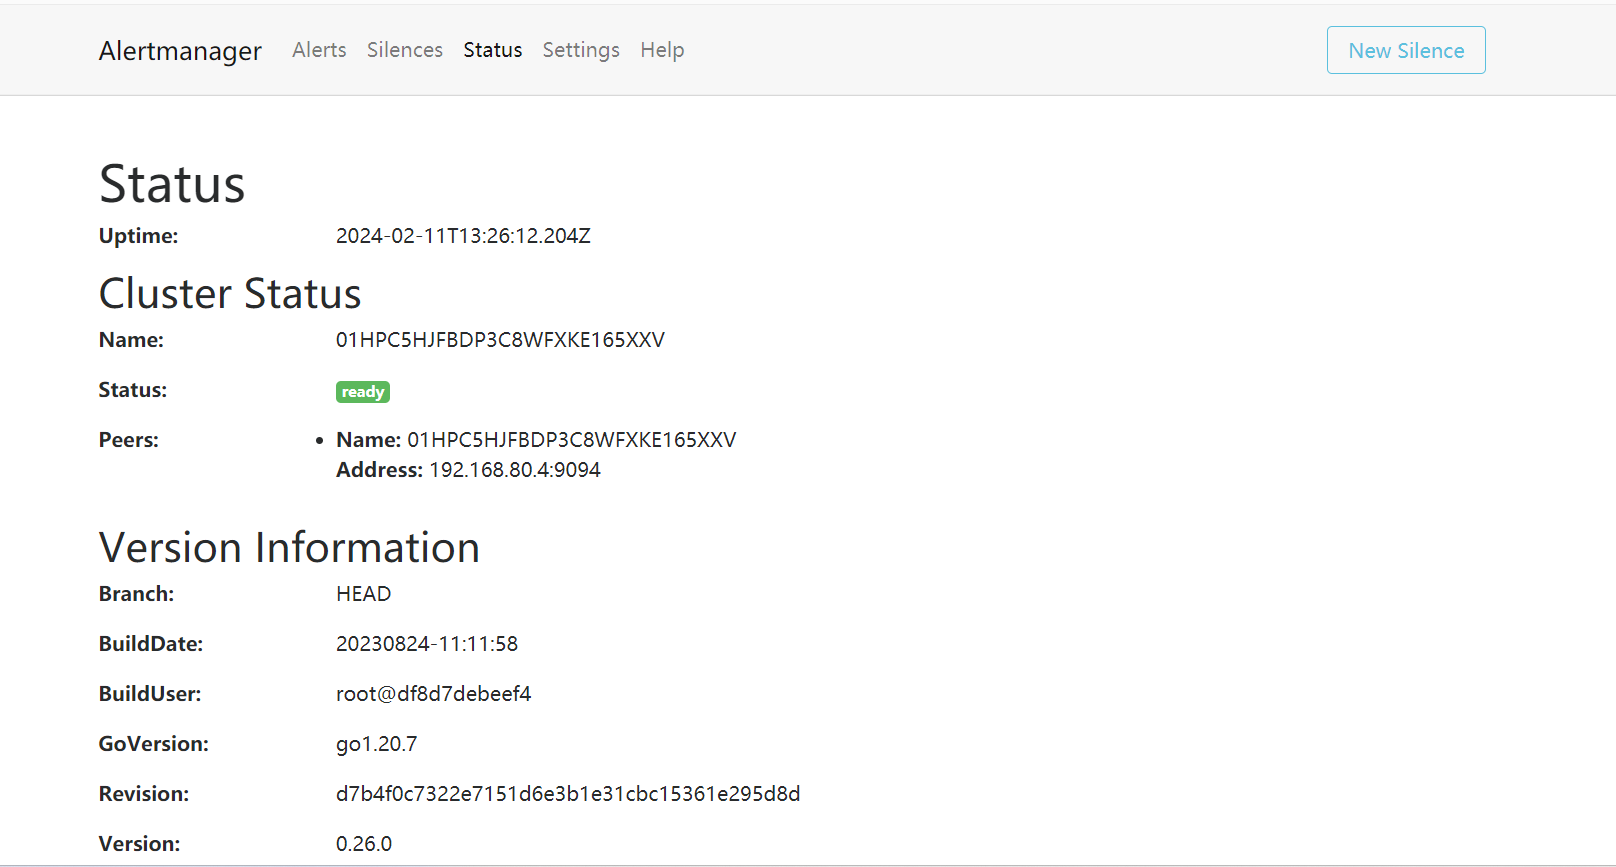
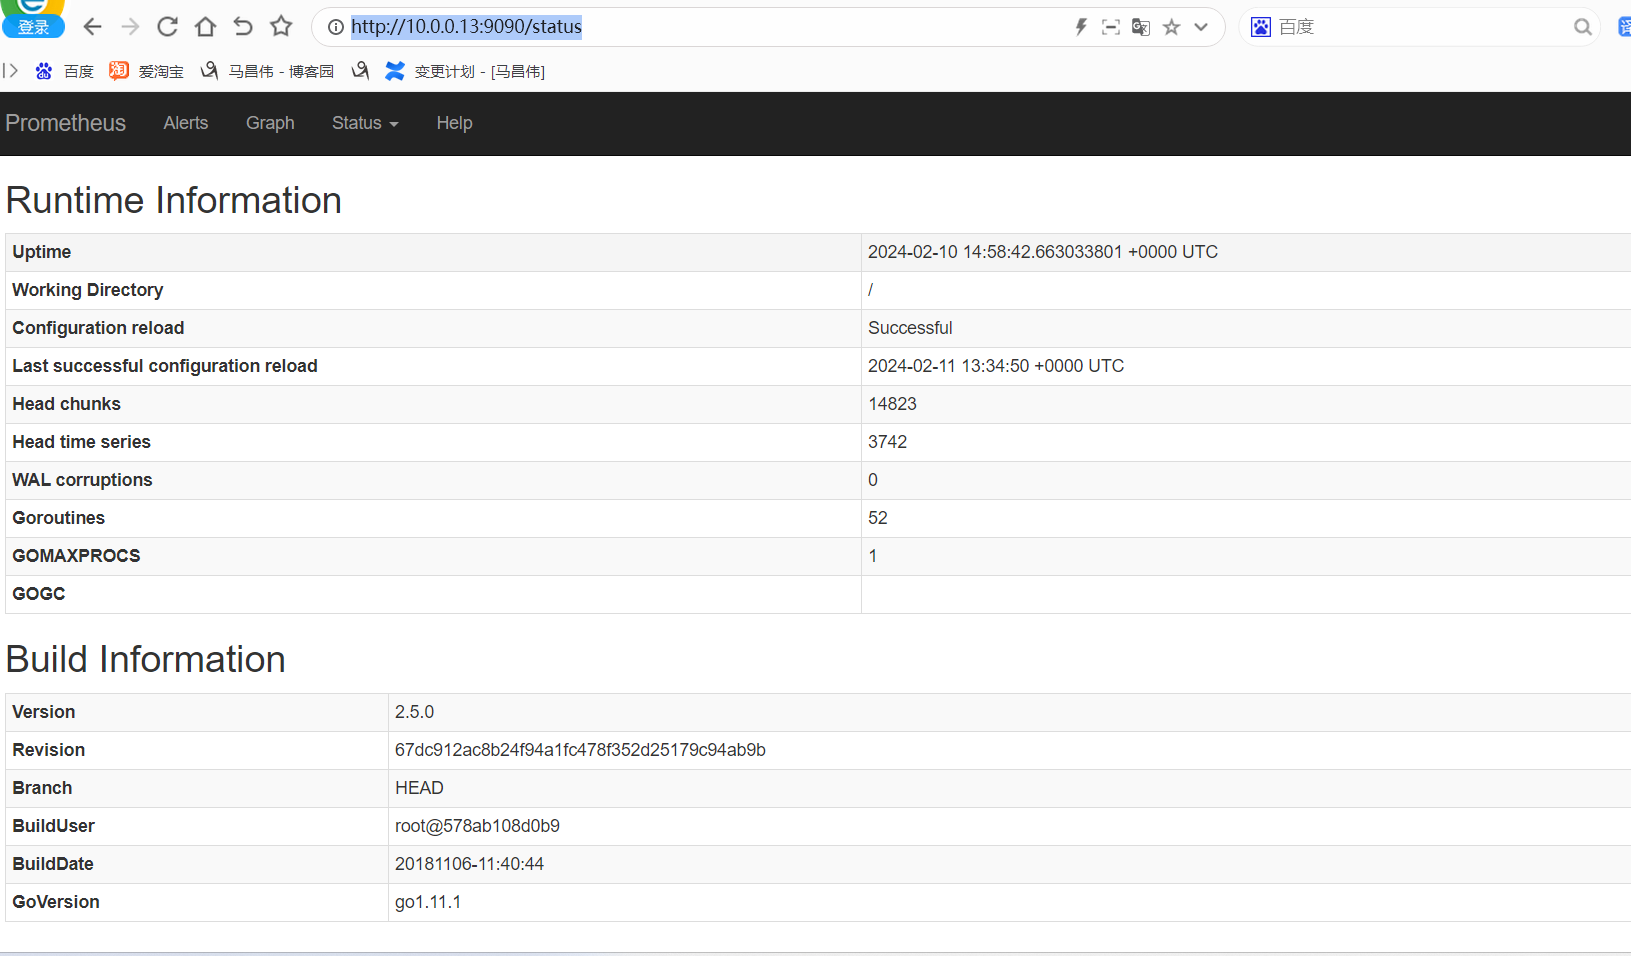
重载之后查看是否生效了
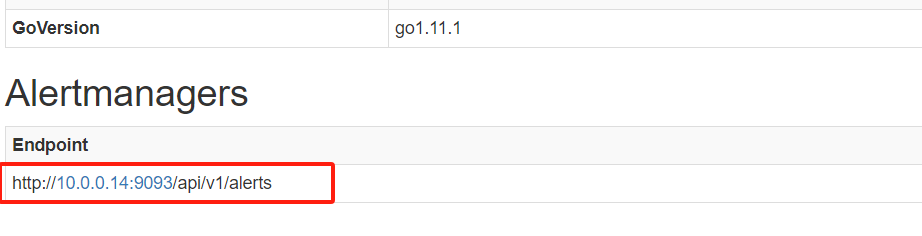
http://10.0.0.13:9090/status
可以看到已经多出了我们的 链接
监控alertmanager
[root@mcw03 ~]# vim /etc/prometheus.yml
  - job_name: 'alertmanager'
    static_configs:
    - targets: ['10.0.0.14:9093']
[root@mcw03 ~]# curl -X POST http://localhost:9090/-/reload
[root@mcw03 ~]#
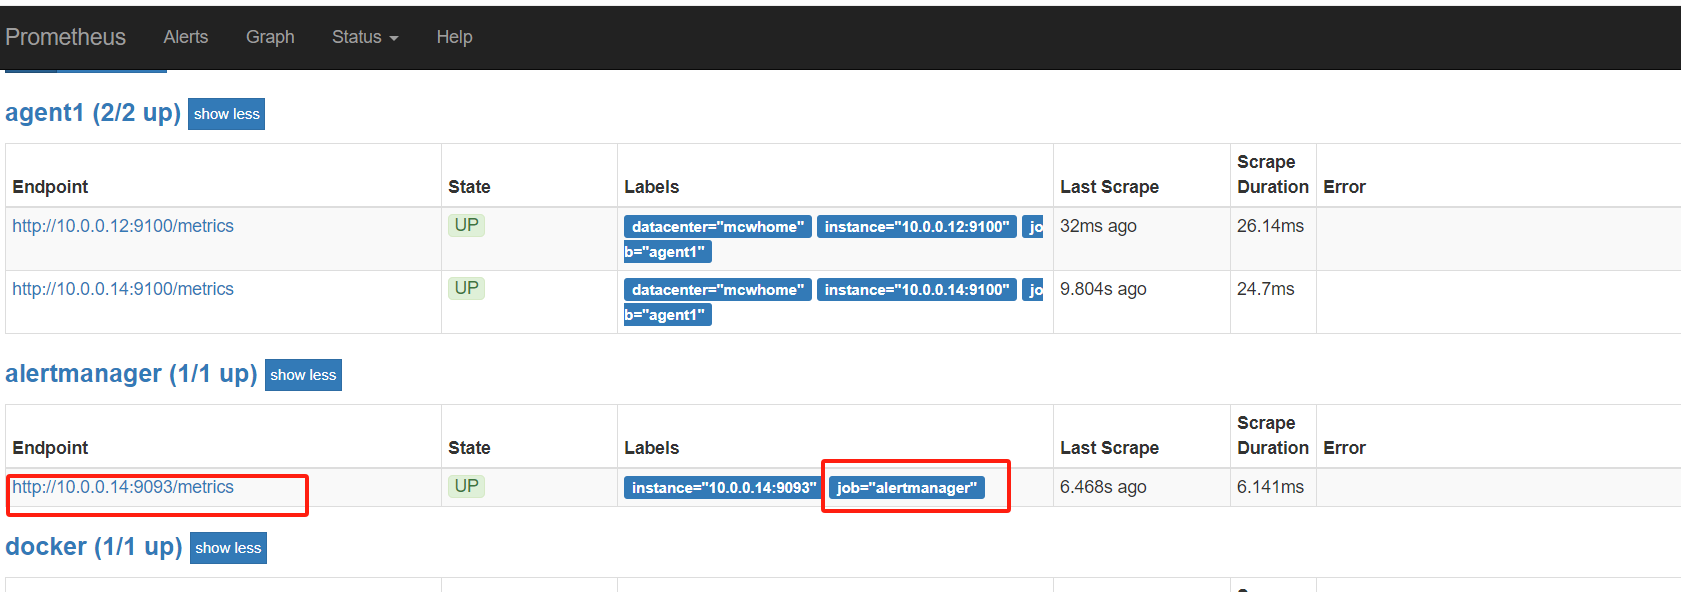
返回一堆alertmanager_开头的指标。包含警报计数,接收器分类的成功和失败通知的计数等等


# HELP alertmanager_alerts How many alerts by state.
# TYPE alertmanager_alerts gauge
alertmanager_alerts{state="active"} 0
alertmanager_alerts{state="suppressed"} 0
alertmanager_alerts{state="unprocessed"} 0
# HELP alertmanager_alerts_invalid_total The total number of received alerts that were invalid.
# TYPE alertmanager_alerts_invalid_total counter
alertmanager_alerts_invalid_total{version="v1"} 0
alertmanager_alerts_invalid_total{version="v2"} 0
# HELP alertmanager_alerts_received_total The total number of received alerts.
# TYPE alertmanager_alerts_received_total counter
alertmanager_alerts_received_total{status="firing",version="v1"} 0
alertmanager_alerts_received_total{status="firing",version="v2"} 0
alertmanager_alerts_received_total{status="resolved",version="v1"} 0
alertmanager_alerts_received_total{status="resolved",version="v2"} 0
# HELP alertmanager_build_info A metric with a constant '1' value labeled by version, revision, branch, goversion from which alertmanager was built, and the goos and goarch for the build.
# TYPE alertmanager_build_info gauge
alertmanager_build_info{branch="HEAD",goarch="amd64",goos="linux",goversion="go1.20.7",revision="d7b4f0c7322e7151d6e3b1e31cbc15361e295d8d",tags="netgo",version="0.26.0"} 1
# HELP alertmanager_cluster_alive_messages_total Total number of received alive messages.
# TYPE alertmanager_cluster_alive_messages_total counter
alertmanager_cluster_alive_messages_total{peer="01HPC5HJFBDP3C8WFXKE165XXV"} 1
# HELP alertmanager_cluster_enabled Indicates whether the clustering is enabled or not.
# TYPE alertmanager_cluster_enabled gauge
alertmanager_cluster_enabled 1
# HELP alertmanager_cluster_failed_peers Number indicating the current number of failed peers in the cluster.
# TYPE alertmanager_cluster_failed_peers gauge
alertmanager_cluster_failed_peers 0
# HELP alertmanager_cluster_health_score Health score of the cluster. Lower values are better and zero means 'totally healthy'.
# TYPE alertmanager_cluster_health_score gauge
alertmanager_cluster_health_score 0
# HELP alertmanager_cluster_members Number indicating current number of members in cluster.
# TYPE alertmanager_cluster_members gauge
alertmanager_cluster_members 1
# HELP alertmanager_cluster_messages_pruned_total Total number of cluster messages pruned.
# TYPE alertmanager_cluster_messages_pruned_total counter
alertmanager_cluster_messages_pruned_total 0
# HELP alertmanager_cluster_messages_queued Number of cluster messages which are queued.
# TYPE alertmanager_cluster_messages_queued gauge
alertmanager_cluster_messages_queued 0
# HELP alertmanager_cluster_messages_received_size_total Total size of cluster messages received.
# TYPE alertmanager_cluster_messages_received_size_total counter
alertmanager_cluster_messages_received_size_total{msg_type="full_state"} 0
alertmanager_cluster_messages_received_size_total{msg_type="update"} 0
# HELP alertmanager_cluster_messages_received_total Total number of cluster messages received.
# TYPE alertmanager_cluster_messages_received_total counter
alertmanager_cluster_messages_received_total{msg_type="full_state"} 0
alertmanager_cluster_messages_received_total{msg_type="update"} 0
# HELP alertmanager_cluster_messages_sent_size_total Total size of cluster messages sent.
# TYPE alertmanager_cluster_messages_sent_size_total counter
alertmanager_cluster_messages_sent_size_total{msg_type="full_state"} 0
alertmanager_cluster_messages_sent_size_total{msg_type="update"} 0
# HELP alertmanager_cluster_messages_sent_total Total number of cluster messages sent.
# TYPE alertmanager_cluster_messages_sent_total counter
alertmanager_cluster_messages_sent_total{msg_type="full_state"} 0
alertmanager_cluster_messages_sent_total{msg_type="update"} 0
# HELP alertmanager_cluster_peer_info A metric with a constant '1' value labeled by peer name.
# TYPE alertmanager_cluster_peer_info gauge
alertmanager_cluster_peer_info{peer="01HPC5HJFBDP3C8WFXKE165XXV"} 1
# HELP alertmanager_cluster_peers_joined_total A counter of the number of peers that have joined.
# TYPE alertmanager_cluster_peers_joined_total counter
alertmanager_cluster_peers_joined_total 1
# HELP alertmanager_cluster_peers_left_total A counter of the number of peers that have left.
# TYPE alertmanager_cluster_peers_left_total counter
alertmanager_cluster_peers_left_total 0
# HELP alertmanager_cluster_peers_update_total A counter of the number of peers that have updated metadata.
# TYPE alertmanager_cluster_peers_update_total counter
alertmanager_cluster_peers_update_total 0
# HELP alertmanager_cluster_reconnections_failed_total A counter of the number of failed cluster peer reconnection attempts.
# TYPE alertmanager_cluster_reconnections_failed_total counter
alertmanager_cluster_reconnections_failed_total 0
# HELP alertmanager_cluster_reconnections_total A counter of the number of cluster peer reconnections.
# TYPE alertmanager_cluster_reconnections_total counter
alertmanager_cluster_reconnections_total 0
# HELP alertmanager_cluster_refresh_join_failed_total A counter of the number of failed cluster peer joined attempts via refresh.
# TYPE alertmanager_cluster_refresh_join_failed_total counter
alertmanager_cluster_refresh_join_failed_total 0
# HELP alertmanager_cluster_refresh_join_total A counter of the number of cluster peer joined via refresh.
# TYPE alertmanager_cluster_refresh_join_total counter
alertmanager_cluster_refresh_join_total 0
# HELP alertmanager_config_hash Hash of the currently loaded alertmanager configuration.
# TYPE alertmanager_config_hash gauge
alertmanager_config_hash 2.6913785254066e+14
# HELP alertmanager_config_last_reload_success_timestamp_seconds Timestamp of the last successful configuration reload.
# TYPE alertmanager_config_last_reload_success_timestamp_seconds gauge
alertmanager_config_last_reload_success_timestamp_seconds 1.7076579723241663e+09
# HELP alertmanager_config_last_reload_successful Whether the last configuration reload attempt was successful.
# TYPE alertmanager_config_last_reload_successful gauge
alertmanager_config_last_reload_successful 1
# HELP alertmanager_dispatcher_aggregation_groups Number of active aggregation groups
# TYPE alertmanager_dispatcher_aggregation_groups gauge
alertmanager_dispatcher_aggregation_groups 0
# HELP alertmanager_dispatcher_alert_processing_duration_seconds Summary of latencies for the processing of alerts.
# TYPE alertmanager_dispatcher_alert_processing_duration_seconds summary
alertmanager_dispatcher_alert_processing_duration_seconds_sum 0
alertmanager_dispatcher_alert_processing_duration_seconds_count 0
# HELP alertmanager_http_concurrency_limit_exceeded_total Total number of times an HTTP request failed because the concurrency limit was reached.
# TYPE alertmanager_http_concurrency_limit_exceeded_total counter
alertmanager_http_concurrency_limit_exceeded_total{method="get"} 0
# HELP alertmanager_http_request_duration_seconds Histogram of latencies for HTTP requests.
# TYPE alertmanager_http_request_duration_seconds histogram
alertmanager_http_request_duration_seconds_bucket{handler="/",method="get",le="0.05"} 5
alertmanager_http_request_duration_seconds_bucket{handler="/",method="get",le="0.1"} 5
alertmanager_http_request_duration_seconds_bucket{handler="/",method="get",le="0.25"} 5
alertmanager_http_request_duration_seconds_bucket{handler="/",method="get",le="0.5"} 5
alertmanager_http_request_duration_seconds_bucket{handler="/",method="get",le="0.75"} 5
alertmanager_http_request_duration_seconds_bucket{handler="/",method="get",le="1"} 5
alertmanager_http_request_duration_seconds_bucket{handler="/",method="get",le="2"} 5
alertmanager_http_request_duration_seconds_bucket{handler="/",method="get",le="5"} 5
alertmanager_http_request_duration_seconds_bucket{handler="/",method="get",le="20"} 5
alertmanager_http_request_duration_seconds_bucket{handler="/",method="get",le="60"} 5
alertmanager_http_request_duration_seconds_bucket{handler="/",method="get",le="+Inf"} 5
alertmanager_http_request_duration_seconds_sum{handler="/",method="get"} 0.04409479
alertmanager_http_request_duration_seconds_count{handler="/",method="get"} 5
alertmanager_http_request_duration_seconds_bucket{handler="/alerts",method="post",le="0.05"} 2
alertmanager_http_request_duration_seconds_bucket{handler="/alerts",method="post",le="0.1"} 2
alertmanager_http_request_duration_seconds_bucket{handler="/alerts",method="post",le="0.25"} 2
alertmanager_http_request_duration_seconds_bucket{handler="/alerts",method="post",le="0.5"} 2
alertmanager_http_request_duration_seconds_bucket{handler="/alerts",method="post",le="0.75"} 2
alertmanager_http_request_duration_seconds_bucket{handler="/alerts",method="post",le="1"} 2
alertmanager_http_request_duration_seconds_bucket{handler="/alerts",method="post",le="2"} 2
alertmanager_http_request_duration_seconds_bucket{handler="/alerts",method="post",le="5"} 2
alertmanager_http_request_duration_seconds_bucket{handler="/alerts",method="post",le="20"} 2
alertmanager_http_request_duration_seconds_bucket{handler="/alerts",method="post",le="60"} 2
alertmanager_http_request_duration_seconds_bucket{handler="/alerts",method="post",le="+Inf"} 2
alertmanager_http_request_duration_seconds_sum{handler="/alerts",method="post"} 0.000438549
alertmanager_http_request_duration_seconds_count{handler="/alerts",method="post"} 2
alertmanager_http_request_duration_seconds_bucket{handler="/favicon.ico",method="get",le="0.05"} 3
alertmanager_http_request_duration_seconds_bucket{handler="/favicon.ico",method="get",le="0.1"} 3
alertmanager_http_request_duration_seconds_bucket{handler="/favicon.ico",method="get",le="0.25"} 3
alertmanager_http_request_duration_seconds_bucket{handler="/favicon.ico",method="get",le="0.5"} 3
alertmanager_http_request_duration_seconds_bucket{handler="/favicon.ico",method="get",le="0.75"} 3
alertmanager_http_request_duration_seconds_bucket{handler="/favicon.ico",method="get",le="1"} 3
alertmanager_http_request_duration_seconds_bucket{handler="/favicon.ico",method="get",le="2"} 3
alertmanager_http_request_duration_seconds_bucket{handler="/favicon.ico",method="get",le="5"} 3
alertmanager_http_request_duration_seconds_bucket{handler="/favicon.ico",method="get",le="20"} 3
alertmanager_http_request_duration_seconds_bucket{handler="/favicon.ico",method="get",le="60"} 3
alertmanager_http_request_duration_seconds_bucket{handler="/favicon.ico",method="get",le="+Inf"} 3
alertmanager_http_request_duration_seconds_sum{handler="/favicon.ico",method="get"} 0.0018690550000000001
alertmanager_http_request_duration_seconds_count{handler="/favicon.ico",method="get"} 3
alertmanager_http_request_duration_seconds_bucket{handler="/lib/*path",method="get",le="0.05"} 20
alertmanager_http_request_duration_seconds_bucket{handler="/lib/*path",method="get",le="0.1"} 20
alertmanager_http_request_duration_seconds_bucket{handler="/lib/*path",method="get",le="0.25"} 20
alertmanager_http_request_duration_seconds_bucket{handler="/lib/*path",method="get",le="0.5"} 20
alertmanager_http_request_duration_seconds_bucket{handler="/lib/*path",method="get",le="0.75"} 20
alertmanager_http_request_duration_seconds_bucket{handler="/lib/*path",method="get",le="1"} 20
alertmanager_http_request_duration_seconds_bucket{handler="/lib/*path",method="get",le="2"} 20
alertmanager_http_request_duration_seconds_bucket{handler="/lib/*path",method="get",le="5"} 20
alertmanager_http_request_duration_seconds_bucket{handler="/lib/*path",method="get",le="20"} 20
alertmanager_http_request_duration_seconds_bucket{handler="/lib/*path",method="get",le="60"} 20
alertmanager_http_request_duration_seconds_bucket{handler="/lib/*path",method="get",le="+Inf"} 20
alertmanager_http_request_duration_seconds_sum{handler="/lib/*path",method="get"} 0.029757111999999995
alertmanager_http_request_duration_seconds_count{handler="/lib/*path",method="get"} 20
alertmanager_http_request_duration_seconds_bucket{handler="/metrics",method="get",le="0.05"} 3
alertmanager_http_request_duration_seconds_bucket{handler="/metrics",method="get",le="0.1"} 3
alertmanager_http_request_duration_seconds_bucket{handler="/metrics",method="get",le="0.25"} 3
alertmanager_http_request_duration_seconds_bucket{handler="/metrics",method="get",le="0.5"} 3
alertmanager_http_request_duration_seconds_bucket{handler="/metrics",method="get",le="0.75"} 3
alertmanager_http_request_duration_seconds_bucket{handler="/metrics",method="get",le="1"} 3
alertmanager_http_request_duration_seconds_bucket{handler="/metrics",method="get",le="2"} 3
alertmanager_http_request_duration_seconds_bucket{handler="/metrics",method="get",le="5"} 3
alertmanager_http_request_duration_seconds_bucket{handler="/metrics",method="get",le="20"} 3
alertmanager_http_request_duration_seconds_bucket{handler="/metrics",method="get",le="60"} 3
alertmanager_http_request_duration_seconds_bucket{handler="/metrics",method="get",le="+Inf"} 3
alertmanager_http_request_duration_seconds_sum{handler="/metrics",method="get"} 0.006149267
alertmanager_http_request_duration_seconds_count{handler="/metrics",method="get"} 3
alertmanager_http_request_duration_seconds_bucket{handler="/script.js",method="get",le="0.05"} 5
alertmanager_http_request_duration_seconds_bucket{handler="/script.js",method="get",le="0.1"} 5
alertmanager_http_request_duration_seconds_bucket{handler="/script.js",method="get",le="0.25"} 5
alertmanager_http_request_duration_seconds_bucket{handler="/script.js",method="get",le="0.5"} 5
alertmanager_http_request_duration_seconds_bucket{handler="/script.js",method="get",le="0.75"} 5
alertmanager_http_request_duration_seconds_bucket{handler="/script.js",method="get",le="1"} 5
alertmanager_http_request_duration_seconds_bucket{handler="/script.js",method="get",le="2"} 5
alertmanager_http_request_duration_seconds_bucket{handler="/script.js",method="get",le="5"} 5
alertmanager_http_request_duration_seconds_bucket{handler="/script.js",method="get",le="20"} 5
alertmanager_http_request_duration_seconds_bucket{handler="/script.js",method="get",le="60"} 5
alertmanager_http_request_duration_seconds_bucket{handler="/script.js",method="get",le="+Inf"} 5
alertmanager_http_request_duration_seconds_sum{handler="/script.js",method="get"} 0.01638322
alertmanager_http_request_duration_seconds_count{handler="/script.js",method="get"} 5
# HELP alertmanager_http_requests_in_flight Current number of HTTP requests being processed.
# TYPE alertmanager_http_requests_in_flight gauge
alertmanager_http_requests_in_flight{method="get"} 1
# HELP alertmanager_http_response_size_bytes Histogram of response size for HTTP requests.
# TYPE alertmanager_http_response_size_bytes histogram
alertmanager_http_response_size_bytes_bucket{handler="/",method="get",le="100"} 0
alertmanager_http_response_size_bytes_bucket{handler="/",method="get",le="1000"} 0
alertmanager_http_response_size_bytes_bucket{handler="/",method="get",le="10000"} 5
alertmanager_http_response_size_bytes_bucket{handler="/",method="get",le="100000"} 5
alertmanager_http_response_size_bytes_bucket{handler="/",method="get",le="1e+06"} 5
alertmanager_http_response_size_bytes_bucket{handler="/",method="get",le="1e+07"} 5
alertmanager_http_response_size_bytes_bucket{handler="/",method="get",le="1e+08"} 5
alertmanager_http_response_size_bytes_bucket{handler="/",method="get",le="+Inf"} 5
alertmanager_http_response_size_bytes_sum{handler="/",method="get"} 8270
alertmanager_http_response_size_bytes_count{handler="/",method="get"} 5
alertmanager_http_response_size_bytes_bucket{handler="/alerts",method="post",le="100"} 2
alertmanager_http_response_size_bytes_bucket{handler="/alerts",method="post",le="1000"} 2
alertmanager_http_response_size_bytes_bucket{handler="/alerts",method="post",le="10000"} 2
alertmanager_http_response_size_bytes_bucket{handler="/alerts",method="post",le="100000"} 2
alertmanager_http_response_size_bytes_bucket{handler="/alerts",method="post",le="1e+06"} 2
alertmanager_http_response_size_bytes_bucket{handler="/alerts",method="post",le="1e+07"} 2
alertmanager_http_response_size_bytes_bucket{handler="/alerts",method="post",le="1e+08"} 2
alertmanager_http_response_size_bytes_bucket{handler="/alerts",method="post",le="+Inf"} 2
alertmanager_http_response_size_bytes_sum{handler="/alerts",method="post"} 40
alertmanager_http_response_size_bytes_count{handler="/alerts",method="post"} 2
alertmanager_http_response_size_bytes_bucket{handler="/favicon.ico",method="get",le="100"} 0
alertmanager_http_response_size_bytes_bucket{handler="/favicon.ico",method="get",le="1000"} 0
alertmanager_http_response_size_bytes_bucket{handler="/favicon.ico",method="get",le="10000"} 0
alertmanager_http_response_size_bytes_bucket{handler="/favicon.ico",method="get",le="100000"} 3
alertmanager_http_response_size_bytes_bucket{handler="/favicon.ico",method="get",le="1e+06"} 3
alertmanager_http_response_size_bytes_bucket{handler="/favicon.ico",method="get",le="1e+07"} 3
alertmanager_http_response_size_bytes_bucket{handler="/favicon.ico",method="get",le="1e+08"} 3
alertmanager_http_response_size_bytes_bucket{handler="/favicon.ico",method="get",le="+Inf"} 3
alertmanager_http_response_size_bytes_sum{handler="/favicon.ico",method="get"} 45258
alertmanager_http_response_size_bytes_count{handler="/favicon.ico",method="get"} 3
alertmanager_http_response_size_bytes_bucket{handler="/lib/*path",method="get",le="100"} 0
alertmanager_http_response_size_bytes_bucket{handler="/lib/*path",method="get",le="1000"} 0
alertmanager_http_response_size_bytes_bucket{handler="/lib/*path",method="get",le="10000"} 5
alertmanager_http_response_size_bytes_bucket{handler="/lib/*path",method="get",le="100000"} 15
alertmanager_http_response_size_bytes_bucket{handler="/lib/*path",method="get",le="1e+06"} 20
alertmanager_http_response_size_bytes_bucket{handler="/lib/*path",method="get",le="1e+07"} 20
alertmanager_http_response_size_bytes_bucket{handler="/lib/*path",method="get",le="1e+08"} 20
alertmanager_http_response_size_bytes_bucket{handler="/lib/*path",method="get",le="+Inf"} 20
alertmanager_http_response_size_bytes_sum{handler="/lib/*path",method="get"} 1.306205e+06
alertmanager_http_response_size_bytes_count{handler="/lib/*path",method="get"} 20
alertmanager_http_response_size_bytes_bucket{handler="/metrics",method="get",le="100"} 0
alertmanager_http_response_size_bytes_bucket{handler="/metrics",method="get",le="1000"} 0
alertmanager_http_response_size_bytes_bucket{handler="/metrics",method="get",le="10000"} 3
alertmanager_http_response_size_bytes_bucket{handler="/metrics",method="get",le="100000"} 3
alertmanager_http_response_size_bytes_bucket{handler="/metrics",method="get",le="1e+06"} 3
alertmanager_http_response_size_bytes_bucket{handler="/metrics",method="get",le="1e+07"} 3
alertmanager_http_response_size_bytes_bucket{handler="/metrics",method="get",le="1e+08"} 3
alertmanager_http_response_size_bytes_bucket{handler="/metrics",method="get",le="+Inf"} 3
alertmanager_http_response_size_bytes_sum{handler="/metrics",method="get"} 16537
alertmanager_http_response_size_bytes_count{handler="/metrics",method="get"} 3
alertmanager_http_response_size_bytes_bucket{handler="/script.js",method="get",le="100"} 0
alertmanager_http_response_size_bytes_bucket{handler="/script.js",method="get",le="1000"} 0
alertmanager_http_response_size_bytes_bucket{handler="/script.js",method="get",le="10000"} 0
alertmanager_http_response_size_bytes_bucket{handler="/script.js",method="get",le="100000"} 0
alertmanager_http_response_size_bytes_bucket{handler="/script.js",method="get",le="1e+06"} 5
alertmanager_http_response_size_bytes_bucket{handler="/script.js",method="get",le="1e+07"} 5
alertmanager_http_response_size_bytes_bucket{handler="/script.js",method="get",le="1e+08"} 5
alertmanager_http_response_size_bytes_bucket{handler="/script.js",method="get",le="+Inf"} 5
alertmanager_http_response_size_bytes_sum{handler="/script.js",method="get"} 551050
alertmanager_http_response_size_bytes_count{handler="/script.js",method="get"} 5
# HELP alertmanager_integrations Number of configured integrations.
# TYPE alertmanager_integrations gauge
alertmanager_integrations 1
# HELP alertmanager_marked_alerts How many alerts by state are currently marked in the Alertmanager regardless of their expiry.
# TYPE alertmanager_marked_alerts gauge
alertmanager_marked_alerts{state="active"} 0
alertmanager_marked_alerts{state="suppressed"} 0
alertmanager_marked_alerts{state="unprocessed"} 0
# HELP alertmanager_nflog_gc_duration_seconds Duration of the last notification log garbage collection cycle.
# TYPE alertmanager_nflog_gc_duration_seconds summary
alertmanager_nflog_gc_duration_seconds_sum 5.37e-07
alertmanager_nflog_gc_duration_seconds_count 1
# HELP alertmanager_nflog_gossip_messages_propagated_total Number of received gossip messages that have been further gossiped.
# TYPE alertmanager_nflog_gossip_messages_propagated_total counter
alertmanager_nflog_gossip_messages_propagated_total 0
# HELP alertmanager_nflog_maintenance_errors_total How many maintenances were executed for the notification log that failed.
# TYPE alertmanager_nflog_maintenance_errors_total counter
alertmanager_nflog_maintenance_errors_total 0
# HELP alertmanager_nflog_maintenance_total How many maintenances were executed for the notification log.
# TYPE alertmanager_nflog_maintenance_total counter
alertmanager_nflog_maintenance_total 1
# HELP alertmanager_nflog_queries_total Number of notification log queries were received.
# TYPE alertmanager_nflog_queries_total counter
alertmanager_nflog_queries_total 0
# HELP alertmanager_nflog_query_duration_seconds Duration of notification log query evaluation.
# TYPE alertmanager_nflog_query_duration_seconds histogram
alertmanager_nflog_query_duration_seconds_bucket{le="0.005"} 0
alertmanager_nflog_query_duration_seconds_bucket{le="0.01"} 0
alertmanager_nflog_query_duration_seconds_bucket{le="0.025"} 0
alertmanager_nflog_query_duration_seconds_bucket{le="0.05"} 0
alertmanager_nflog_query_duration_seconds_bucket{le="0.1"} 0
alertmanager_nflog_query_duration_seconds_bucket{le="0.25"} 0
alertmanager_nflog_query_duration_seconds_bucket{le="0.5"} 0
alertmanager_nflog_query_duration_seconds_bucket{le="1"} 0
alertmanager_nflog_query_duration_seconds_bucket{le="2.5"} 0
alertmanager_nflog_query_duration_seconds_bucket{le="5"} 0
alertmanager_nflog_query_duration_seconds_bucket{le="10"} 0
alertmanager_nflog_query_duration_seconds_bucket{le="+Inf"} 0
alertmanager_nflog_query_duration_seconds_sum 0
alertmanager_nflog_query_duration_seconds_count 0
# HELP alertmanager_nflog_query_errors_total Number notification log received queries that failed.
# TYPE alertmanager_nflog_query_errors_total counter
alertmanager_nflog_query_errors_total 0
# HELP alertmanager_nflog_snapshot_duration_seconds Duration of the last notification log snapshot.
# TYPE alertmanager_nflog_snapshot_duration_seconds summary
alertmanager_nflog_snapshot_duration_seconds_sum 1.8017e-05
alertmanager_nflog_snapshot_duration_seconds_count 1
# HELP alertmanager_nflog_snapshot_size_bytes Size of the last notification log snapshot in bytes.
# TYPE alertmanager_nflog_snapshot_size_bytes gauge
alertmanager_nflog_snapshot_size_bytes 0
# HELP alertmanager_notification_latency_seconds The latency of notifications in seconds.
# TYPE alertmanager_notification_latency_seconds histogram
alertmanager_notification_latency_seconds_bucket{integration="email",le="1"} 0
alertmanager_notification_latency_seconds_bucket{integration="email",le="5"} 0
alertmanager_notification_latency_seconds_bucket{integration="email",le="10"} 0
alertmanager_notification_latency_seconds_bucket{integration="email",le="15"} 0
alertmanager_notification_latency_seconds_bucket{integration="email",le="20"} 0
alertmanager_notification_latency_seconds_bucket{integration="email",le="+Inf"} 0
alertmanager_notification_latency_seconds_sum{integration="email"} 0
alertmanager_notification_latency_seconds_count{integration="email"} 0
alertmanager_notification_latency_seconds_bucket{integration="msteams",le="1"} 0
alertmanager_notification_latency_seconds_bucket{integration="msteams",le="5"} 0
alertmanager_notification_latency_seconds_bucket{integration="msteams",le="10"} 0
alertmanager_notification_latency_seconds_bucket{integration="msteams",le="15"} 0
alertmanager_notification_latency_seconds_bucket{integration="msteams",le="20"} 0
alertmanager_notification_latency_seconds_bucket{integration="msteams",le="+Inf"} 0
alertmanager_notification_latency_seconds_sum{integration="msteams"} 0
alertmanager_notification_latency_seconds_count{integration="msteams"} 0
alertmanager_notification_latency_seconds_bucket{integration="opsgenie",le="1"} 0
alertmanager_notification_latency_seconds_bucket{integration="opsgenie",le="5"} 0
alertmanager_notification_latency_seconds_bucket{integration="opsgenie",le="10"} 0
alertmanager_notification_latency_seconds_bucket{integration="opsgenie",le="15"} 0
alertmanager_notification_latency_seconds_bucket{integration="opsgenie",le="20"} 0
alertmanager_notification_latency_seconds_bucket{integration="opsgenie",le="+Inf"} 0
alertmanager_notification_latency_seconds_sum{integration="opsgenie"} 0
alertmanager_notification_latency_seconds_count{integration="opsgenie"} 0
alertmanager_notification_latency_seconds_bucket{integration="pagerduty",le="1"} 0
alertmanager_notification_latency_seconds_bucket{integration="pagerduty",le="5"} 0
alertmanager_notification_latency_seconds_bucket{integration="pagerduty",le="10"} 0
alertmanager_notification_latency_seconds_bucket{integration="pagerduty",le="15"} 0
alertmanager_notification_latency_seconds_bucket{integration="pagerduty",le="20"} 0
alertmanager_notification_latency_seconds_bucket{integration="pagerduty",le="+Inf"} 0
alertmanager_notification_latency_seconds_sum{integration="pagerduty"} 0
alertmanager_notification_latency_seconds_count{integration="pagerduty"} 0
alertmanager_notification_latency_seconds_bucket{integration="pushover",le="1"} 0
alertmanager_notification_latency_seconds_bucket{integration="pushover",le="5"} 0
alertmanager_notification_latency_seconds_bucket{integration="pushover",le="10"} 0
alertmanager_notification_latency_seconds_bucket{integration="pushover",le="15"} 0
alertmanager_notification_latency_seconds_bucket{integration="pushover",le="20"} 0
alertmanager_notification_latency_seconds_bucket{integration="pushover",le="+Inf"} 0
alertmanager_notification_latency_seconds_sum{integration="pushover"} 0
alertmanager_notification_latency_seconds_count{integration="pushover"} 0
alertmanager_notification_latency_seconds_bucket{integration="slack",le="1"} 0
alertmanager_notification_latency_seconds_bucket{integration="slack",le="5"} 0
alertmanager_notification_latency_seconds_bucket{integration="slack",le="10"} 0
alertmanager_notification_latency_seconds_bucket{integration="slack",le="15"} 0
alertmanager_notification_latency_seconds_bucket{integration="slack",le="20"} 0
alertmanager_notification_latency_seconds_bucket{integration="slack",le="+Inf"} 0
alertmanager_notification_latency_seconds_sum{integration="slack"} 0
alertmanager_notification_latency_seconds_count{integration="slack"} 0
alertmanager_notification_latency_seconds_bucket{integration="sns",le="1"} 0
alertmanager_notification_latency_seconds_bucket{integration="sns",le="5"} 0
alertmanager_notification_latency_seconds_bucket{integration="sns",le="10"} 0
alertmanager_notification_latency_seconds_bucket{integration="sns",le="15"} 0
alertmanager_notification_latency_seconds_bucket{integration="sns",le="20"} 0
alertmanager_notification_latency_seconds_bucket{integration="sns",le="+Inf"} 0
alertmanager_notification_latency_seconds_sum{integration="sns"} 0
alertmanager_notification_latency_seconds_count{integration="sns"} 0
alertmanager_notification_latency_seconds_bucket{integration="telegram",le="1"} 0
alertmanager_notification_latency_seconds_bucket{integration="telegram",le="5"} 0
alertmanager_notification_latency_seconds_bucket{integration="telegram",le="10"} 0
alertmanager_notification_latency_seconds_bucket{integration="telegram",le="15"} 0
alertmanager_notification_latency_seconds_bucket{integration="telegram",le="20"} 0
alertmanager_notification_latency_seconds_bucket{integration="telegram",le="+Inf"} 0
alertmanager_notification_latency_seconds_sum{integration="telegram"} 0
alertmanager_notification_latency_seconds_count{integration="telegram"} 0
alertmanager_notification_latency_seconds_bucket{integration="victorops",le="1"} 0
alertmanager_notification_latency_seconds_bucket{integration="victorops",le="5"} 0
alertmanager_notification_latency_seconds_bucket{integration="victorops",le="10"} 0
alertmanager_notification_latency_seconds_bucket{integration="victorops",le="15"} 0
alertmanager_notification_latency_seconds_bucket{integration="victorops",le="20"} 0
alertmanager_notification_latency_seconds_bucket{integration="victorops",le="+Inf"} 0
alertmanager_notification_latency_seconds_sum{integration="victorops"} 0
alertmanager_notification_latency_seconds_count{integration="victorops"} 0
alertmanager_notification_latency_seconds_bucket{integration="webhook",le="1"} 0
alertmanager_notification_latency_seconds_bucket{integration="webhook",le="5"} 0
alertmanager_notification_latency_seconds_bucket{integration="webhook",le="10"} 0
alertmanager_notification_latency_seconds_bucket{integration="webhook",le="15"} 0
alertmanager_notification_latency_seconds_bucket{integration="webhook",le="20"} 0
alertmanager_notification_latency_seconds_bucket{integration="webhook",le="+Inf"} 0
alertmanager_notification_latency_seconds_sum{integration="webhook"} 0
alertmanager_notification_latency_seconds_count{integration="webhook"} 0
alertmanager_notification_latency_seconds_bucket{integration="wechat",le="1"} 0
alertmanager_notification_latency_seconds_bucket{integration="wechat",le="5"} 0
alertmanager_notification_latency_seconds_bucket{integration="wechat",le="10"} 0
alertmanager_notification_latency_seconds_bucket{integration="wechat",le="15"} 0
alertmanager_notification_latency_seconds_bucket{integration="wechat",le="20"} 0
alertmanager_notification_latency_seconds_bucket{integration="wechat",le="+Inf"} 0
alertmanager_notification_latency_seconds_sum{integration="wechat"} 0
alertmanager_notification_latency_seconds_count{integration="wechat"} 0
# HELP alertmanager_notification_requests_failed_total The total number of failed notification requests.
# TYPE alertmanager_notification_requests_failed_total counter
alertmanager_notification_requests_failed_total{integration="email"} 0
alertmanager_notification_requests_failed_total{integration="msteams"} 0
alertmanager_notification_requests_failed_total{integration="opsgenie"} 0
alertmanager_notification_requests_failed_total{integration="pagerduty"} 0
alertmanager_notification_requests_failed_total{integration="pushover"} 0
alertmanager_notification_requests_failed_total{integration="slack"} 0
alertmanager_notification_requests_failed_total{integration="sns"} 0
alertmanager_notification_requests_failed_total{integration="telegram"} 0
alertmanager_notification_requests_failed_total{integration="victorops"} 0
alertmanager_notification_requests_failed_total{integration="webhook"} 0
alertmanager_notification_requests_failed_total{integration="wechat"} 0
# HELP alertmanager_notification_requests_total The total number of attempted notification requests.
# TYPE alertmanager_notification_requests_total counter
alertmanager_notification_requests_total{integration="email"} 0
alertmanager_notification_requests_total{integration="msteams"} 0
alertmanager_notification_requests_total{integration="opsgenie"} 0
alertmanager_notification_requests_total{integration="pagerduty"} 0
alertmanager_notification_requests_total{integration="pushover"} 0
alertmanager_notification_requests_total{integration="slack"} 0
alertmanager_notification_requests_total{integration="sns"} 0
alertmanager_notification_requests_total{integration="telegram"} 0
alertmanager_notification_requests_total{integration="victorops"} 0
alertmanager_notification_requests_total{integration="webhook"} 0
alertmanager_notification_requests_total{integration="wechat"} 0
# HELP alertmanager_notifications_failed_total The total number of failed notifications.
# TYPE alertmanager_notifications_failed_total counter
alertmanager_notifications_failed_total{integration="email",reason="clientError"} 0
alertmanager_notifications_failed_total{integration="email",reason="other"} 0
alertmanager_notifications_failed_total{integration="email",reason="serverError"} 0
alertmanager_notifications_failed_total{integration="msteams",reason="clientError"} 0
alertmanager_notifications_failed_total{integration="msteams",reason="other"} 0
alertmanager_notifications_failed_total{integration="msteams",reason="serverError"} 0
alertmanager_notifications_failed_total{integration="opsgenie",reason="clientError"} 0
alertmanager_notifications_failed_total{integration="opsgenie",reason="other"} 0
alertmanager_notifications_failed_total{integration="opsgenie",reason="serverError"} 0
alertmanager_notifications_failed_total{integration="pagerduty",reason="clientError"} 0
alertmanager_notifications_failed_total{integration="pagerduty",reason="other"} 0
alertmanager_notifications_failed_total{integration="pagerduty",reason="serverError"} 0
alertmanager_notifications_failed_total{integration="pushover",reason="clientError"} 0
alertmanager_notifications_failed_total{integration="pushover",reason="other"} 0
alertmanager_notifications_failed_total{integration="pushover",reason="serverError"} 0
alertmanager_notifications_failed_total{integration="slack",reason="clientError"} 0
alertmanager_notifications_failed_total{integration="slack",reason="other"} 0
alertmanager_notifications_failed_total{integration="slack",reason="serverError"} 0
alertmanager_notifications_failed_total{integration="sns",reason="clientError"} 0
alertmanager_notifications_failed_total{integration="sns",reason="other"} 0
alertmanager_notifications_failed_total{integration="sns",reason="serverError"} 0
alertmanager_notifications_failed_total{integration="telegram",reason="clientError"} 0
alertmanager_notifications_failed_total{integration="telegram",reason="other"} 0
alertmanager_notifications_failed_total{integration="telegram",reason="serverError"} 0
alertmanager_notifications_failed_total{integration="victorops",reason="clientError"} 0
alertmanager_notifications_failed_total{integration="victorops",reason="other"} 0
alertmanager_notifications_failed_total{integration="victorops",reason="serverError"} 0
alertmanager_notifications_failed_total{integration="webhook",reason="clientError"} 0
alertmanager_notifications_failed_total{integration="webhook",reason="other"} 0
alertmanager_notifications_failed_total{integration="webhook",reason="serverError"} 0
alertmanager_notifications_failed_total{integration="wechat",reason="clientError"} 0
alertmanager_notifications_failed_total{integration="wechat",reason="other"} 0
alertmanager_notifications_failed_total{integration="wechat",reason="serverError"} 0
# HELP alertmanager_notifications_total The total number of attempted notifications.
# TYPE alertmanager_notifications_total counter
alertmanager_notifications_total{integration="email"} 0
alertmanager_notifications_total{integration="msteams"} 0
alertmanager_notifications_total{integration="opsgenie"} 0
alertmanager_notifications_total{integration="pagerduty"} 0
alertmanager_notifications_total{integration="pushover"} 0
alertmanager_notifications_total{integration="slack"} 0
alertmanager_notifications_total{integration="sns"} 0
alertmanager_notifications_total{integration="telegram"} 0
alertmanager_notifications_total{integration="victorops"} 0
alertmanager_notifications_total{integration="webhook"} 0
alertmanager_notifications_total{integration="wechat"} 0
# HELP alertmanager_oversize_gossip_message_duration_seconds Duration of oversized gossip message requests.
# TYPE alertmanager_oversize_gossip_message_duration_seconds histogram
alertmanager_oversize_gossip_message_duration_seconds_bucket{key="nfl",le="0.005"} 0
alertmanager_oversize_gossip_message_duration_seconds_bucket{key="nfl",le="0.01"} 0
alertmanager_oversize_gossip_message_duration_seconds_bucket{key="nfl",le="0.025"} 0
alertmanager_oversize_gossip_message_duration_seconds_bucket{key="nfl",le="0.05"} 0
alertmanager_oversize_gossip_message_duration_seconds_bucket{key="nfl",le="0.1"} 0
alertmanager_oversize_gossip_message_duration_seconds_bucket{key="nfl",le="0.25"} 0
alertmanager_oversize_gossip_message_duration_seconds_bucket{key="nfl",le="0.5"} 0
alertmanager_oversize_gossip_message_duration_seconds_bucket{key="nfl",le="1"} 0
alertmanager_oversize_gossip_message_duration_seconds_bucket{key="nfl",le="2.5"} 0
alertmanager_oversize_gossip_message_duration_seconds_bucket{key="nfl",le="5"} 0
alertmanager_oversize_gossip_message_duration_seconds_bucket{key="nfl",le="10"} 0
alertmanager_oversize_gossip_message_duration_seconds_bucket{key="nfl",le="+Inf"} 0
alertmanager_oversize_gossip_message_duration_seconds_sum{key="nfl"} 0
alertmanager_oversize_gossip_message_duration_seconds_count{key="nfl"} 0
alertmanager_oversize_gossip_message_duration_seconds_bucket{key="sil",le="0.005"} 0
alertmanager_oversize_gossip_message_duration_seconds_bucket{key="sil",le="0.01"} 0
alertmanager_oversize_gossip_message_duration_seconds_bucket{key="sil",le="0.025"} 0
alertmanager_oversize_gossip_message_duration_seconds_bucket{key="sil",le="0.05"} 0
alertmanager_oversize_gossip_message_duration_seconds_bucket{key="sil",le="0.1"} 0
alertmanager_oversize_gossip_message_duration_seconds_bucket{key="sil",le="0.25"} 0
alertmanager_oversize_gossip_message_duration_seconds_bucket{key="sil",le="0.5"} 0
alertmanager_oversize_gossip_message_duration_seconds_bucket{key="sil",le="1"} 0
alertmanager_oversize_gossip_message_duration_seconds_bucket{key="sil",le="2.5"} 0
alertmanager_oversize_gossip_message_duration_seconds_bucket{key="sil",le="5"} 0
alertmanager_oversize_gossip_message_duration_seconds_bucket{key="sil",le="10"} 0
alertmanager_oversize_gossip_message_duration_seconds_bucket{key="sil",le="+Inf"} 0
alertmanager_oversize_gossip_message_duration_seconds_sum{key="sil"} 0
alertmanager_oversize_gossip_message_duration_seconds_count{key="sil"} 0
# HELP alertmanager_oversized_gossip_message_dropped_total Number of oversized gossip messages that were dropped due to a full message queue.
# TYPE alertmanager_oversized_gossip_message_dropped_total counter
alertmanager_oversized_gossip_message_dropped_total{key="nfl"} 0
alertmanager_oversized_gossip_message_dropped_total{key="sil"} 0
# HELP alertmanager_oversized_gossip_message_failure_total Number of oversized gossip message sends that failed.
# TYPE alertmanager_oversized_gossip_message_failure_total counter
alertmanager_oversized_gossip_message_failure_total{key="nfl"} 0
alertmanager_oversized_gossip_message_failure_total{key="sil"} 0
# HELP alertmanager_oversized_gossip_message_sent_total Number of oversized gossip message sent.
# TYPE alertmanager_oversized_gossip_message_sent_total counter
alertmanager_oversized_gossip_message_sent_total{key="nfl"} 0
alertmanager_oversized_gossip_message_sent_total{key="sil"} 0
# HELP alertmanager_peer_position Position the Alertmanager instance believes it's in. The position determines a peer's behavior in the cluster.
# TYPE alertmanager_peer_position gauge
alertmanager_peer_position 0
# HELP alertmanager_receivers Number of configured receivers.
# TYPE alertmanager_receivers gauge
alertmanager_receivers 1
# HELP alertmanager_silences How many silences by state.
# TYPE alertmanager_silences gauge
alertmanager_silences{state="active"} 0
alertmanager_silences{state="expired"} 0
alertmanager_silences{state="pending"} 0
# HELP alertmanager_silences_gc_duration_seconds Duration of the last silence garbage collection cycle.
# TYPE alertmanager_silences_gc_duration_seconds summary
alertmanager_silences_gc_duration_seconds_sum 1.421e-06
alertmanager_silences_gc_duration_seconds_count 1
# HELP alertmanager_silences_gossip_messages_propagated_total Number of received gossip messages that have been further gossiped.
# TYPE alertmanager_silences_gossip_messages_propagated_total counter
alertmanager_silences_gossip_messages_propagated_total 0
# HELP alertmanager_silences_maintenance_errors_total How many maintenances were executed for silences that failed.
# TYPE alertmanager_silences_maintenance_errors_total counter
alertmanager_silences_maintenance_errors_total 0
# HELP alertmanager_silences_maintenance_total How many maintenances were executed for silences.
# TYPE alertmanager_silences_maintenance_total counter
alertmanager_silences_maintenance_total 1
# HELP alertmanager_silences_queries_total How many silence queries were received.
# TYPE alertmanager_silences_queries_total counter
alertmanager_silences_queries_total 16
# HELP alertmanager_silences_query_duration_seconds Duration of silence query evaluation.
# TYPE alertmanager_silences_query_duration_seconds histogram
alertmanager_silences_query_duration_seconds_bucket{le="0.005"} 13
alertmanager_silences_query_duration_seconds_bucket{le="0.01"} 13
alertmanager_silences_query_duration_seconds_bucket{le="0.025"} 13
alertmanager_silences_query_duration_seconds_bucket{le="0.05"} 13
alertmanager_silences_query_duration_seconds_bucket{le="0.1"} 13
alertmanager_silences_query_duration_seconds_bucket{le="0.25"} 13
alertmanager_silences_query_duration_seconds_bucket{le="0.5"} 13
alertmanager_silences_query_duration_seconds_bucket{le="1"} 13
alertmanager_silences_query_duration_seconds_bucket{le="2.5"} 13
alertmanager_silences_query_duration_seconds_bucket{le="5"} 13
alertmanager_silences_query_duration_seconds_bucket{le="10"} 13
alertmanager_silences_query_duration_seconds_bucket{le="+Inf"} 13
alertmanager_silences_query_duration_seconds_sum 3.3388e-05
alertmanager_silences_query_duration_seconds_count 13
# HELP alertmanager_silences_query_errors_total How many silence received queries did not succeed.
# TYPE alertmanager_silences_query_errors_total counter
alertmanager_silences_query_errors_total 0
# HELP alertmanager_silences_snapshot_duration_seconds Duration of the last silence snapshot.
# TYPE alertmanager_silences_snapshot_duration_seconds summary
alertmanager_silences_snapshot_duration_seconds_sum 4.817e-06
alertmanager_silences_snapshot_duration_seconds_count 1
# HELP alertmanager_silences_snapshot_size_bytes Size of the last silence snapshot in bytes.
# TYPE alertmanager_silences_snapshot_size_bytes gauge
alertmanager_silences_snapshot_size_bytes 0
# HELP go_gc_duration_seconds A summary of the pause duration of garbage collection cycles.
# TYPE go_gc_duration_seconds summary
go_gc_duration_seconds{quantile="0"} 6.6062e-05
go_gc_duration_seconds{quantile="0.25"} 8.594e-05
go_gc_duration_seconds{quantile="0.5"} 0.000157875
go_gc_duration_seconds{quantile="0.75"} 0.00022753
go_gc_duration_seconds{quantile="1"} 0.000495779
go_gc_duration_seconds_sum 0.002599715
go_gc_duration_seconds_count 14
# HELP go_goroutines Number of goroutines that currently exist.
# TYPE go_goroutines gauge
go_goroutines 33
# HELP go_info Information about the Go environment.
# TYPE go_info gauge
go_info{version="go1.20.7"} 1
# HELP go_memstats_alloc_bytes Number of bytes allocated and still in use.
# TYPE go_memstats_alloc_bytes gauge
go_memstats_alloc_bytes 8.579632e+06
# HELP go_memstats_alloc_bytes_total Total number of bytes allocated, even if freed.
# TYPE go_memstats_alloc_bytes_total counter
go_memstats_alloc_bytes_total 2.3776552e+07
# HELP go_memstats_buck_hash_sys_bytes Number of bytes used by the profiling bucket hash table.
# TYPE go_memstats_buck_hash_sys_bytes gauge
go_memstats_buck_hash_sys_bytes 1.459904e+06
# HELP go_memstats_frees_total Total number of frees.
# TYPE go_memstats_frees_total counter
go_memstats_frees_total 144509
# HELP go_memstats_gc_sys_bytes Number of bytes used for garbage collection system metadata.
# TYPE go_memstats_gc_sys_bytes gauge
go_memstats_gc_sys_bytes 8.607616e+06
# HELP go_memstats_heap_alloc_bytes Number of heap bytes allocated and still in use.
# TYPE go_memstats_heap_alloc_bytes gauge
go_memstats_heap_alloc_bytes 8.579632e+06
# HELP go_memstats_heap_idle_bytes Number of heap bytes waiting to be used.
# TYPE go_memstats_heap_idle_bytes gauge
go_memstats_heap_idle_bytes 4.407296e+06
# HELP go_memstats_heap_inuse_bytes Number of heap bytes that are in use.
# TYPE go_memstats_heap_inuse_bytes gauge
go_memstats_heap_inuse_bytes 1.1845632e+07
# HELP go_memstats_heap_objects Number of allocated objects.
# TYPE go_memstats_heap_objects gauge
go_memstats_heap_objects 50067
# HELP go_memstats_heap_released_bytes Number of heap bytes released to OS.
# TYPE go_memstats_heap_released_bytes gauge
go_memstats_heap_released_bytes 4.112384e+06
# HELP go_memstats_heap_sys_bytes Number of heap bytes obtained from system.
# TYPE go_memstats_heap_sys_bytes gauge
go_memstats_heap_sys_bytes 1.6252928e+07
# HELP go_memstats_last_gc_time_seconds Number of seconds since 1970 of last garbage collection.
# TYPE go_memstats_last_gc_time_seconds gauge
go_memstats_last_gc_time_seconds 1.7076591024133735e+09
# HELP go_memstats_lookups_total Total number of pointer lookups.
# TYPE go_memstats_lookups_total counter
go_memstats_lookups_total 0
# HELP go_memstats_mallocs_total Total number of mallocs.
# TYPE go_memstats_mallocs_total counter
go_memstats_mallocs_total 194576
# HELP go_memstats_mcache_inuse_bytes Number of bytes in use by mcache structures.
# TYPE go_memstats_mcache_inuse_bytes gauge
go_memstats_mcache_inuse_bytes 2400
# HELP go_memstats_mcache_sys_bytes Number of bytes used for mcache structures obtained from system.
# TYPE go_memstats_mcache_sys_bytes gauge
go_memstats_mcache_sys_bytes 15600
# HELP go_memstats_mspan_inuse_bytes Number of bytes in use by mspan structures.
# TYPE go_memstats_mspan_inuse_bytes gauge
go_memstats_mspan_inuse_bytes 185120
# HELP go_memstats_mspan_sys_bytes Number of bytes used for mspan structures obtained from system.
# TYPE go_memstats_mspan_sys_bytes gauge
go_memstats_mspan_sys_bytes 195840
# HELP go_memstats_next_gc_bytes Number of heap bytes when next garbage collection will take place.
# TYPE go_memstats_next_gc_bytes gauge
go_memstats_next_gc_bytes 1.4392264e+07
# HELP go_memstats_other_sys_bytes Number of bytes used for other system allocations.
# TYPE go_memstats_other_sys_bytes gauge
go_memstats_other_sys_bytes 597208
# HELP go_memstats_stack_inuse_bytes Number of bytes in use by the stack allocator.
# TYPE go_memstats_stack_inuse_bytes gauge
go_memstats_stack_inuse_bytes 524288
# HELP go_memstats_stack_sys_bytes Number of bytes obtained from system for stack allocator.
# TYPE go_memstats_stack_sys_bytes gauge
go_memstats_stack_sys_bytes 524288
# HELP go_memstats_sys_bytes Number of bytes obtained from system.
# TYPE go_memstats_sys_bytes gauge
go_memstats_sys_bytes 2.7653384e+07
# HELP go_threads Number of OS threads created.
# TYPE go_threads gauge
go_threads 7
# HELP net_conntrack_dialer_conn_attempted_total Total number of connections attempted by the given dialer a given name.
# TYPE net_conntrack_dialer_conn_attempted_total counter
net_conntrack_dialer_conn_attempted_total{dialer_name="webhook"} 0
# HELP net_conntrack_dialer_conn_closed_total Total number of connections closed which originated from the dialer of a given name.
# TYPE net_conntrack_dialer_conn_closed_total counter
net_conntrack_dialer_conn_closed_total{dialer_name="webhook"} 0
# HELP net_conntrack_dialer_conn_established_total Total number of connections successfully established by the given dialer a given name.
# TYPE net_conntrack_dialer_conn_established_total counter
net_conntrack_dialer_conn_established_total{dialer_name="webhook"} 0
# HELP net_conntrack_dialer_conn_failed_total Total number of connections failed to dial by the dialer a given name.
# TYPE net_conntrack_dialer_conn_failed_total counter
net_conntrack_dialer_conn_failed_total{dialer_name="webhook",reason="refused"} 0
net_conntrack_dialer_conn_failed_total{dialer_name="webhook",reason="resolution"} 0
net_conntrack_dialer_conn_failed_total{dialer_name="webhook",reason="timeout"} 0
net_conntrack_dialer_conn_failed_total{dialer_name="webhook",reason="unknown"} 0
# HELP process_cpu_seconds_total Total user and system CPU time spent in seconds.
# TYPE process_cpu_seconds_total counter
process_cpu_seconds_total 1.46
# HELP process_max_fds Maximum number of open file descriptors.
# TYPE process_max_fds gauge
process_max_fds 4096
# HELP process_open_fds Number of open file descriptors.
# TYPE process_open_fds gauge
process_open_fds 13
# HELP process_resident_memory_bytes Resident memory size in bytes.
# TYPE process_resident_memory_bytes gauge
process_resident_memory_bytes 3.2780288e+07
# HELP process_start_time_seconds Start time of the process since unix epoch in seconds.
# TYPE process_start_time_seconds gauge
process_start_time_seconds 1.70765797104e+09
# HELP process_virtual_memory_bytes Virtual memory size in bytes.
# TYPE process_virtual_memory_bytes gauge
process_virtual_memory_bytes 7.55372032e+08
# HELP process_virtual_memory_max_bytes Maximum amount of virtual memory available in bytes.
# TYPE process_virtual_memory_max_bytes gauge
process_virtual_memory_max_bytes 1.8446744073709552e+19
# HELP promhttp_metric_handler_requests_in_flight Current number of scrapes being served.
# TYPE promhttp_metric_handler_requests_in_flight gauge
promhttp_metric_handler_requests_in_flight 1
# HELP promhttp_metric_handler_requests_total Total number of scrapes by HTTP status code.
# TYPE promhttp_metric_handler_requests_total counter
promhttp_metric_handler_requests_total{code="200"} 3
promhttp_metric_handler_requests_total{code="500"} 0
promhttp_metric_handler_requests_total{code="503"} 0
配置alertmanager
默认配置
[root@mcw04 ~]# cat /etc/alertmanager/alertmanager.yml
route:
  group_by: ['alertname']
  group_wait: 30s
  group_interval: 5m
  repeat_interval: 1h
  receiver: 'web.hook'
receivers:
  - name: 'web.hook'
    webhook_configs:
      - url: 'http://127.0.0.1:5001/'
inhibit_rules:
  - source_match:
      severity: 'critical'
    target_match:
      severity: 'warning'
    equal: ['alertname', 'dev', 'instance']
[root@mcw04 ~]# ss -lntup|grep 5001
[root@mcw04 ~]#
修改配置如下
[root@mcw04 ~]# cat /etc/alertmanager/alertmanager.yml
global:
  smtp_smarthost: 'smtp.163.com:25'
  smtp_from: '13xx2@163.com'
  smtp_auth_username: '13xx32'
  smtp_auth_password: 'xxx3456'
  smtp_require_tls: false

templates:
  - '/etc/alertmanager/template/*.tmpl'

route:
  receiver: email
receivers:
  - name: 'email'
    email_configs:
      - to: '8xx5@qq.com'
[root@mcw04 ~]#
创建目录,
[root@mcw04 ~]# sudo mkdir -p /etc/alertmanager/template
重启一下
[root@mcw04 ~]# systemctl restart alertmanager.service
查看配置,

已经修改为如下:下面的配置,没有在配置文件出现的,我们看情况应该也可以修改
global:
  resolve_timeout: 5m
  http_config:
    follow_redirects: true
    enable_http2: true
  smtp_from: 135xx632@163.com
  smtp_hello: localhost
  smtp_smarthost: smtp.163.com:25
  smtp_auth_username: "13xxx32"
  smtp_auth_password: <secret>
  smtp_require_tls: false
  pagerduty_url: https://events.pagerduty.com/v2/enqueue
  opsgenie_api_url: https://api.opsgenie.com/
  wechat_api_url: https://qyapi.weixin.qq.com/cgi-bin/
  victorops_api_url: https://alert.victorops.com/integrations/generic/20131114/alert/
  telegram_api_url: https://api.telegram.org
  webex_api_url: https://webexapis.com/v1/messages
route:
  receiver: email
  continue: false
receivers:
- name: email
  email_configs:
  - send_resolved: false
    to: 89xx15@qq.com
    from: 13xx32@163.com
    hello: localhost
    smarthost: smtp.163.com:25
    auth_username: "13xx32"
    auth_password: <secret>
    headers:
      From: 13xx32@163.com
      Subject: '{{ template "email.default.subject" . }}'
      To: 89xx15@qq.com
    html: '{{ template "email.default.html" . }}'
    require_tls: false
templates:
- /etc/alertmanager/template/*.tmpl
添加报警规则
添加第一条告警规则
修改前
# Load rules once and periodically evaluate them according to the global 'evaluation_interval'.
rule_files:
  - "rules/node_rules.yml"
  # - "first_rules.yml"
  # - "second_rules.yml"
修改后
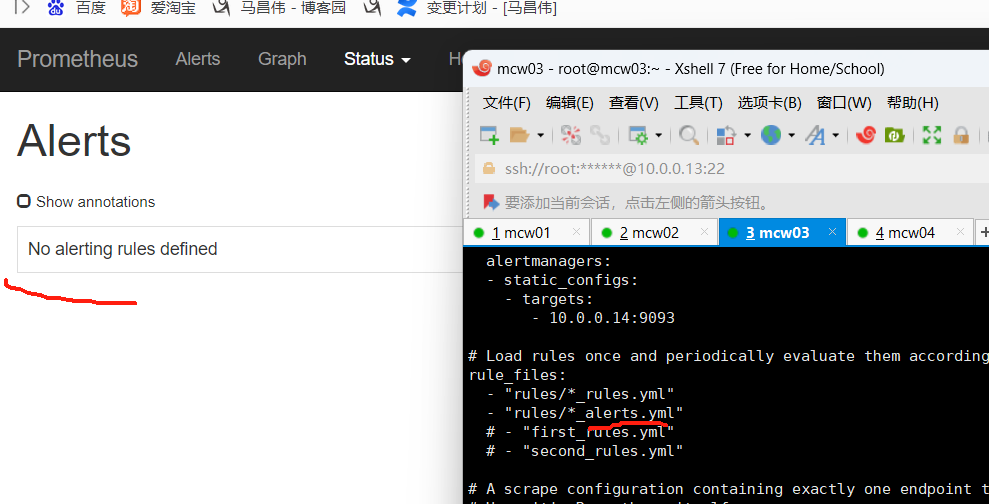
[root@mcw03 ~]# vim /etc/prometheus.yml
# Load rules once and periodically evaluate them according to the global 'evaluation_interval'.
rule_files:
  - "rules/*_rules.yml"
  - "rules/*_alerts.yml"
这是之前添加的记录规则
[root@mcw03 ~]# cat /etc/rules/node_rules.yml
groups:
  - name: node_rules
    interval: 10s
    rules:
    - record: instance:node_cpu:avg_rate5m
      expr:  100 - avg(irate(node_cpu_seconds_total{job='agent1',mode='idle'}[5m])) by (instance)*100
    - record: instace:node_memory_usage:percentage
      expr: (node_memory_MemTotal_bytes-(node_memory_MemFree_bytes+node_memory_Buffers_bytes+node_memory_Cached_bytes))/node_memory_MemTotal_bytes*100
      labels:
        metric_type: aggregation
        name: machangwei
  - name: xiaoma_rules
    rules:
    - record: mcw:diskusage
      expr: (node_filesystem_size_bytes{mountpoint="/"}-node_filesystem_free_bytes{mountpoint="/"})/node_filesystem_size_bytes{mountpoint="/"}*100
[root@mcw03 ~]#
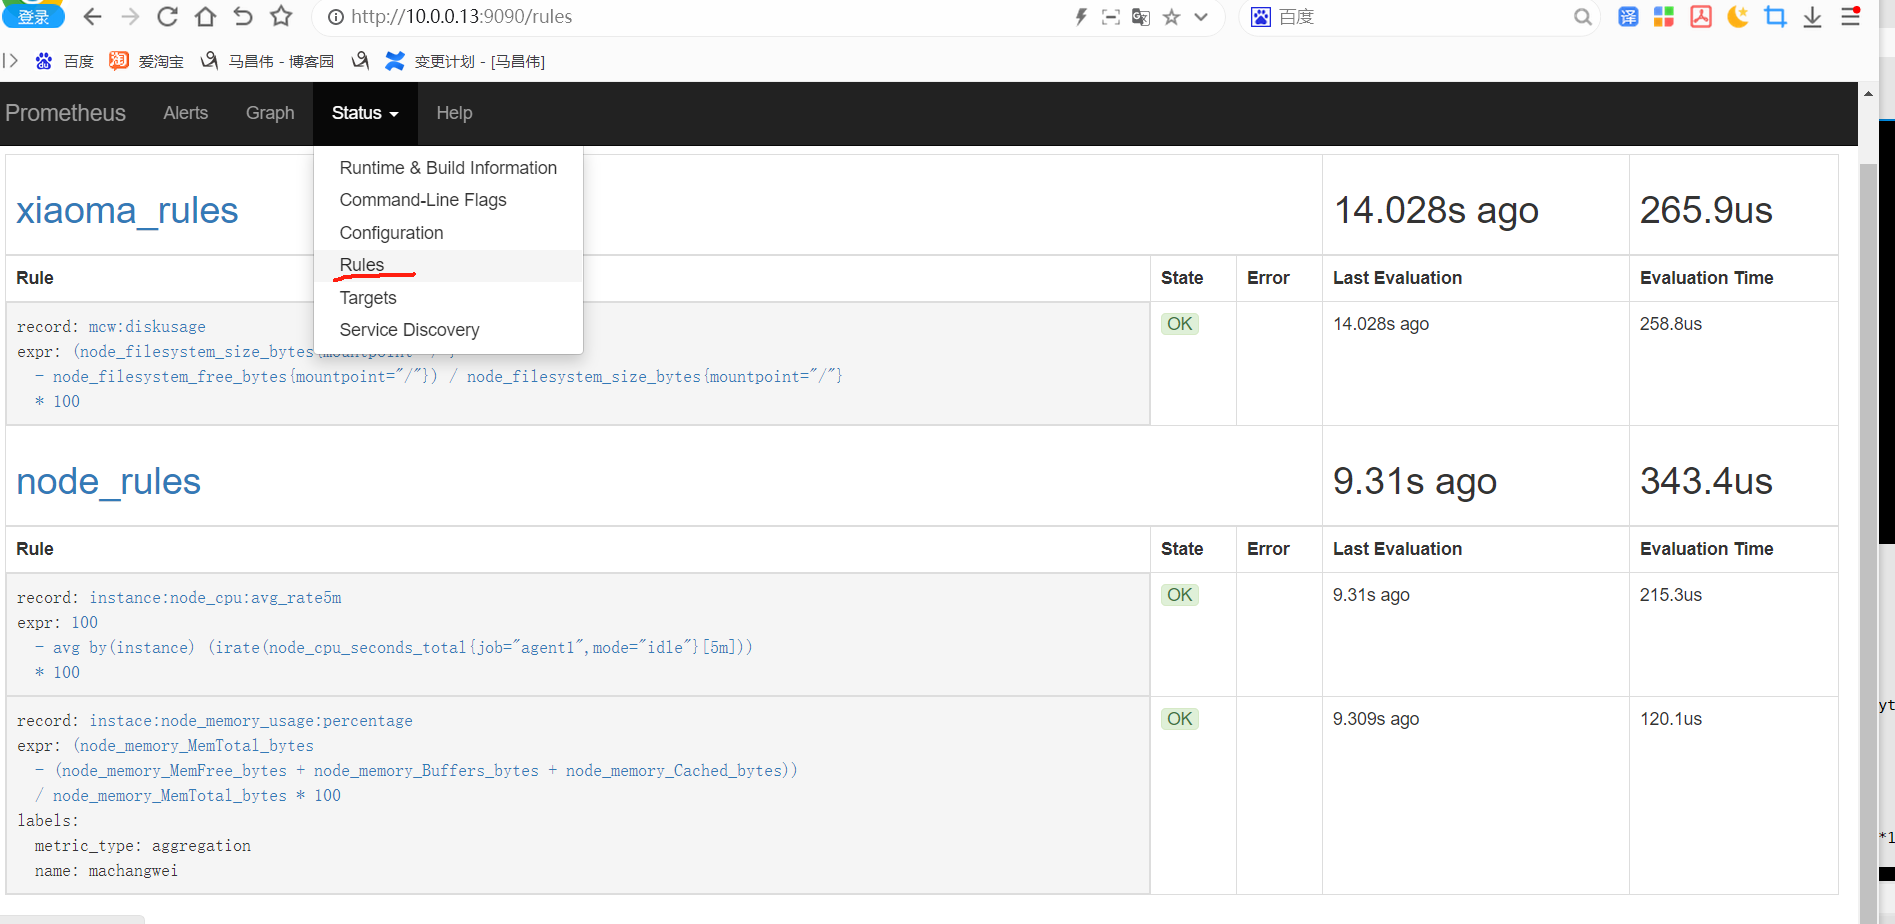
修改上面的配置,重载之后,记录规则没有啥影响
告警的配置,需要用到第一个记录规则
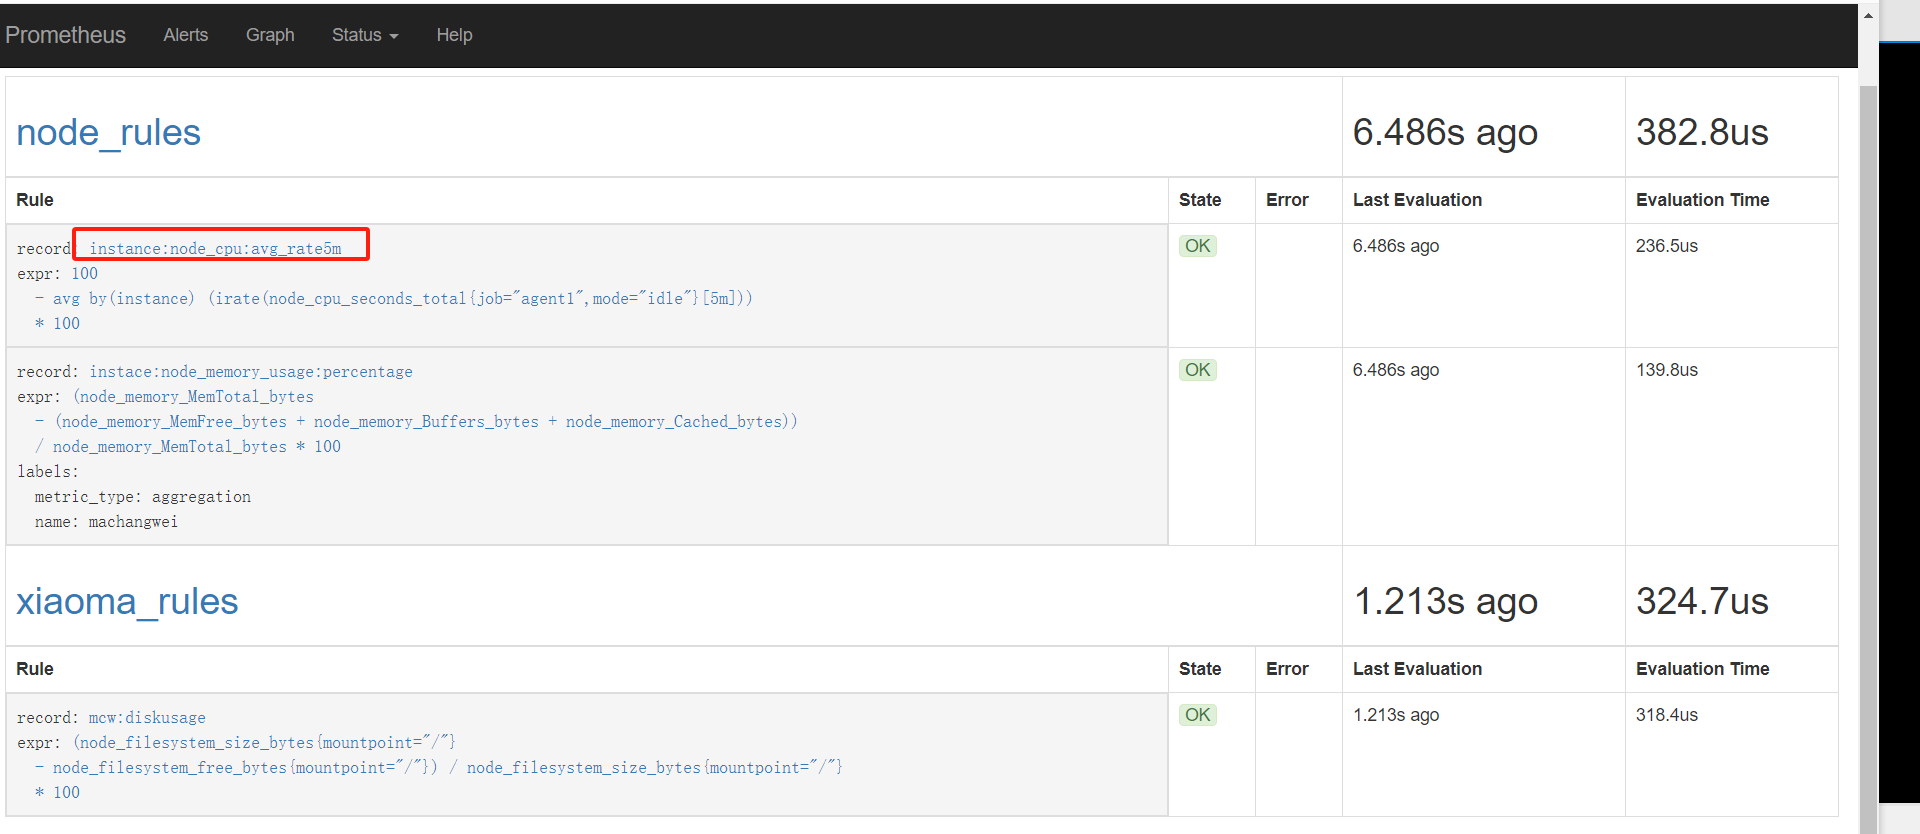
编辑告警配置文件。HighNodeCPU是告警的名称,expr下面可以用指标或者记录规则,使用运算符来指定触发阈值,
[root@mcw03 ~]# ls /etc/rules/
node_rules.yml
[root@mcw03 ~]# vim /etc/rules/node_alerts.yml
[root@mcw03 ~]# cat /etc/rules/node_alerts.yml
groups:
  - name: node_alerts
    rules:
    - alert: HighNodeCPU
      expr: instance:node_cpu:avg_rete5m > 80
      for: 60m
      labels:
        servrity: warning
      annotations:
        summary: High Node CPU for 1 hour
        console: You might want to check the Node Dashboard at http://grafana.example.com/dashboard/db/node-dashboard
[root@mcw03 ~]# ls /etc/rules/
node_alerts.yml  node_rules.yml
[root@mcw03 ~]#
重载
[root@mcw03 ~]# curl -X POST http://localhost:9090/-/reload
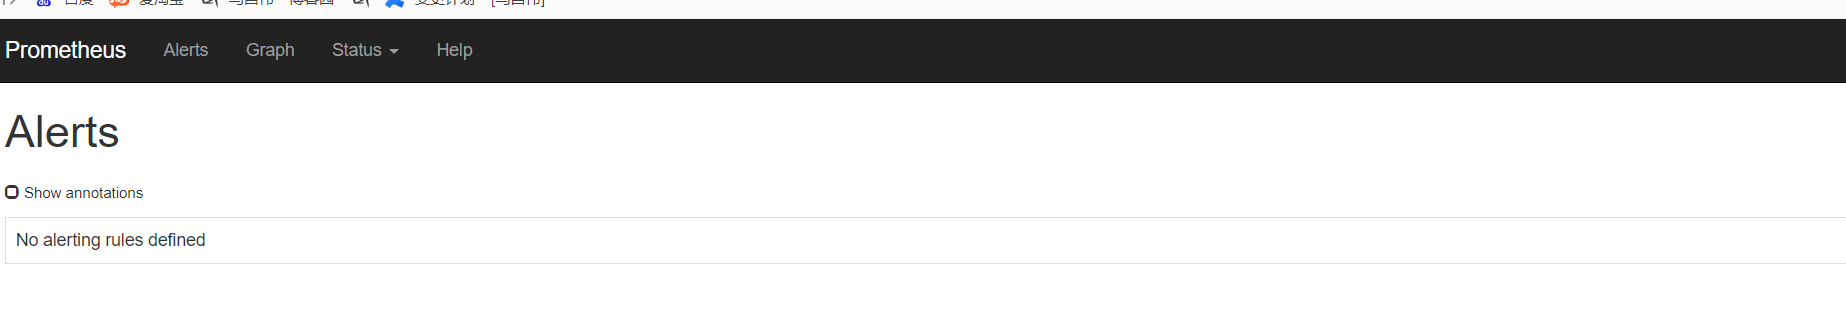
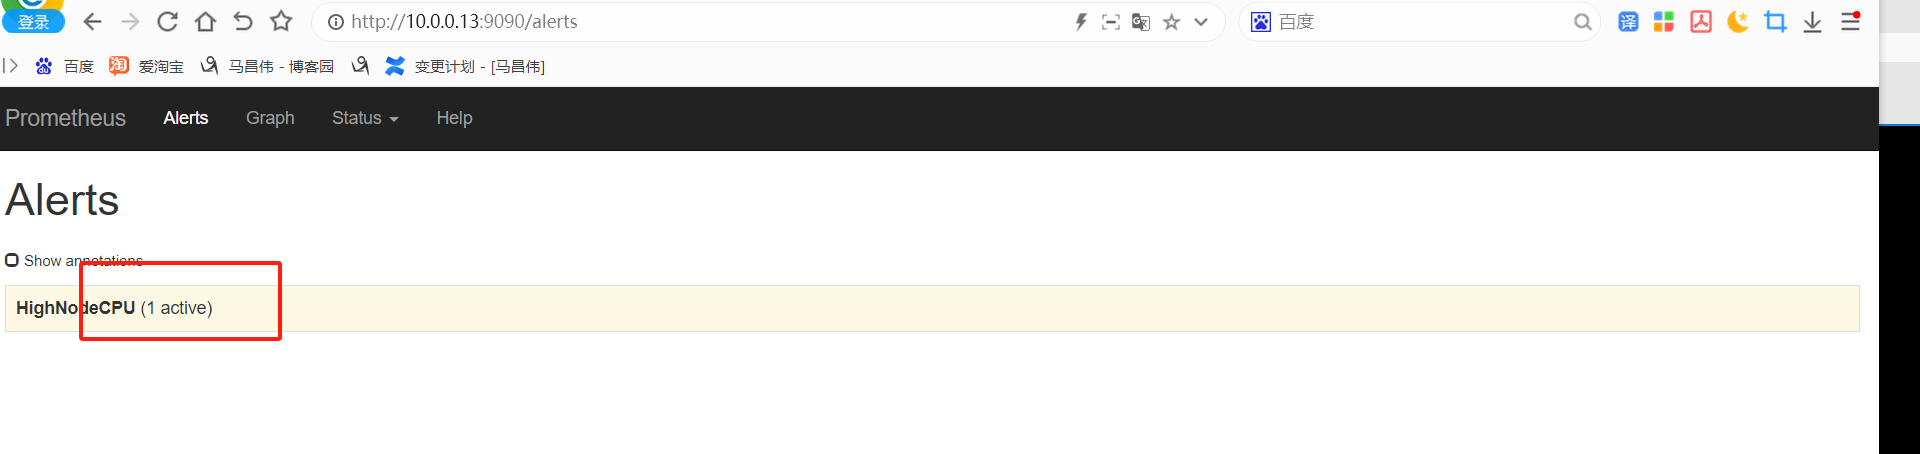
重载之后,刷新告警页面,点击绿色的地方
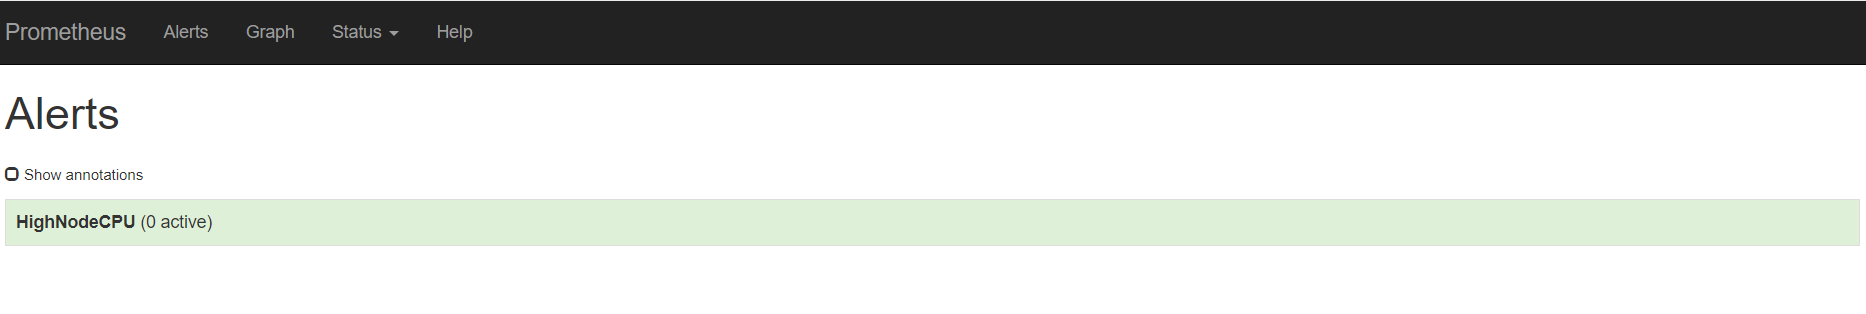
可以看到我们定义的告警规则
触发告警,以及配置邮件告警
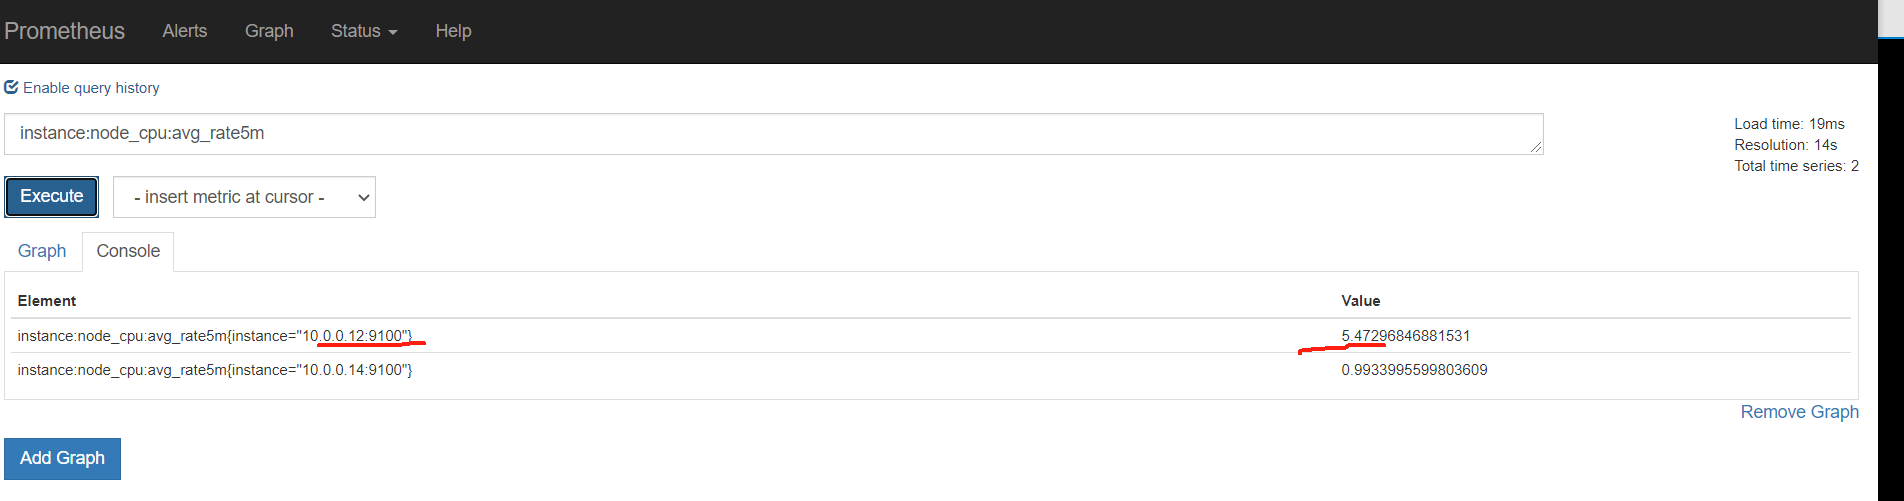
下面触发告警,调低阈值 ,for改为10s,上面的记录规则写错了,修改正确,由rete改为rate ,并且触发阈值是大于1就触发告警,重载配置
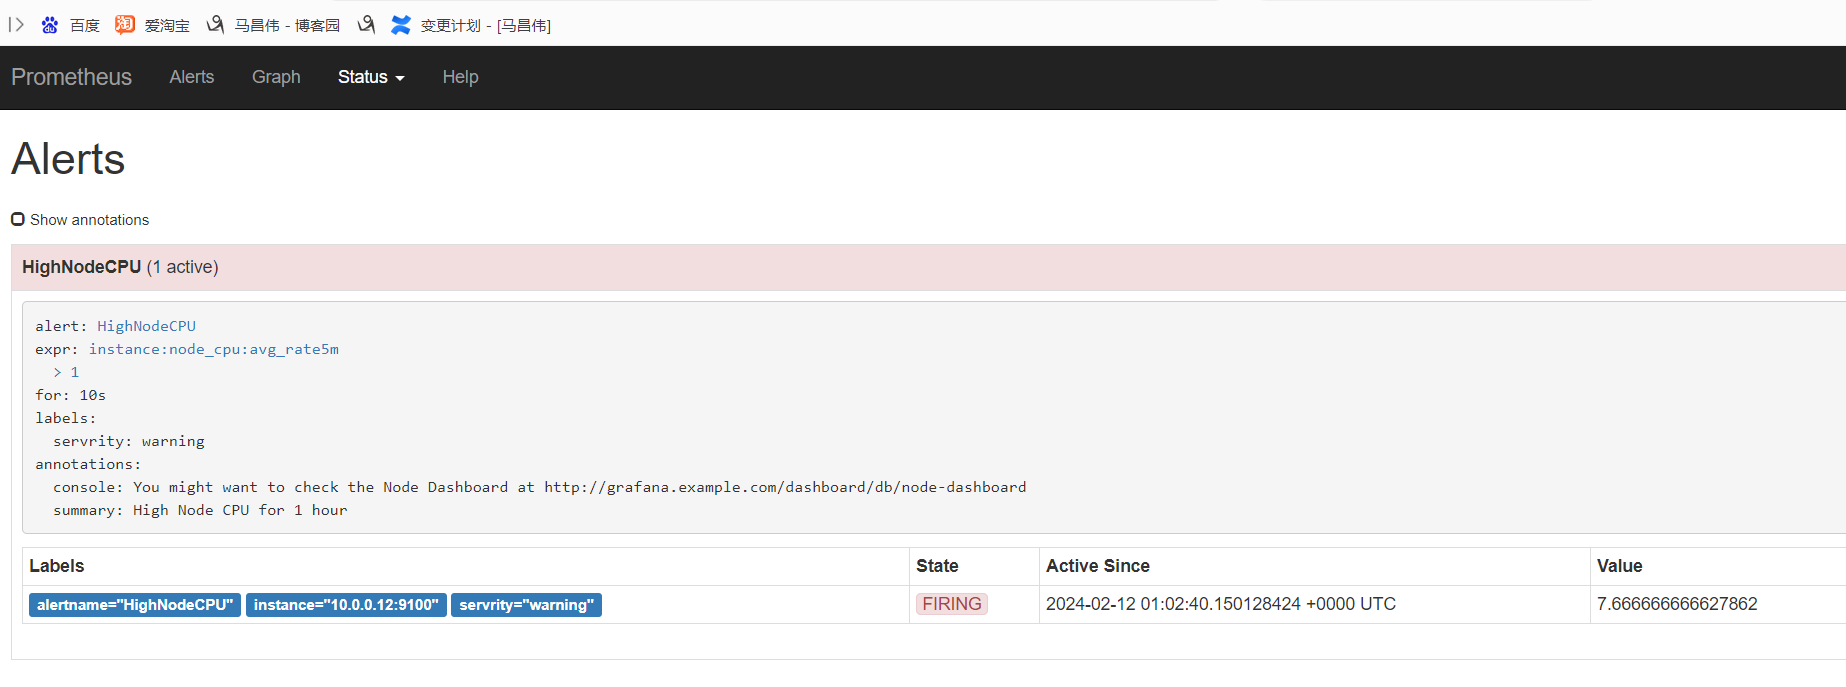
[root@mcw03 ~]# vim /etc/rules/node_alerts.yml
[root@mcw03 ~]# cat /etc/rules/node_alerts.yml
groups:
  - name: node_alerts
    rules:
    - alert: HighNodeCPU
      expr: instance:node_cpu:avg_rate5m > 1
      for: 10s
      labels:
        servrity: warning
      annotations:
        summary: High Node CPU for 1 hour
        console: You might want to check the Node Dashboard at http://grafana.example.com/dashboard/db/node-dashboard
[root@mcw03 ~]# curl -X POST http://localhost:9090/-/reload
[root@mcw03 ~]#
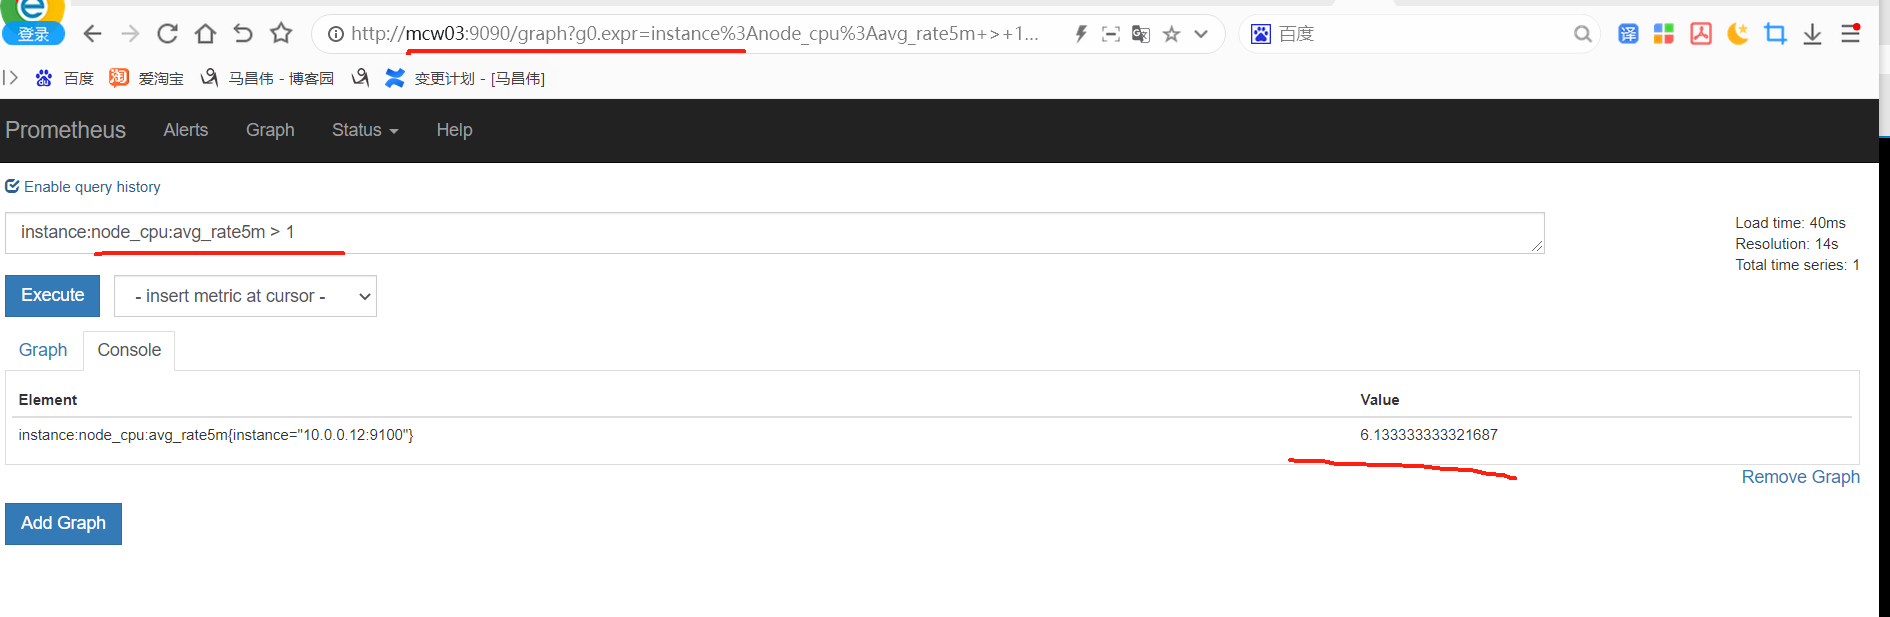
从表达式浏览器这里可以看到,有个机器是可以触发告警阈值的
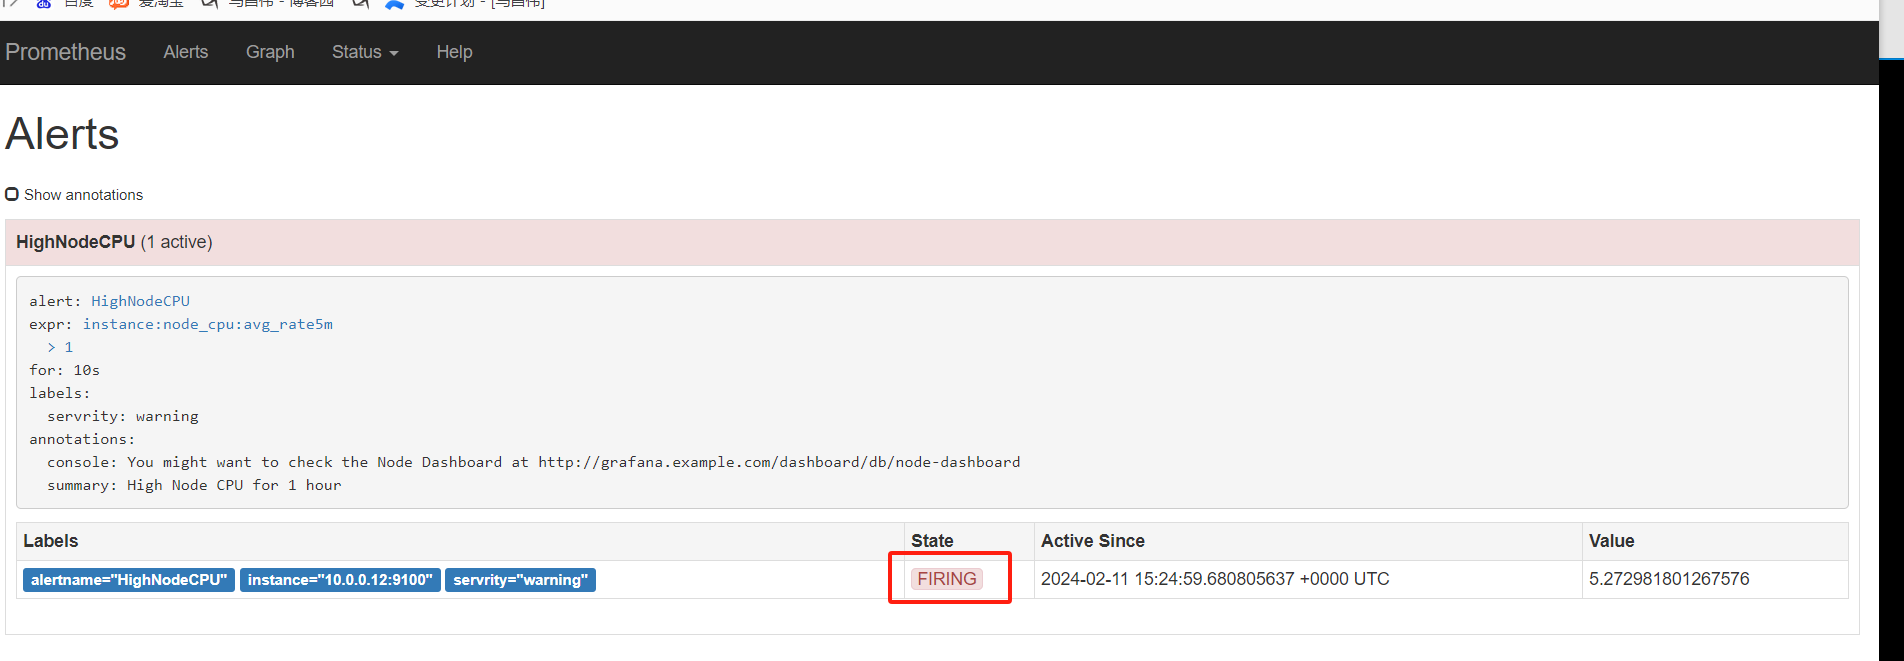
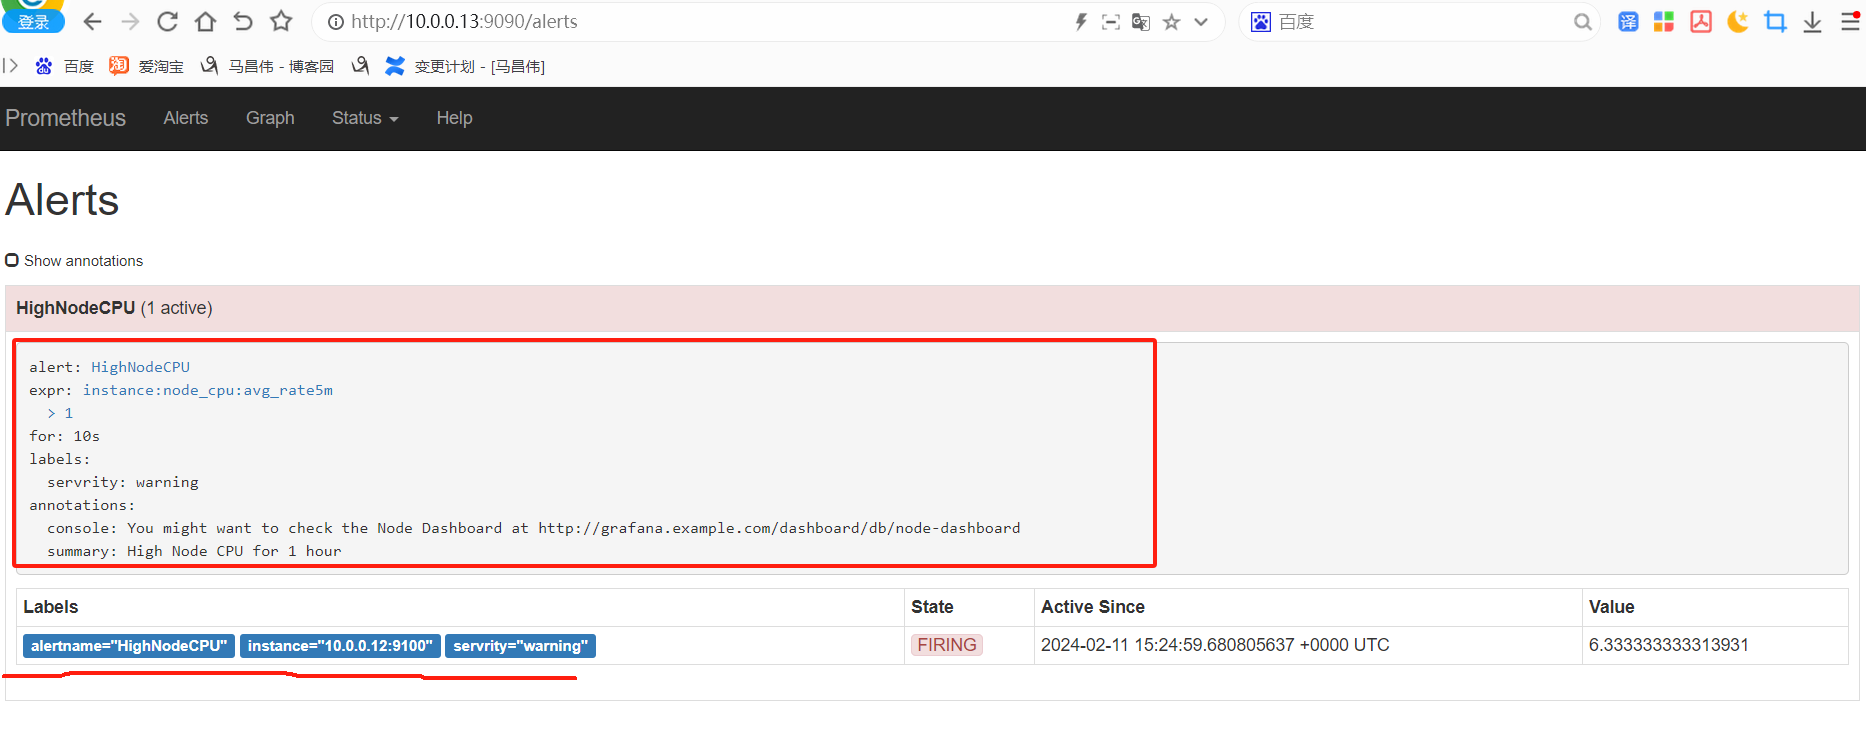
alert这里,显示有个活跃的告警,之前是0活跃的绿色
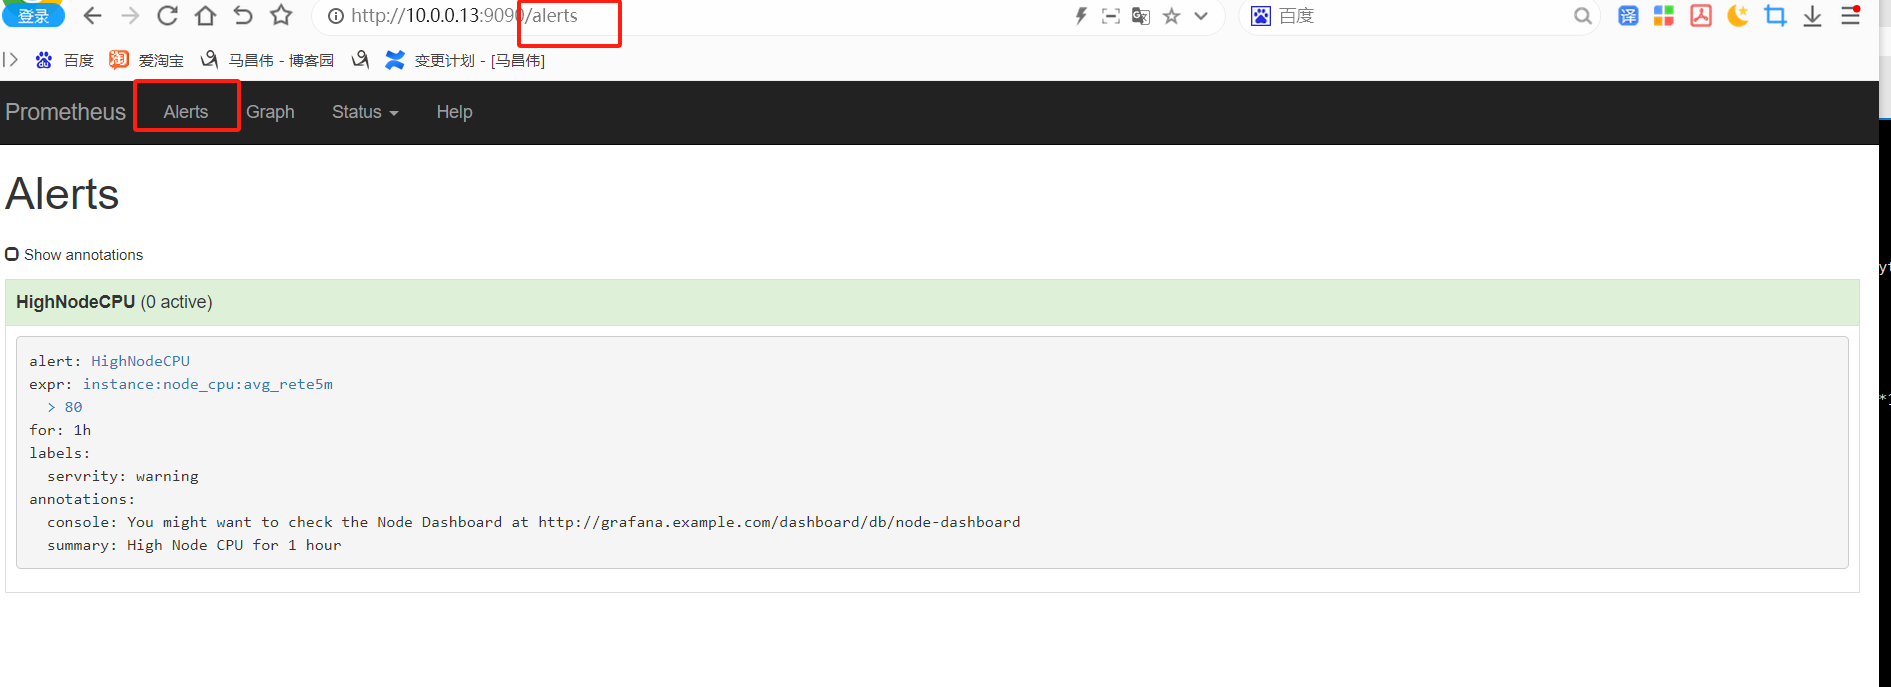
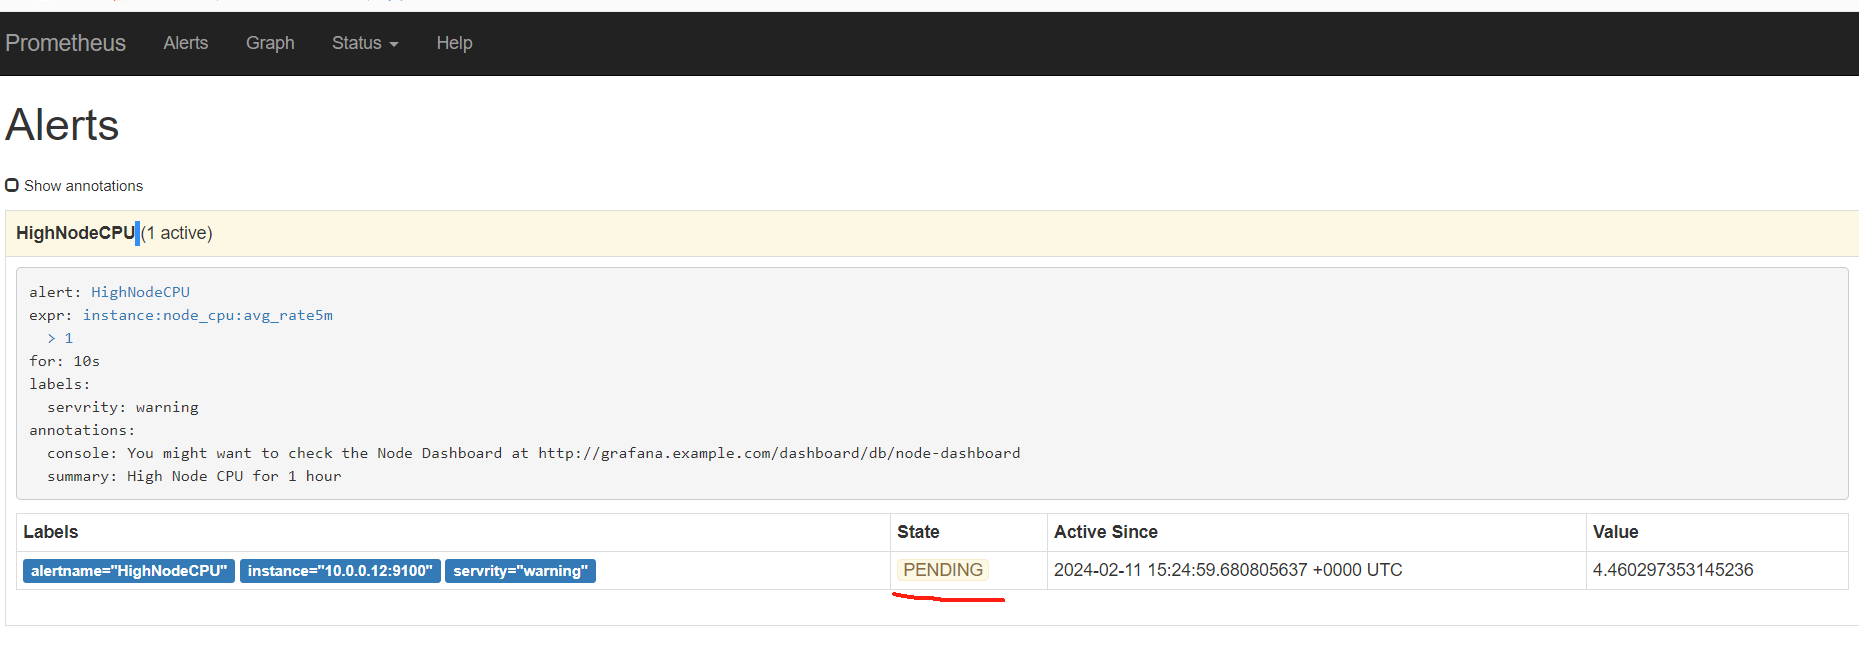
点击打开之后,可以看到相关触发告警的信息
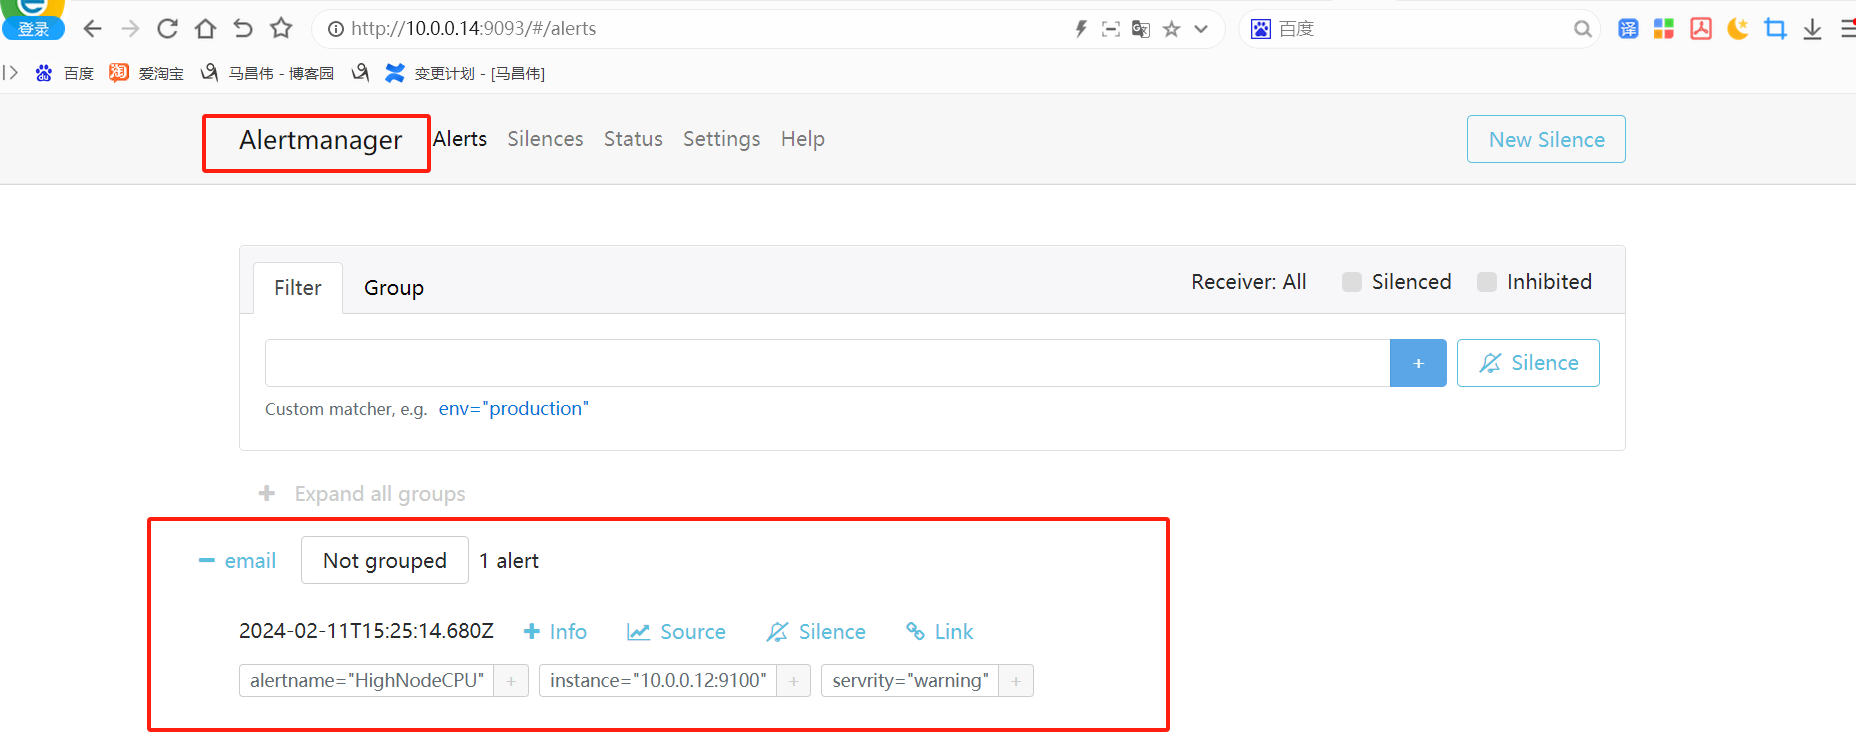
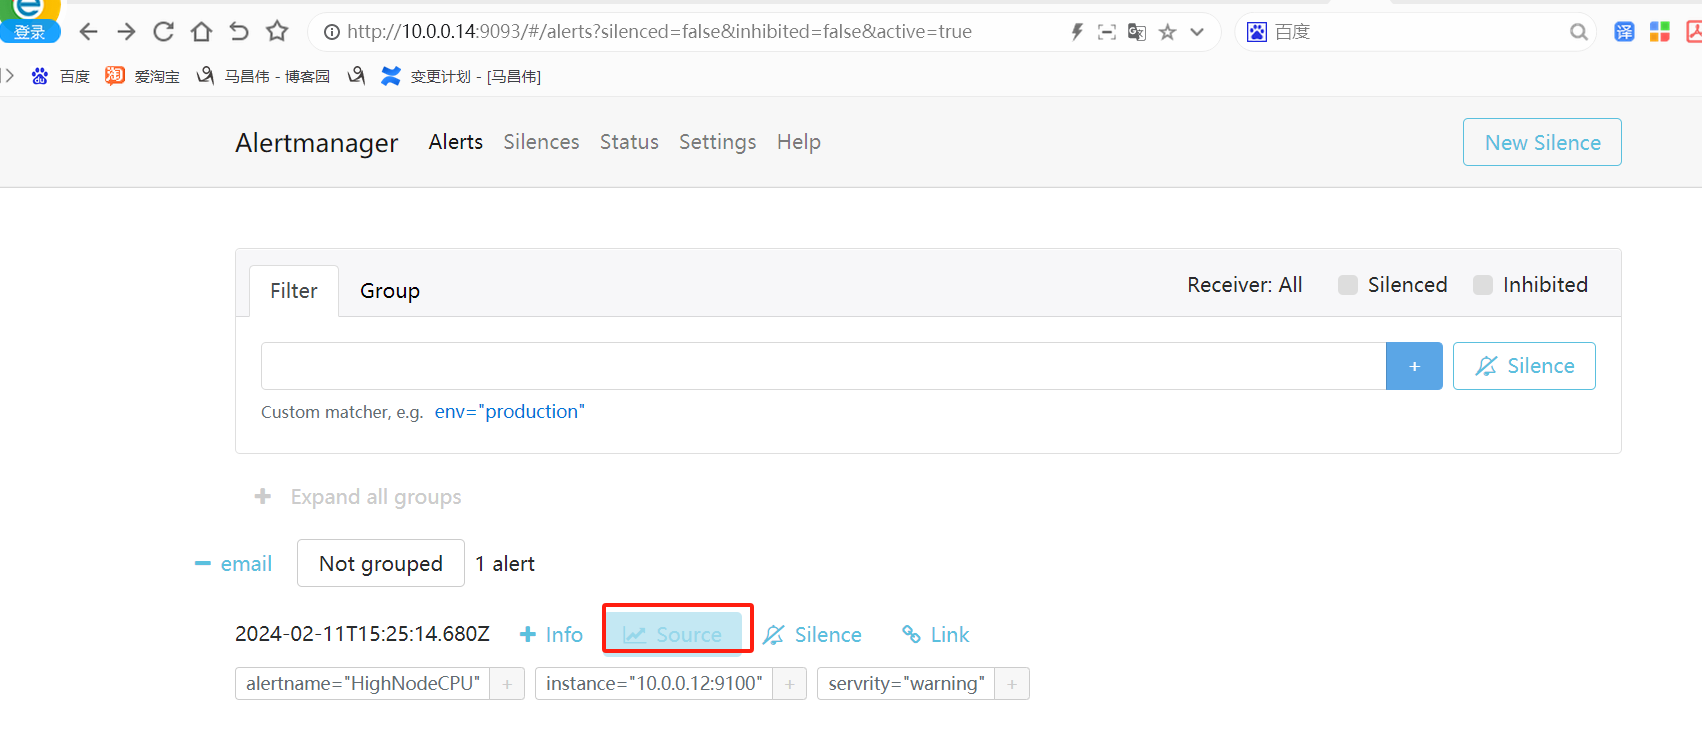
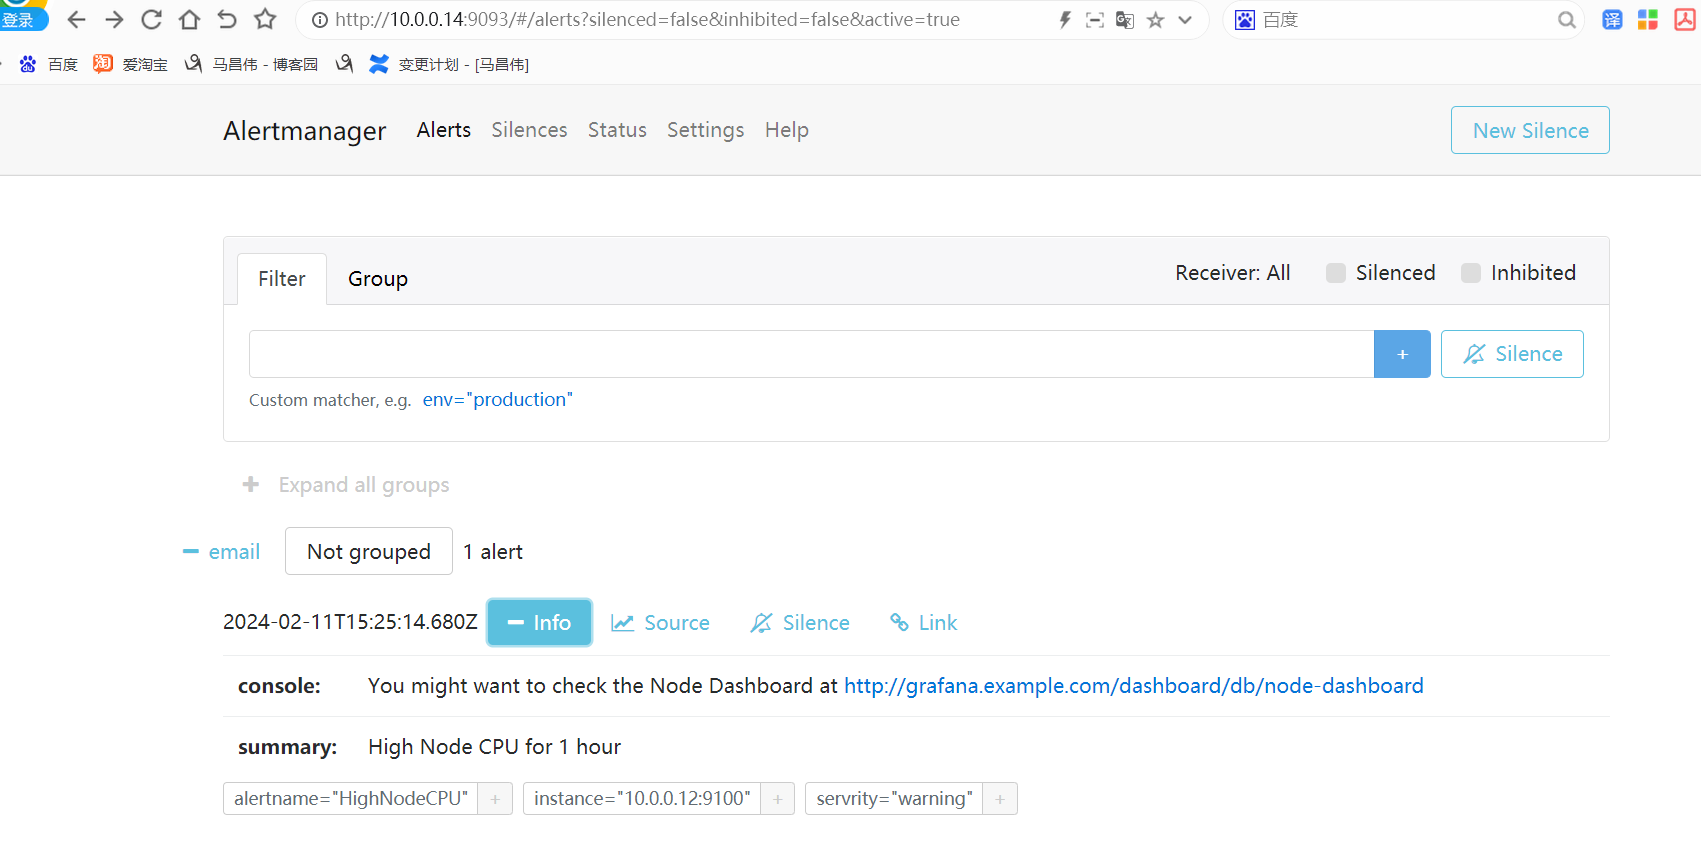
alertmanager页面,也可以看到这个告警
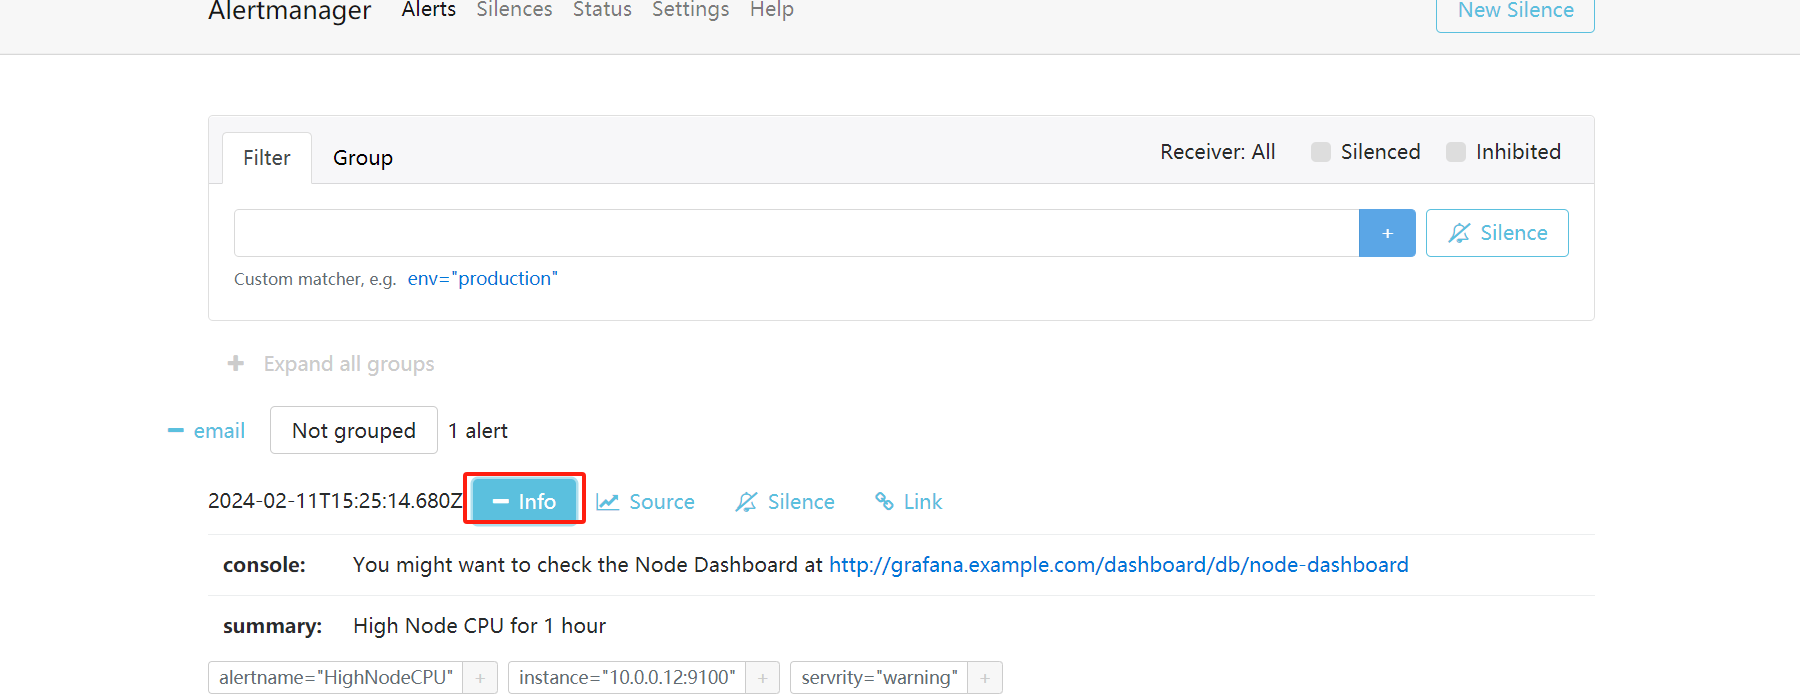
点击信息,可以看到我们告警规则里面注册的信息
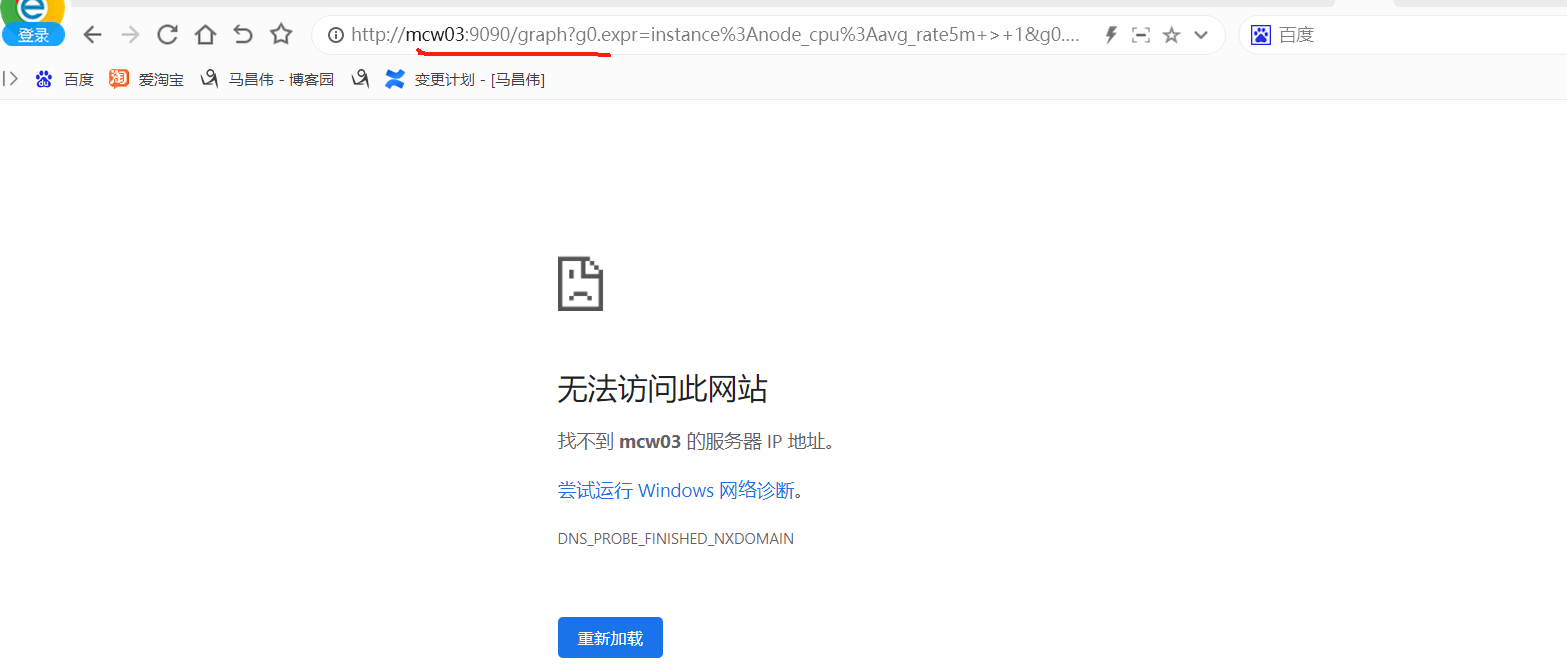
点击来源的时候
跳转到Prometheus的浏览器表达式地址,我们给笔记本添加这个主机的解析记录
添加解析记录之后,刷新一下页面可以看到是这样的
又过了一阵子,查看状态已经变化了
没有看到发送邮件,查看报错,域名解析有问题
[root@mcw04 ~]# tail /var/log/messages
Feb 11 23:56:14 mcw04 alertmanager: ts=2024-02-11T15:56:14.706Z caller=notify.go:745 level=warn component=dispatcher receiver=email integration=email[0] aggrGroup={}:{} msg="Notify attempt failed, will retry later" attempts=3 err="establish connection to server: dial tcp: lookup smtp.163.com on 223.5.5.5:53: read udp 192.168.80.4:34027->223.5.5.5:53: i/o timeout"
F
重启网络之后,可以解析域名了,但是通知失败
[root@mcw04 ~]# systemctl restart network
[root@mcw04 ~]#
[root@mcw04 ~]#
[root@mcw04 ~]# ping www.baidu.com
PING www.a.shifen.com (220.181.38.149) 56(84) bytes of data.
64 bytes from 220.181.38.149 (220.181.38.149): icmp_seq=1 ttl=128 time=18.2 ms
64 bytes from 220.181.38.149 (220.181.38.149): icmp_seq=2 ttl=128 time=16.1 ms
^C
--- www.a.shifen.com ping statistics ---
2 packets transmitted, 2 received, 0% packet loss, time 1002ms
rtt min/avg/max/mdev = 16.161/17.199/18.237/1.038 ms
[root@mcw04 ~]#
[root@mcw04 ~]#
[root@mcw04 ~]#
[root@mcw04 ~]# tail /var/log/messages
Feb 11 23:59:42 mcw04 network: [  OK  ]
Feb 11 23:59:42 mcw04 systemd: Started LSB: Bring up/down networking.
Feb 11 23:59:43 mcw04 kernel: IPv6: ens33: IPv6 duplicate address fe80::495b:ff7:d185:f95d detected!
Feb 11 23:59:43 mcw04 NetworkManager[865]: <info>  [1707667183.2015] device (ens33): ipv6: duplicate address check failed for the fe80::495b:ff7:d185:f95d/64 lft forever pref forever lifetime 90305-0[4294967295,4294967295] dev 2 flags tentative,permanent,0x8 src kernel address
Feb 11 23:59:43 mcw04 kernel: IPv6: ens33: IPv6 duplicate address fe80::f32c:166d:40de:8f2e detected!
Feb 11 23:59:43 mcw04 NetworkManager[865]: <info>  [1707667183.7803] device (ens33): ipv6: duplicate address check failed for the fe80::f32c:166d:40de:8f2e/64 lft forever pref forever lifetime 90305-0[4294967295,4294967295] dev 2 flags tentative,permanent,0x8 src kernel address
Feb 11 23:59:43 mcw04 NetworkManager[865]: <warn>  [1707667183.7803] device (ens33): linklocal6: failed to generate an address: Too many DAD collisions
Feb 11 23:59:52 mcw04 alertmanager: ts=2024-02-11T15:59:52.266Z caller=notify.go:745 level=warn component=dispatcher receiver=email integration=email[0] aggrGroup={}:{} msg="Notify attempt failed, will retry later" attempts=14 err="*email.loginAuth auth: 550 User has no permission"
Feb 12 00:00:44 mcw04 alertmanager: ts=2024-02-11T16:00:44.697Z caller=dispatch.go:352 level=error component=dispatcher msg="Notify for alerts failed" num_alerts=1 err="email/email[0]: notify retry canceled after 15 attempts: *email.loginAuth auth: 550 User has no permission"
Feb 12 00:00:45 mcw04 alertmanager: ts=2024-02-11T16:00:45.028Z caller=notify.go:745 level=warn component=dispatcher receiver=email integration=email[0] aggrGroup={}:{} msg="Notify attempt failed, will retry later" attempts=1 err="*email.loginAuth auth: 550 User has no permission"
[root@mcw04 ~]#
没有开启pop3等这种服务,开启之后,报错认证失败
[root@mcw04 ~]# tail /var/log/messages
Feb 12 00:15:44 mcw04 alertmanager: ts=2024-02-11T16:15:44.700Z caller=dispatch.go:352 level=error component=dispatcher msg="Notify for alerts failed" num_alerts=1 err="email/email[0]: notify retry canceled after 16 attempts: *email.loginAuth auth: 550 User has no permission"
Feb 12 00:15:45 mcw04 alertmanager: ts=2024-02-11T16:15:45.048Z caller=notify.go:745 level=warn component=dispatcher receiver=email integration=email[0] aggrGroup={}:{} msg="Notify attempt failed, will retry later" attempts=1 err="*email.loginAuth auth: 550 User has no permission"
Feb 12 00:20:44 mcw04 alertmanager: ts=2024-02-11T16:20:44.700Z caller=dispatch.go:352 level=error component=dispatcher msg="Notify for alerts failed" num_alerts=1 err="email/email[0]: notify retry canceled after 16 attempts: *email.loginAuth auth: 550 User has no permission"
Feb 12 00:20:45 mcw04 alertmanager: ts=2024-02-11T16:20:45.055Z caller=notify.go:745 level=warn component=dispatcher receiver=email integration=email[0] aggrGroup={}:{} msg="Notify attempt failed, will retry later" attempts=1 err="*email.loginAuth auth: 550 User has no permission"
Feb 12 00:25:33 mcw04 grafana-server: logger=cleanup t=2024-02-12T00:25:33.606714112+08:00 level=info msg="Completed cleanup jobs" duration=37.876505ms
Feb 12 00:25:44 mcw04 alertmanager: ts=2024-02-11T16:25:44.701Z caller=dispatch.go:352 level=error component=dispatcher msg="Notify for alerts failed" num_alerts=1 err="email/email[0]: notify retry canceled after 16 attempts: *email.loginAuth auth: 550 User has no permission"
Feb 12 00:25:45 mcw04 alertmanager: ts=2024-02-11T16:25:45.032Z caller=notify.go:745 level=warn component=dispatcher receiver=email integration=email[0] aggrGroup={}:{} msg="Notify attempt failed, will retry later" attempts=1 err="*email.loginAuth auth: 550 User has no permission"
Feb 12 00:28:10 mcw04 alertmanager: ts=2024-02-11T16:28:10.588Z caller=notify.go:745 level=warn component=dispatcher receiver=email integration=email[0] aggrGroup={}:{} msg="Notify attempt failed, will retry later" attempts=13 err="*email.loginAuth auth: 535 Error: authentication failed"
Feb 12 00:30:44 mcw04 alertmanager: ts=2024-02-11T16:30:44.703Z caller=dispatch.go:352 level=error component=dispatcher msg="Notify for alerts failed" num_alerts=1 err="email/email[0]: notify retry canceled after 16 attempts: *email.loginAuth auth: 535 Error: authentication failed"
Feb 12 00:30:45 mcw04 alertmanager: ts=2024-02-11T16:30:45.389Z caller=notify.go:745 level=warn component=dispatcher receiver=email integration=email[0] aggrGroup={}:{} msg="Notify attempt failed, will retry later" attempts=1 err="*email.loginAuth auth: 535 Error: authentication failed"
[root@mcw04 ~]#
修改配置如下:
[root@mcw04 ~]# cat /etc/alertmanager/alertmanager.yml
global:
  smtp_smarthost: 'smtp.163.com:465'
  smtp_from: '自己邮箱@163.com'
  smtp_auth_username: '自己邮箱32@163.com'
  smtp_auth_password: '自己的smtp授权密码'
  smtp_require_tls: false

templates:
  - '/etc/alertmanager/template/*.tmpl'

route:
  receiver: email
receivers:
  - name: 'email'
    email_configs:
      - to: '8发送给那个邮箱5@qq.com'
[root@mcw04 ~]#
然后重启alertmanager才算成功发送邮件
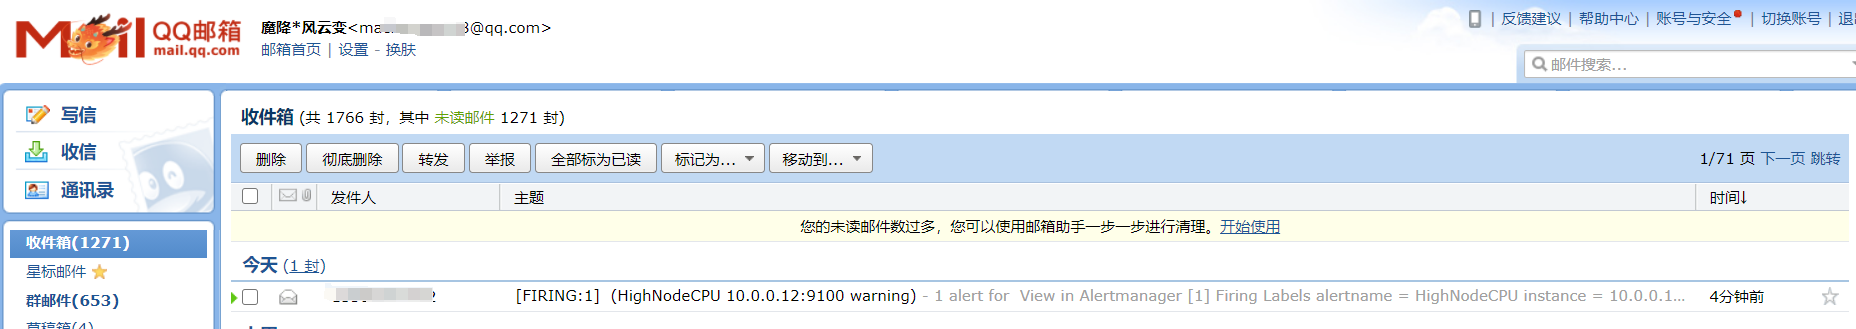
告警信息如下
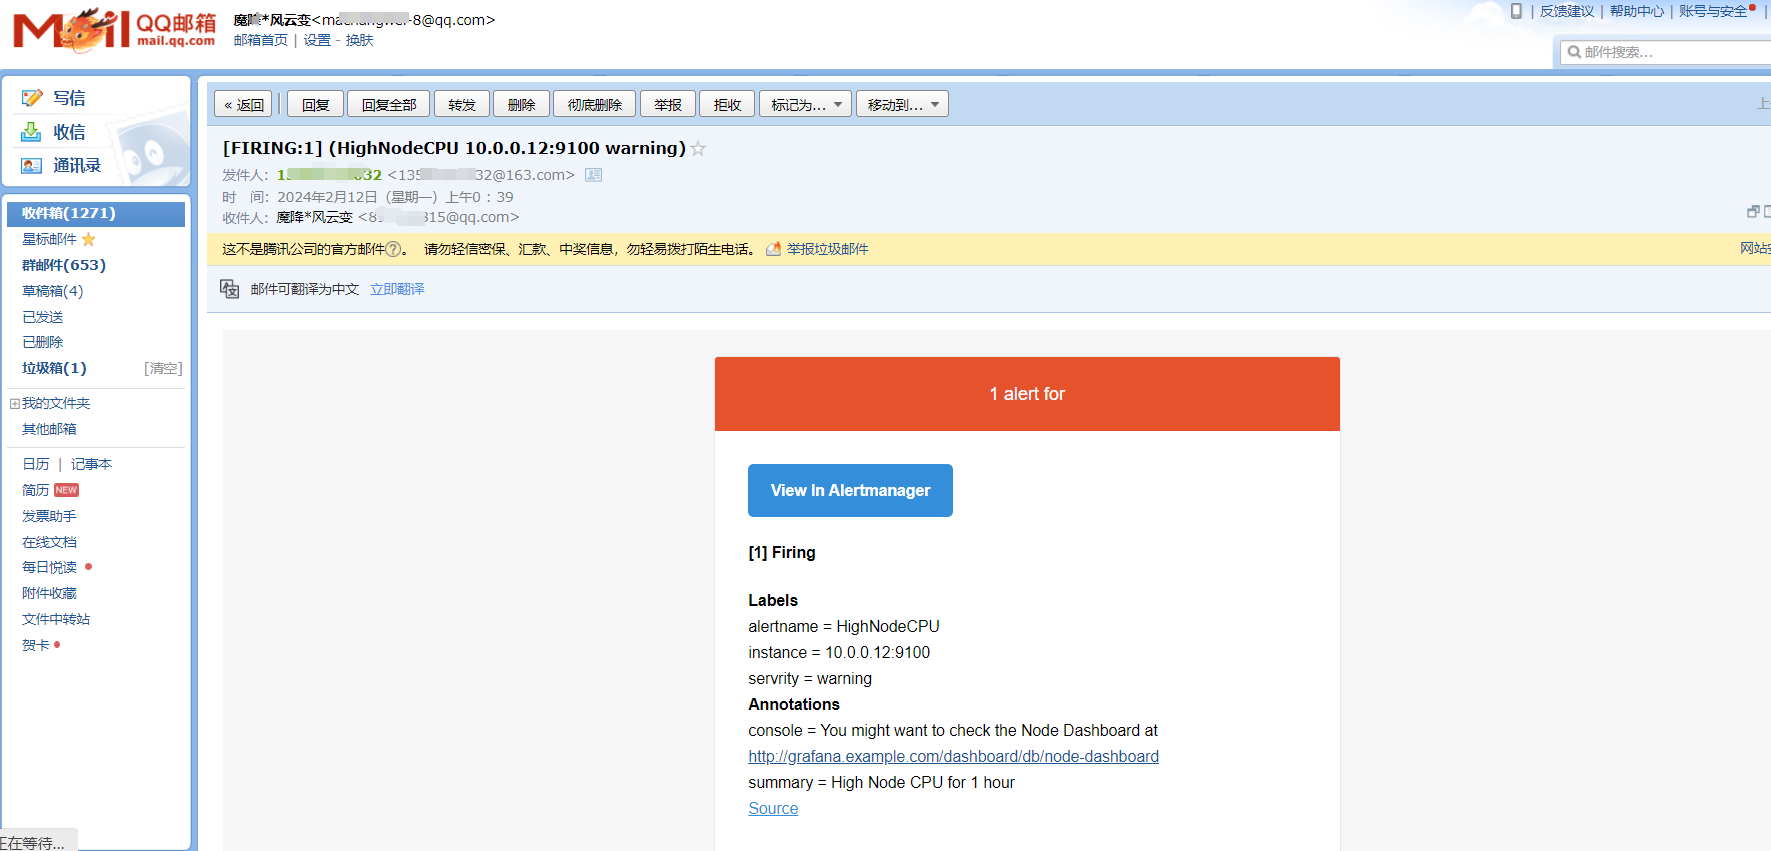
对比如下,把注册信息,还有下面触发后的标签发送出去了,我们自己顶一顶额标签告警级别也有
参考邮件alertmanger配置
参考:https://blog.csdn.net/qq_42527269/article/details/128914049
global:
  resolve_timeout: 5m
  smtp_smarthost: 'smtp.163.com:465'
  smtp_from: '自己邮箱@163.com'
  smtp_auth_username: '自己邮箱@163.com'
  smtp_auth_password: 'PLAPPSJXJCQABYAF'
  smtp_require_tls: false
templates:
  - 'template/*.tmpl'
route:
  group_by: ['alertname']
  group_wait: 30s
  group_interval: 5m
  repeat_interval: 20m
  receiver: 'email'

receivers:
  - name: 'email'
    email_configs:
      - to: '接收人邮箱@qq.com'
        html: '{{ template "test.html" . }}'
        send_resolved: true
添加新警报和模板,获取标签值,指标值
      annotations:
        summary: Host {{ $labels.instance }} of {{ $labels.job }} is up!
        myname: xiaoma {{ humanize $value }}
将原来的告警配置文件移动成告警2配置文件,重载
[root@mcw03 ~]# mv /etc/rules/node_alerts.yml /etc/rules/node_alerts2.yml
[root@mcw03 ~]# curl -X POST http://localhost:9090/-/reload
[root@mcw03 ~]#
文件没匹配上
重新改名
[root@mcw03 ~]# ls /etc/rules/
node_alerts2.yml  node_rules.yml
[root@mcw03 ~]# mv /etc/rules/node_alerts2.yml /etc/rules/node2_alerts.yml
[root@mcw03 ~]# curl -X POST http://localhost:9090/-/reload
[root@mcw03 ~]#
刷新一下,之前消失的数据又回来了,并且触发告警,发送邮件通知了
新增同样的文件,然后写两个告警配置文件。
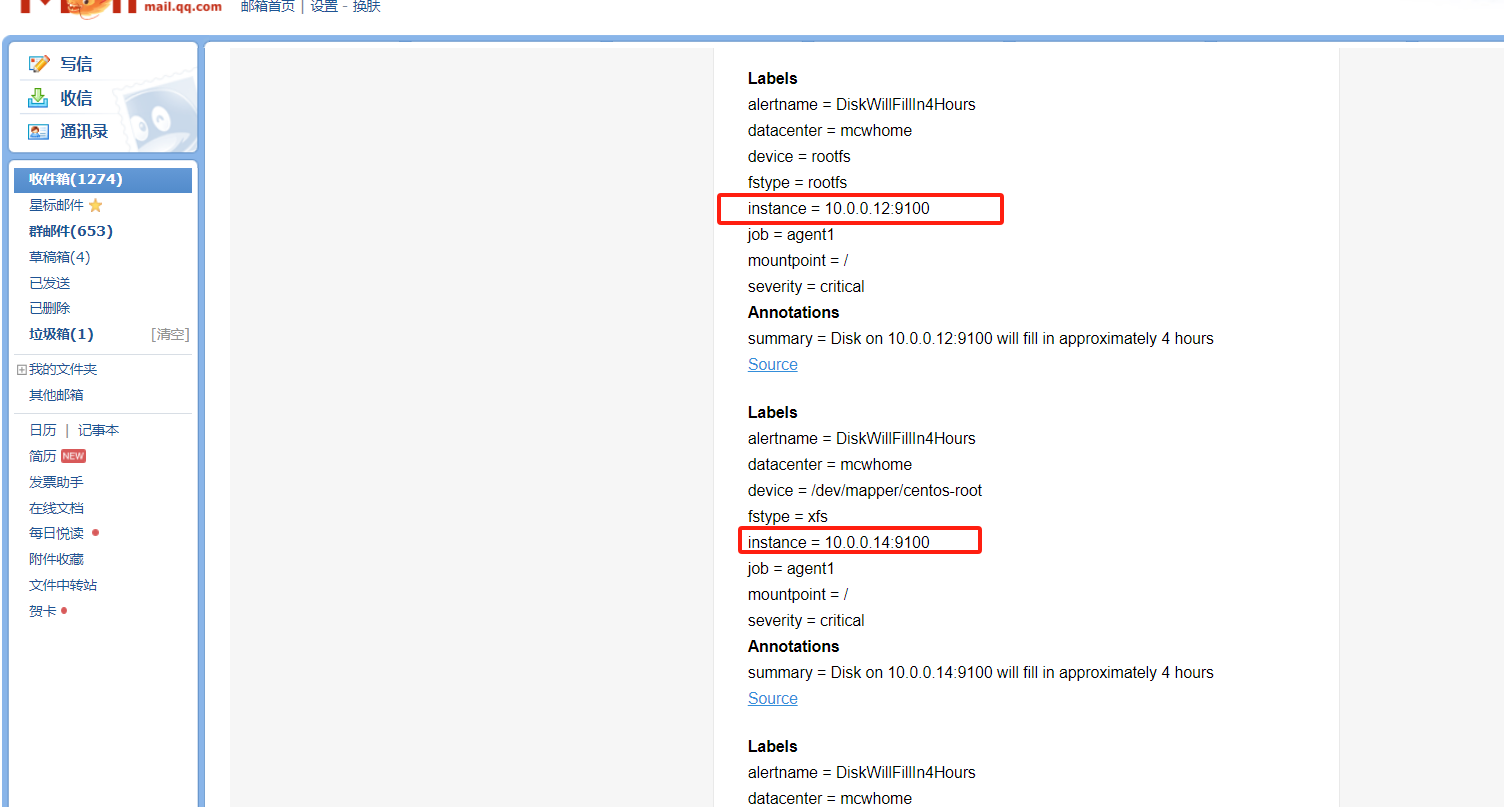
注解中要使用标签,需要用引用变量的方式,从$labels里面获取
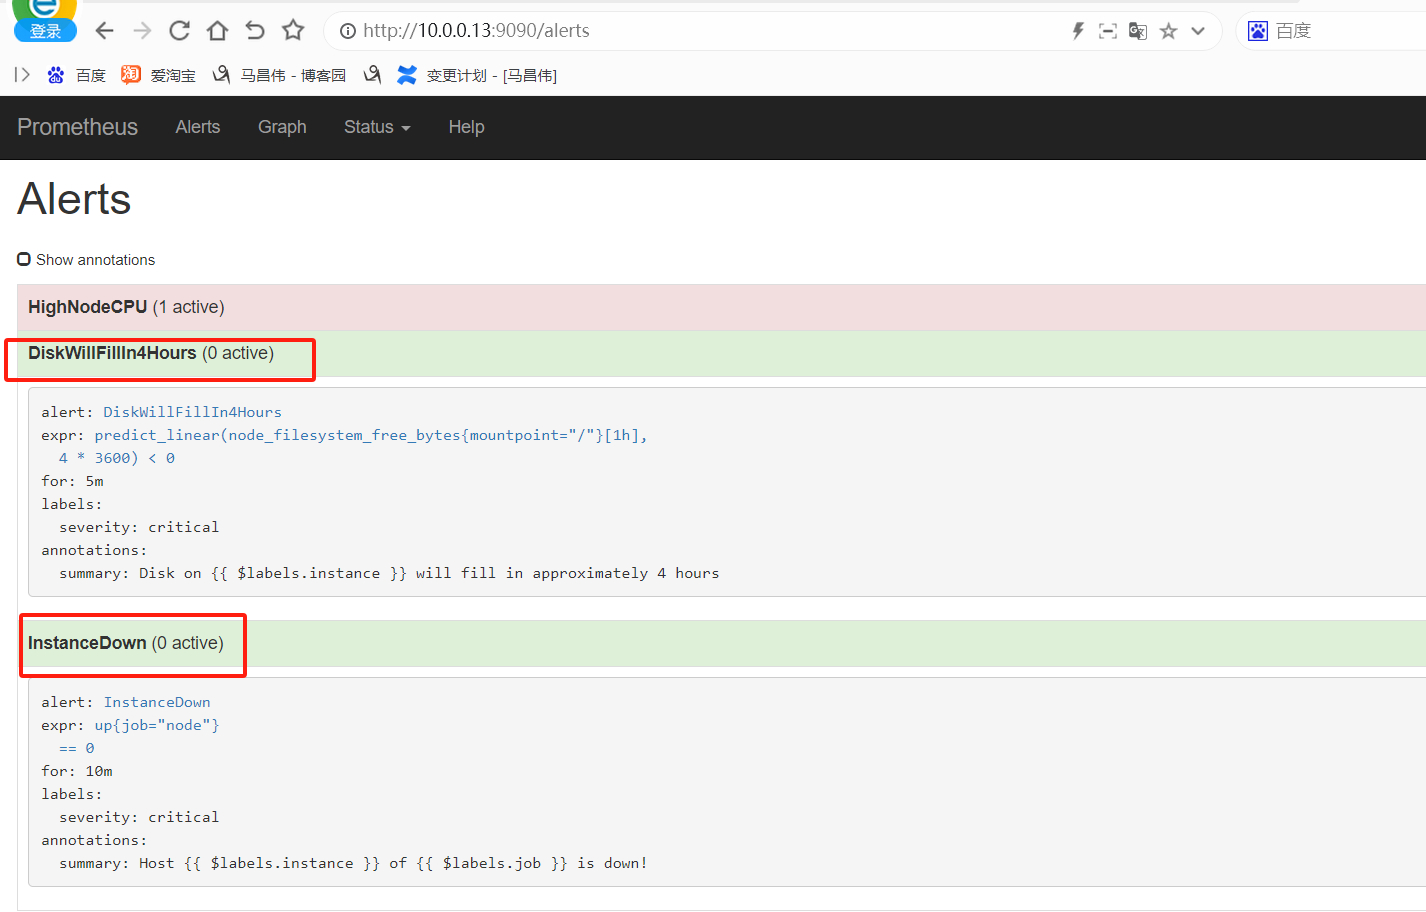
[root@mcw03 ~]# vim /etc/rules/node_alerts.yml
[root@mcw03 ~]# cat /etc/rules/node_alerts.yml
groups:
  - name: node_alerts
    rules:
    - alert: DiskWillFillIn4Hours
      expr: predict_linear(node_filesystem_free_bytes{mountpoint="/"}[1h],4*3600) < 0
      for: 5m
      labels:
        severity: critical
      annotations:
        summary: Disk on {{ $labels.instance }} will fill in approximately 4 hours
    - alert: InstanceDown
      expr: up{job="node"} == 0
      for: 10m
      labels:
        severity: critical
      annotations:
        summary: Host {{ $labels.instance }} of {{ $labels.job }} is down!
[root@mcw03 ~]# curl -X POST http://localhost:9090/-/reload
[root@mcw03 ~]#
查看页面,已经生成了两个警报规则
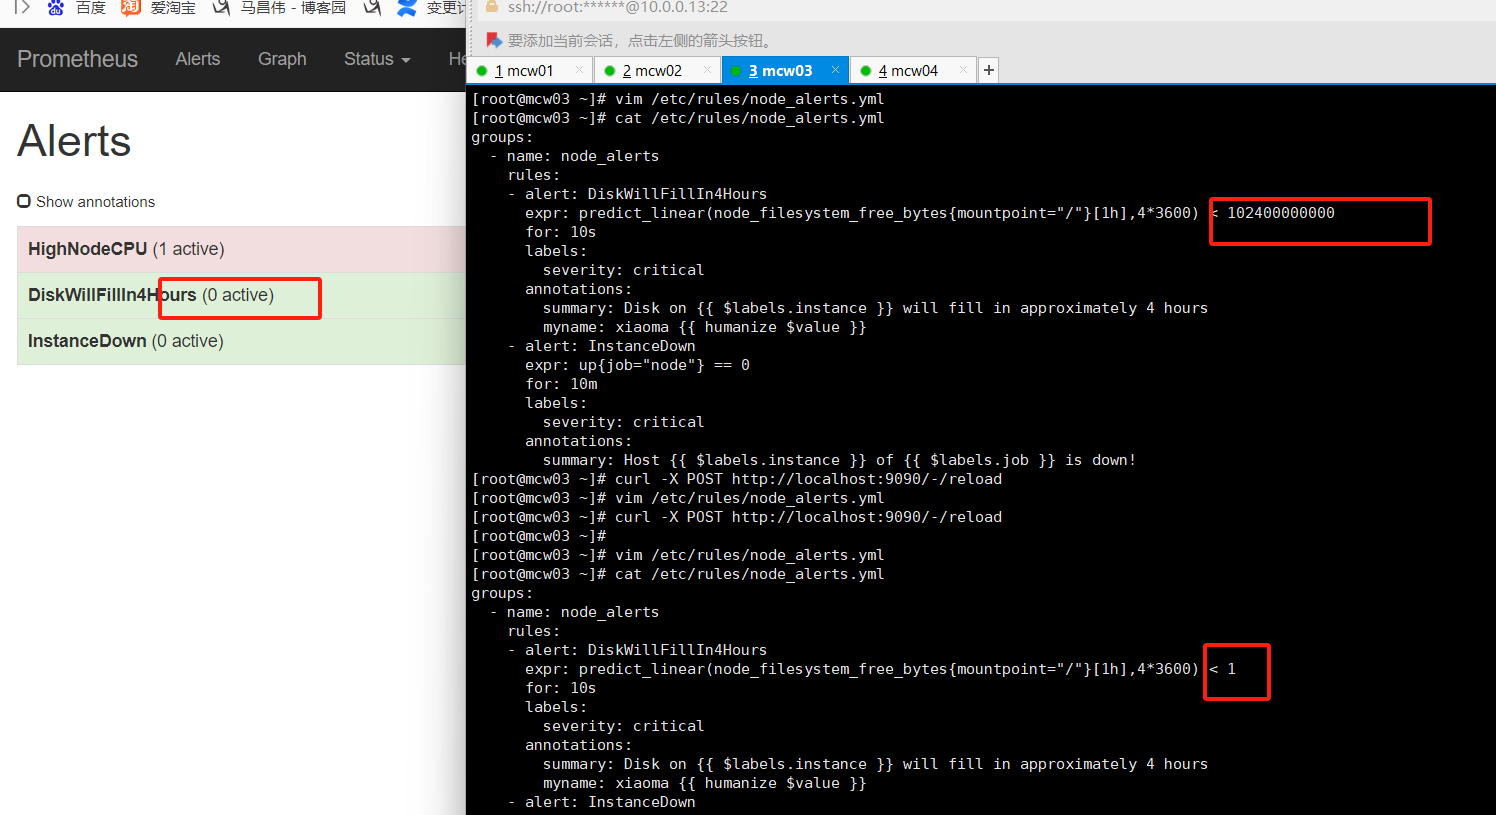
修改磁盘使用预测的值,将0改为102400000000,将for 改为10s ,触发告警
[root@mcw03 ~]# vim /etc/rules/node_alerts.yml
[root@mcw03 ~]# cat /etc/rules/node_alerts.yml
groups:
  - name: node_alerts
    rules:
    - alert: DiskWillFillIn4Hours
      expr: predict_linear(node_filesystem_free_bytes{mountpoint="/"}[1h],4*3600) < 102400000000
      for: 10s
      labels:
        severity: critical
      annotations:
        summary: Disk on {{ $labels.instance }} will fill in approximately 4 hours
    - alert: InstanceDown
      expr: up{job="node"} == 0
      for: 10m
      labels:
        severity: critical
      annotations:
        summary: Host {{ $labels.instance }} of {{ $labels.job }} is down!
[root@mcw03 ~]# curl -X POST http://localhost:9090/-/reload
[root@mcw03 ~]#
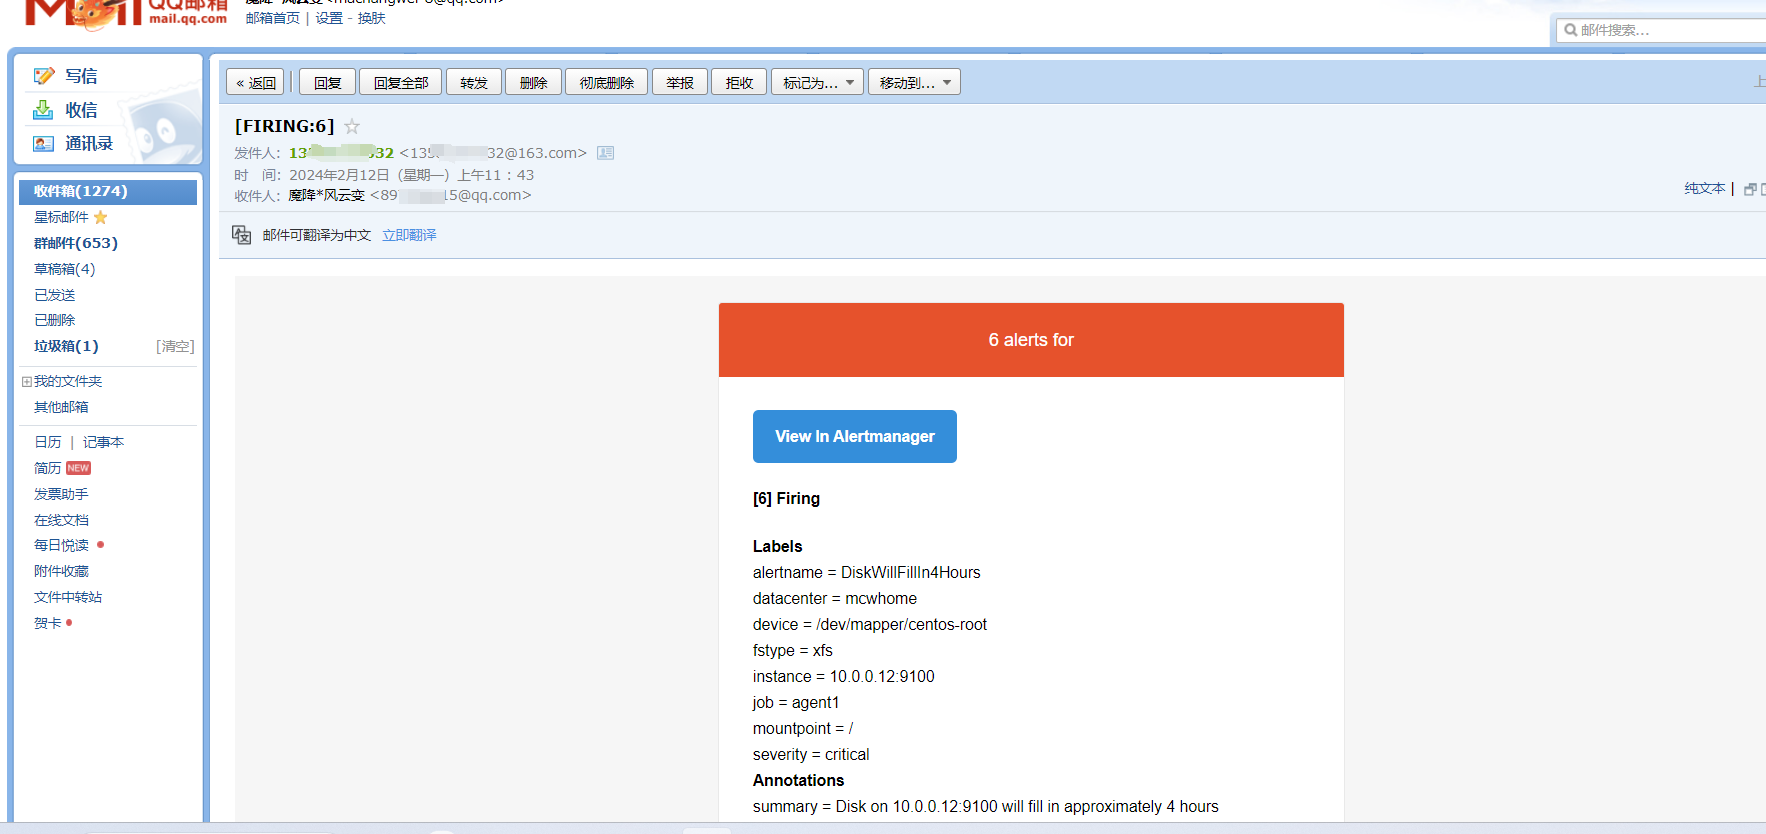
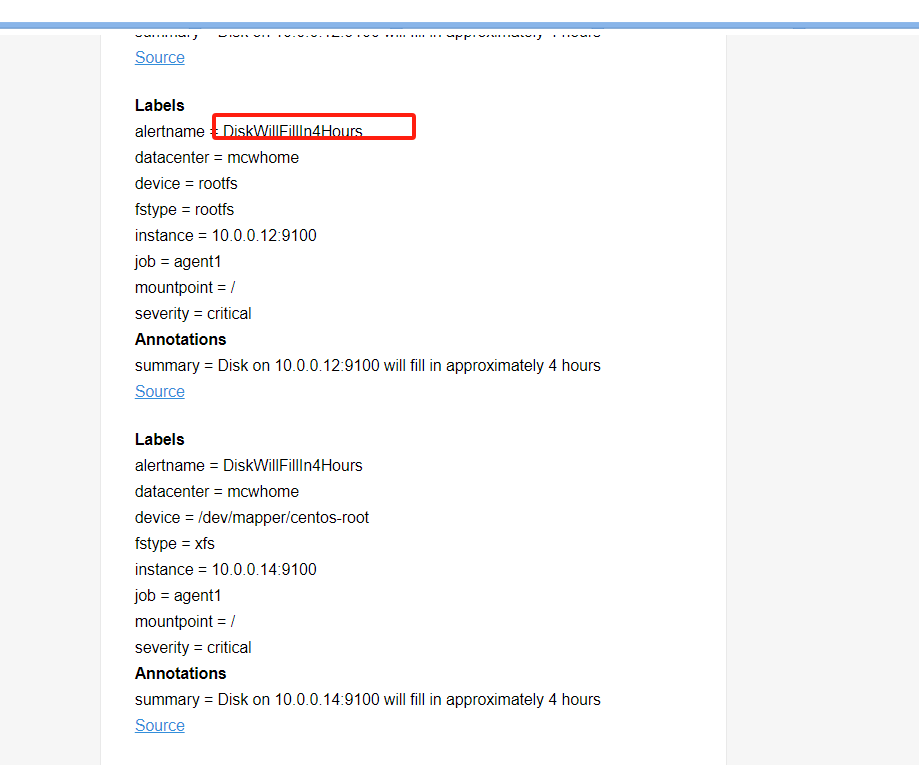
可以看到,这个警报规则触发了四个告警,并发送了邮件
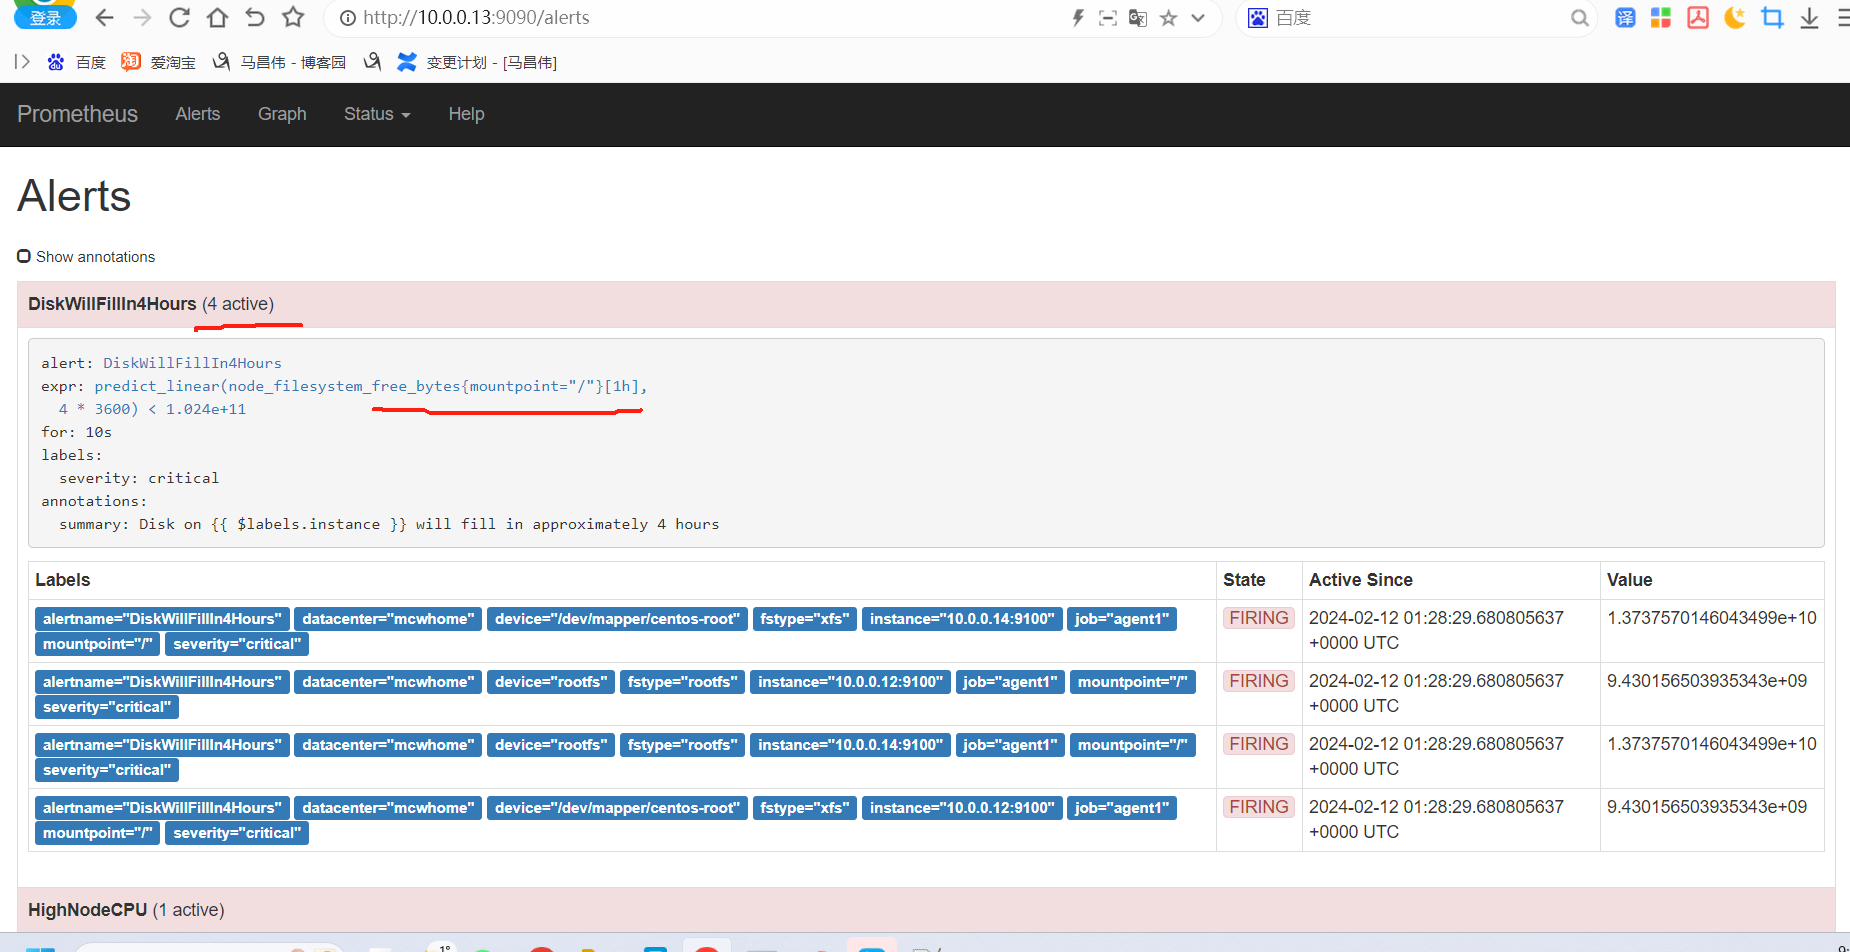
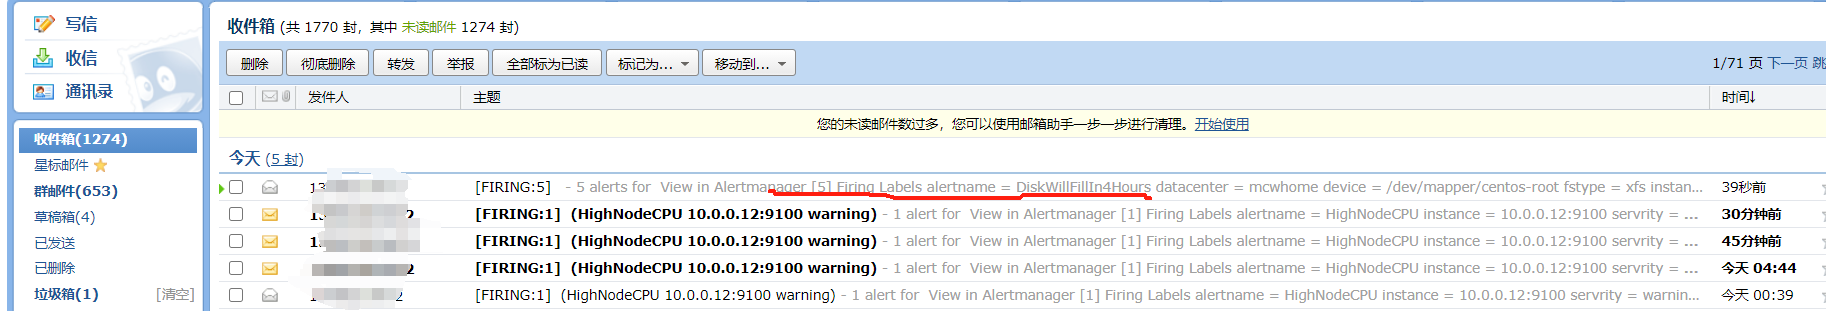
并且四条告警是一起发送出来的,都把标签和注解作为邮件内容发送出来了。而且使用标签变量的部分,都是渲染对应告警机器的标签值了
改回去之后,告警取消
根据标签过滤一下
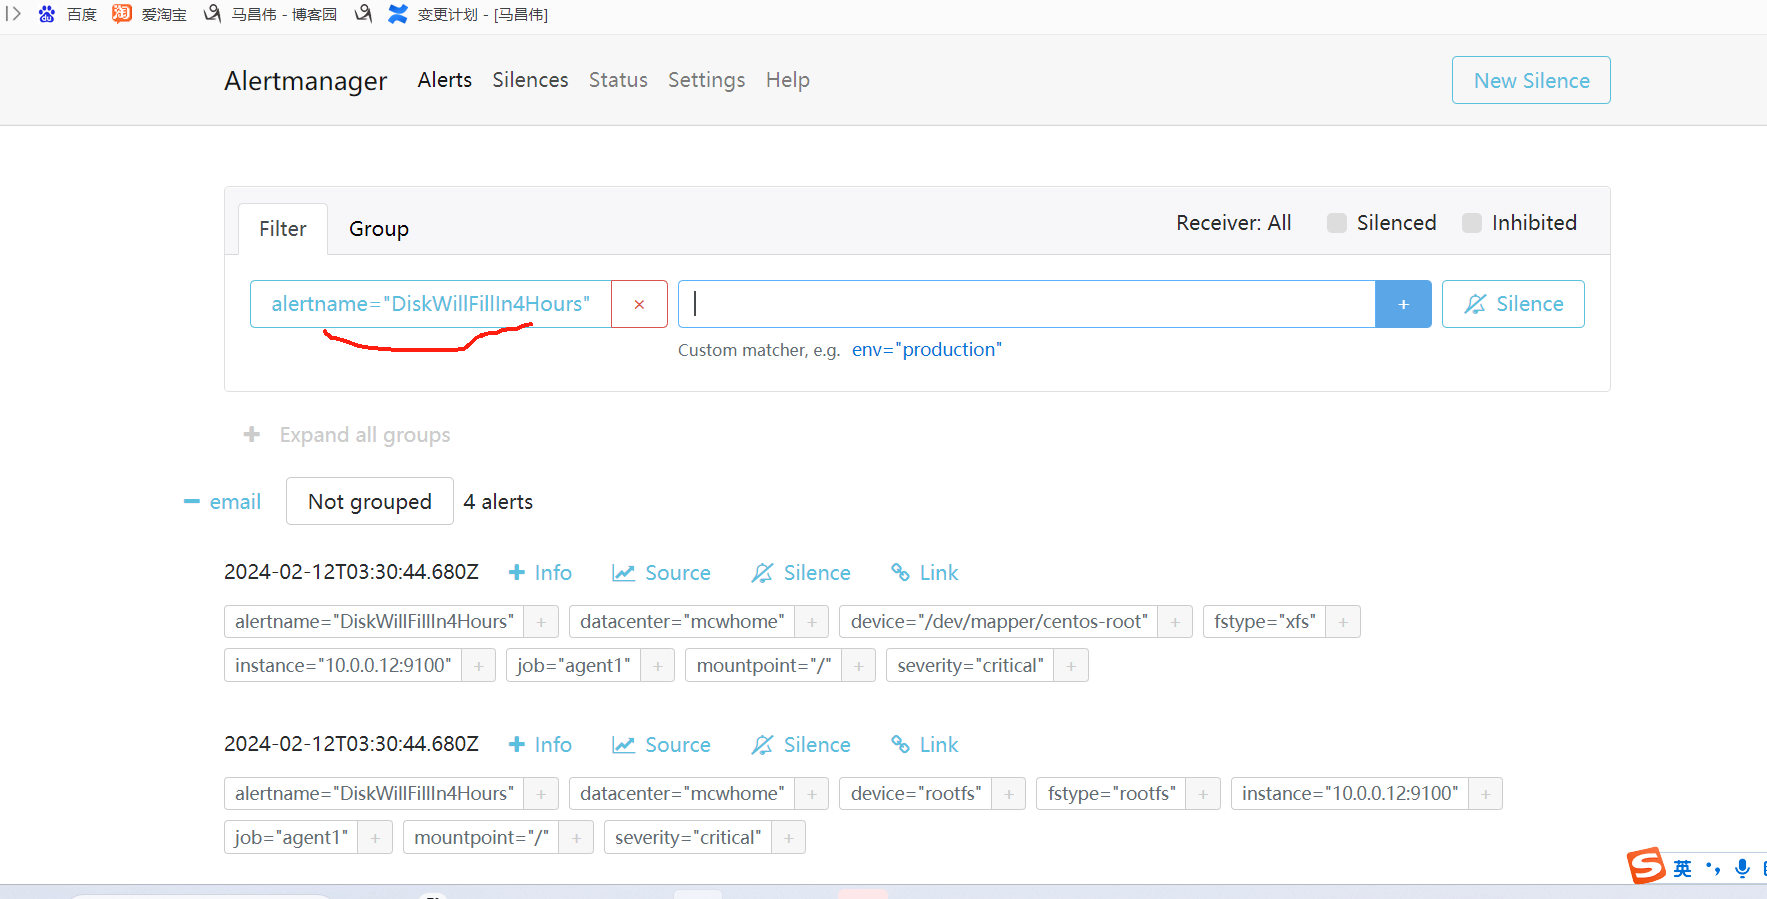
报错了
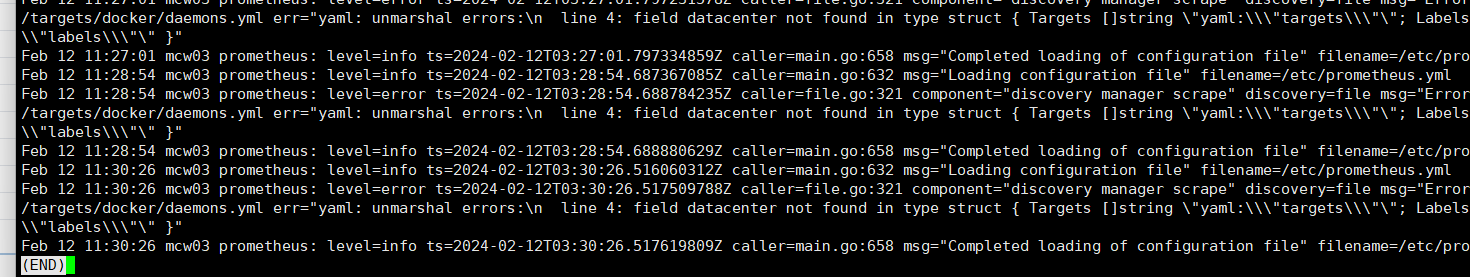
修改下job,是docker的,修改下表达式是,结果是1的就触发告警。修改时间for是10s。添加注解,注解中获取表达式的值,值是1
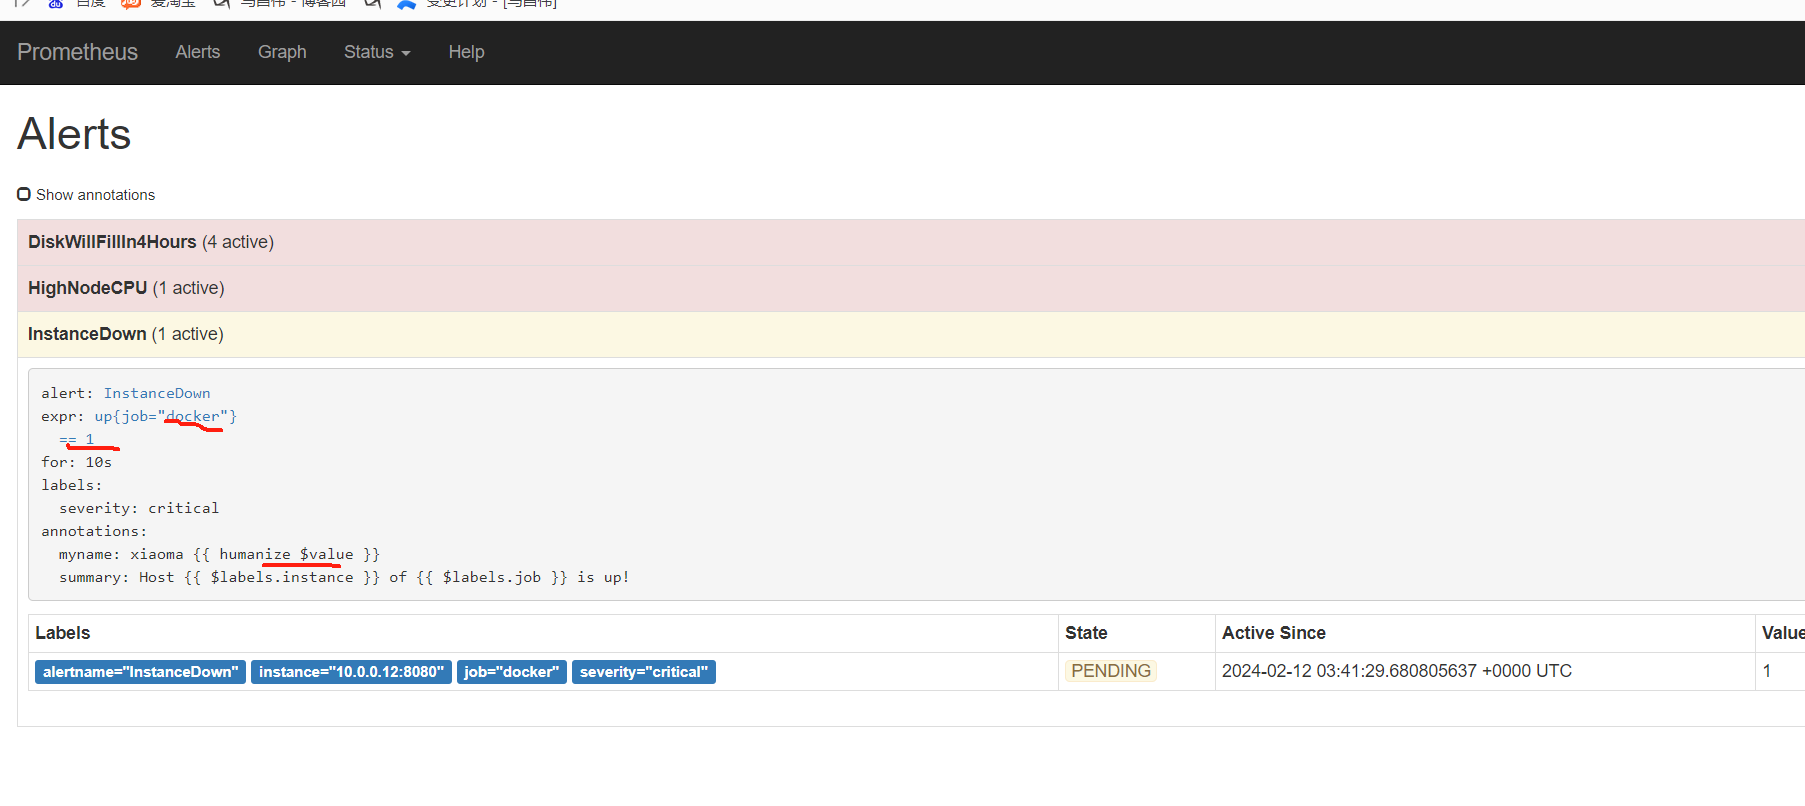
然后看邮件发送的结果,可以看到,所有的告警,都汇总到一个邮件里面了,并且获取到表达式的值,在注解中
注解中获取到表达式值为1
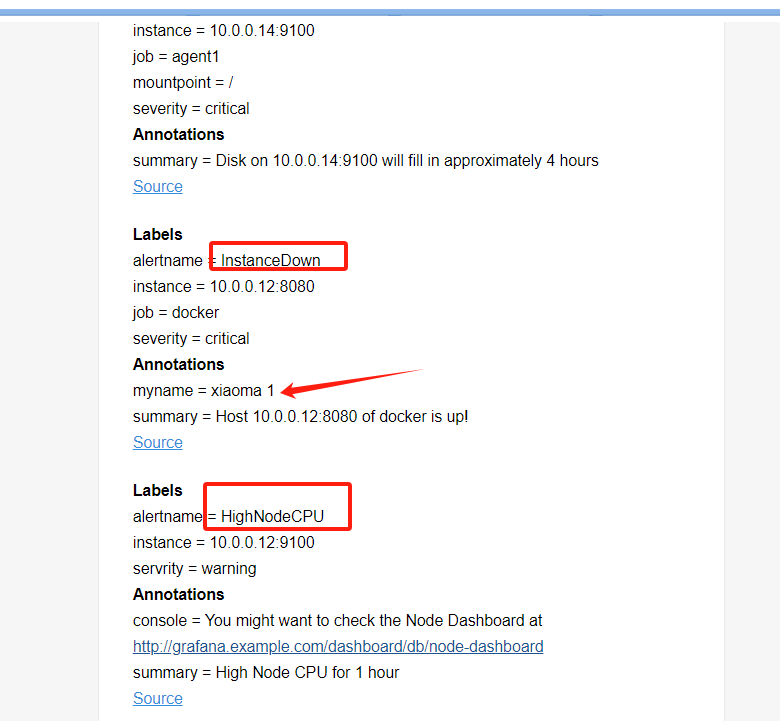
获取表达式的值
[root@mcw03 ~]# cat /etc/rules/node_alerts.yml
groups:
  - name: node_alerts
    rules:
    - alert: DiskWillFillIn4Hours
      expr: predict_linear(node_filesystem_free_bytes{mountpoint="/"}[1h],4*3600) < 102400000000
      for: 10s
      labels:
        severity: critical
      annotations:
        summary: Disk on {{ $labels.instance }} will fill in approximately 4 hours
    - alert: InstanceDown
      expr: up{job="docker"} == 1
      for: 10s
      labels:
        severity: critical
      annotations:
        summary: Host {{ $labels.instance }} of {{ $labels.job }} is up!
        myname: xiaoma {{ humanize $value }}
[root@mcw03 ~]# curl -X POST http://localhost:9090/-/reload
[root@mcw03 ~]#
Prometheus警报
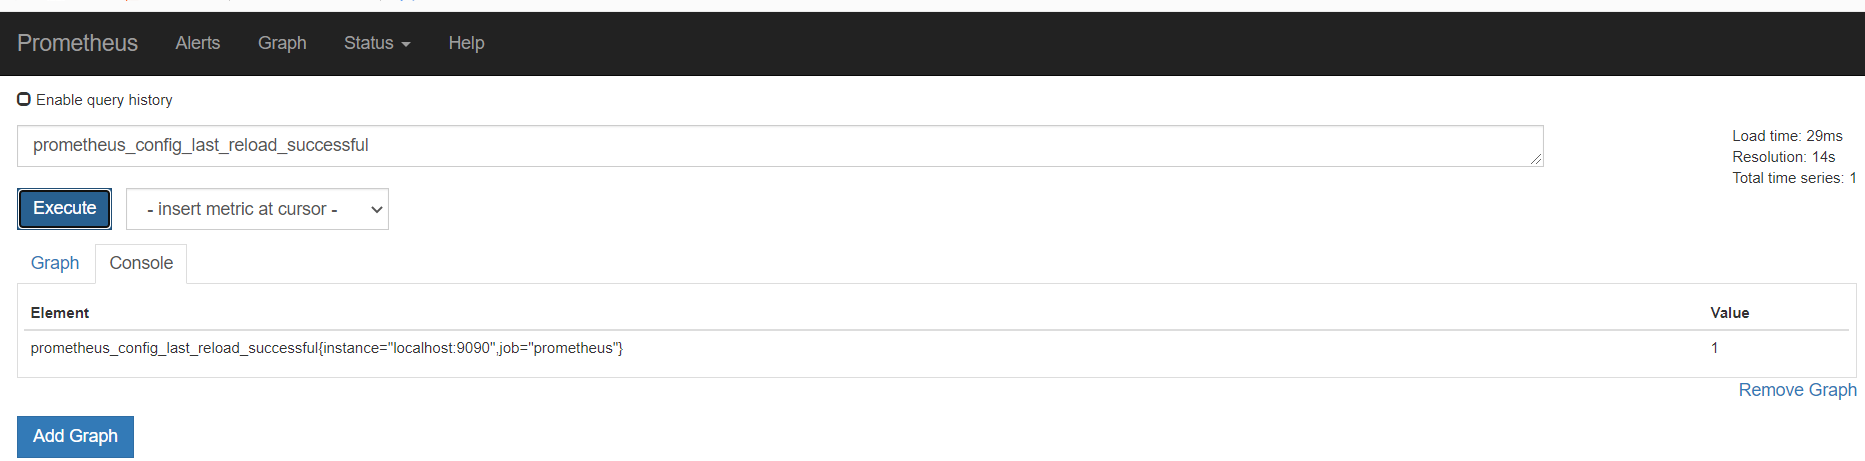
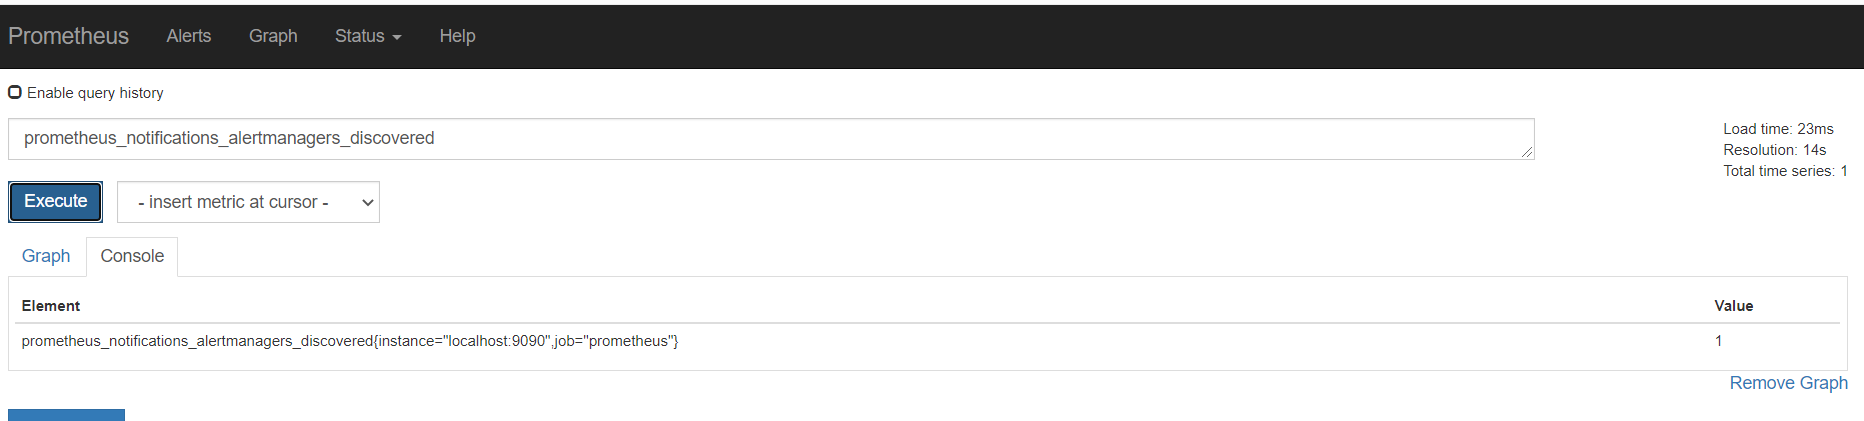
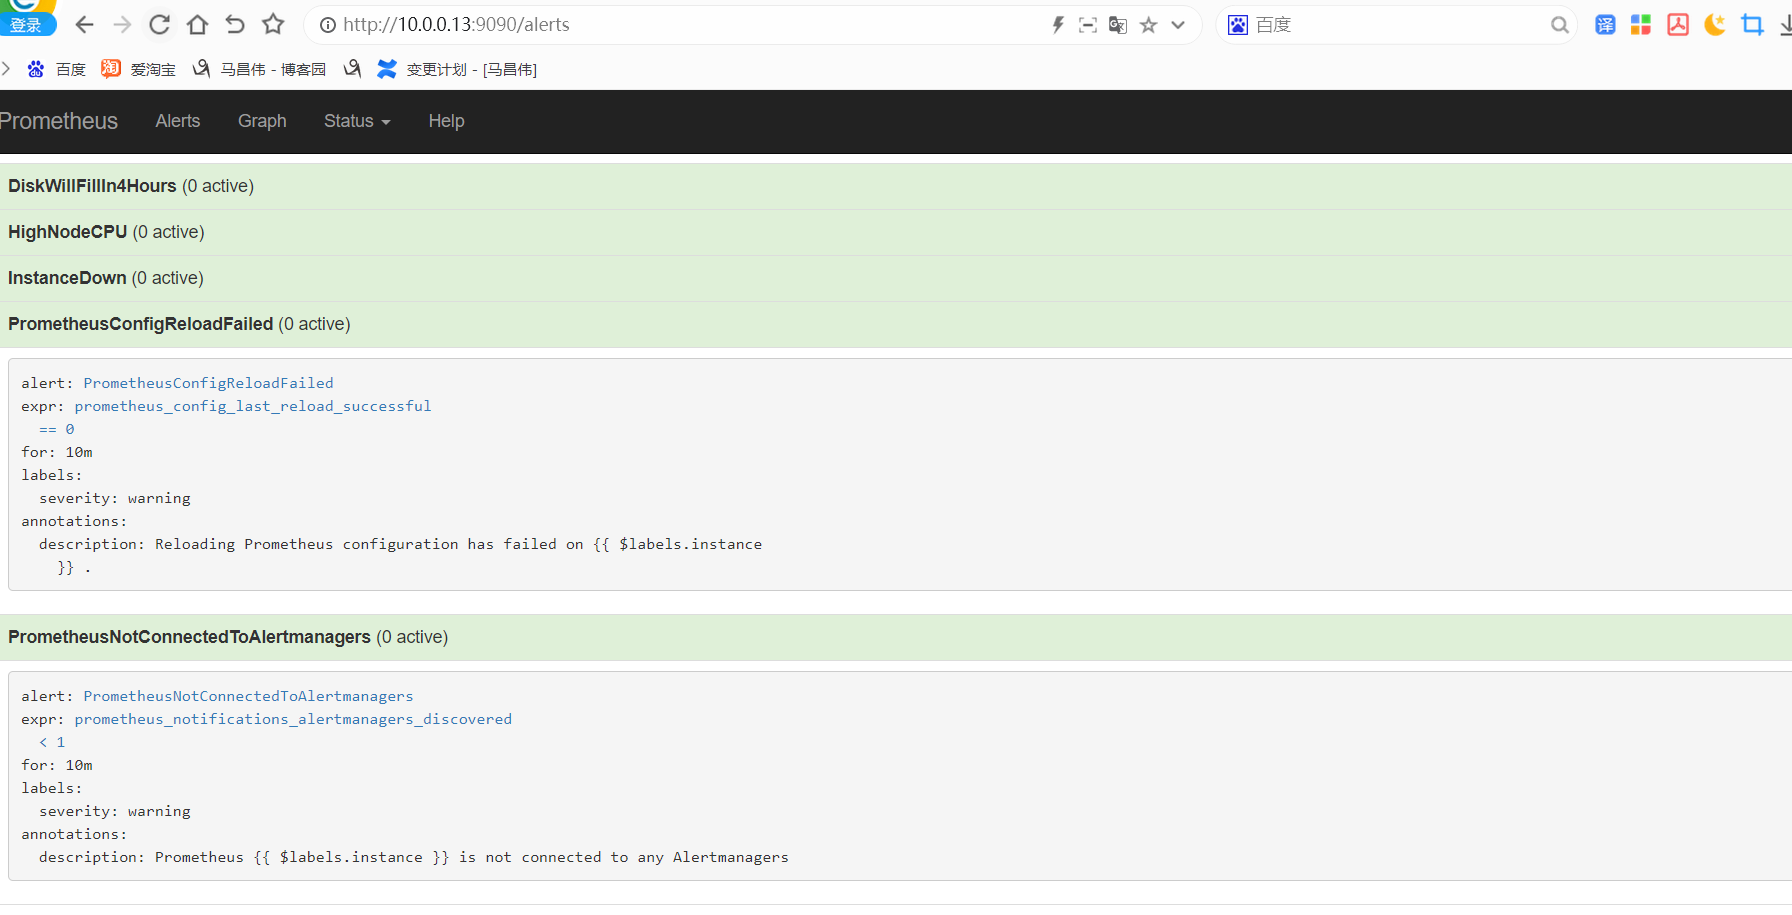
[root@mcw03 ~]# touch /etc/rules/prometheus_alerts.yml
[root@mcw03 ~]# vim /etc/rules/prometheus_alerts.yml
[root@mcw03 ~]# cat /etc/rules/prometheus_alerts.yml
groups:
  - name: prometheus_alerts
    rules:
    - alert: PrometheusConfigReloadFailed
      expr: prometheus_config_last_reload_successful == 0
      for: 10m
      labels:
        severity: warning
      annotations:
        description: Reloading Prometheus configuration has failed on {{ $labels.instance }} .
    - alert: PrometheusNotConnectedToAlertmanagers
      expr: prometheus_notifications_alertmanagers_discovered < 1
      for: 10m
      labels:
        severity: warning
      annotations:
        description: Prometheus {{ $labels.instance }} is not connected to any Alertmanagers
[root@mcw03 ~]# curl -X POST http://localhost:9090/-/reload
[root@mcw03 ~]#
修改配置,让重载失败,因为for是10分钟,估计得是10分钟后,还是这个状态,才会发送通知
[root@mcw03 ~]# vim /etc/prometheus.yml
[root@mcw03 ~]# tail -2 /etc/prometheus.yml
   #   action: labeldrop
 xxxxx
[root@mcw03 ~]# curl -X POST http://localhost:9090/-/reload
failed to reload config: couldn't load configuration (--config.file="/etc/prometheus.yml"): parsing YAML file /etc/prometheus.yml: yaml: line 53: did not find expected key
[root@mcw03 ~]#
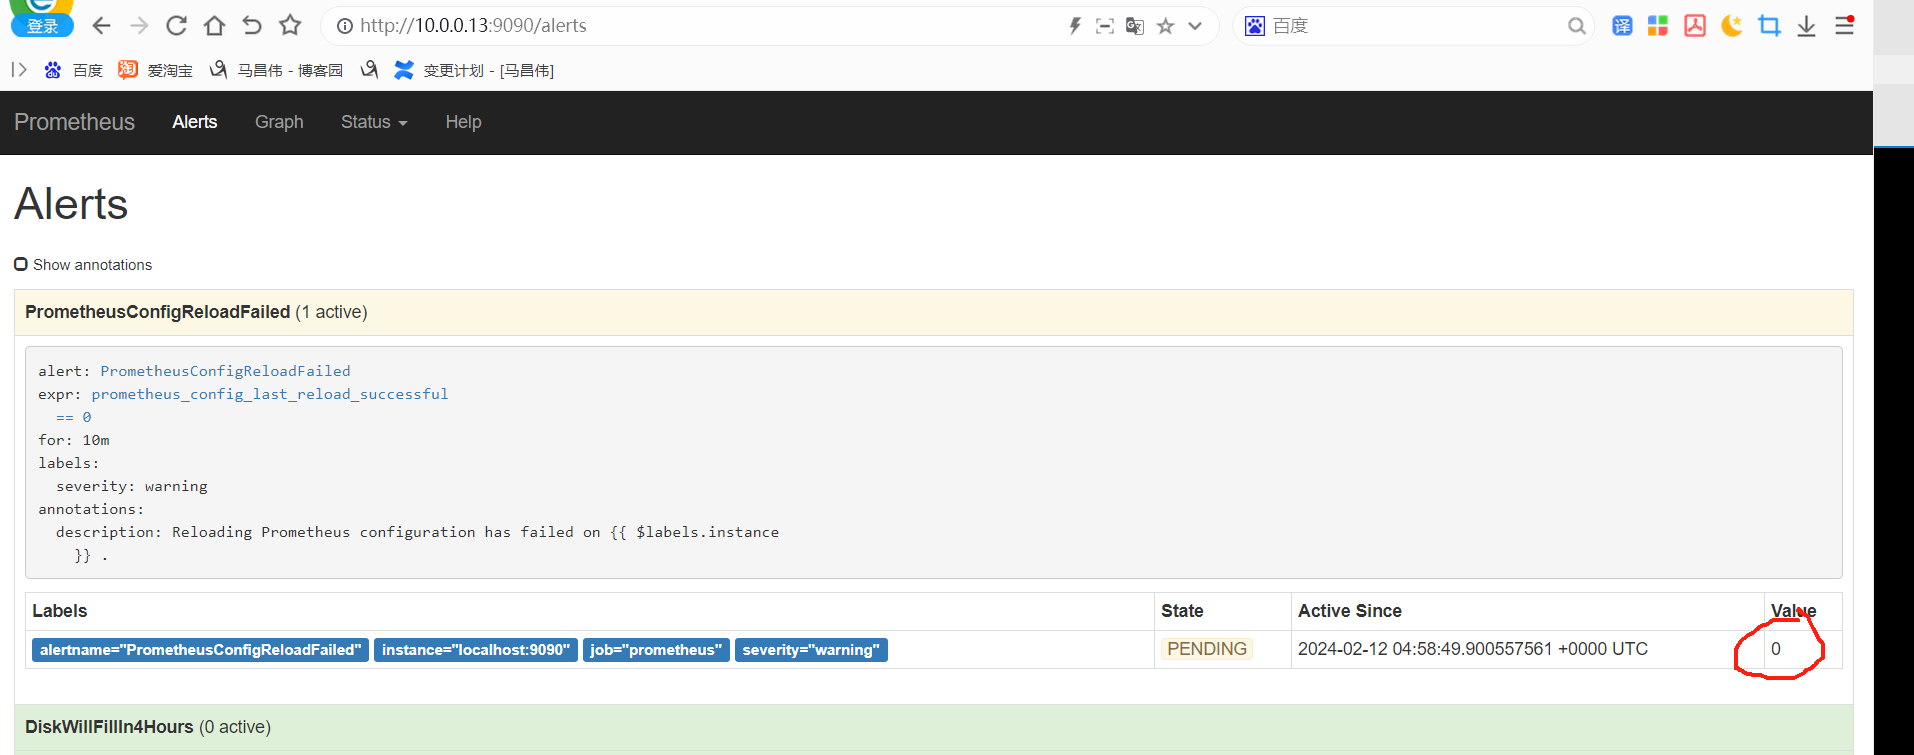
修改正确配置,然后修改告警规则for为10s。也就是10s钟后还是这个状态,就发送通知。然后把配置改坏,重载配置失败触发告警
[root@mcw03 ~]# vim /etc/rules/prometheus_alerts.yml
[root@mcw03 ~]# grep 10 /etc/rules/prometheus_alerts.yml
      for: 10s
      for: 10m
[root@mcw03 ~]# curl -X POST http://localhost:9090/-/reload
[root@mcw03 ~]# echo xxx >>/etc/prometheus.yml
[root@mcw03 ~]# curl -X POST http://localhost:9090/-/reload
failed to reload config: couldn't load configuration (--config.file="/etc/prometheus.yml"): parsing YAML file /etc/prometheus.yml: yaml: line 55: could not find expected ':'
[root@mcw03 ~]#
之前黄色是pending,现在红色是发送了通知了把
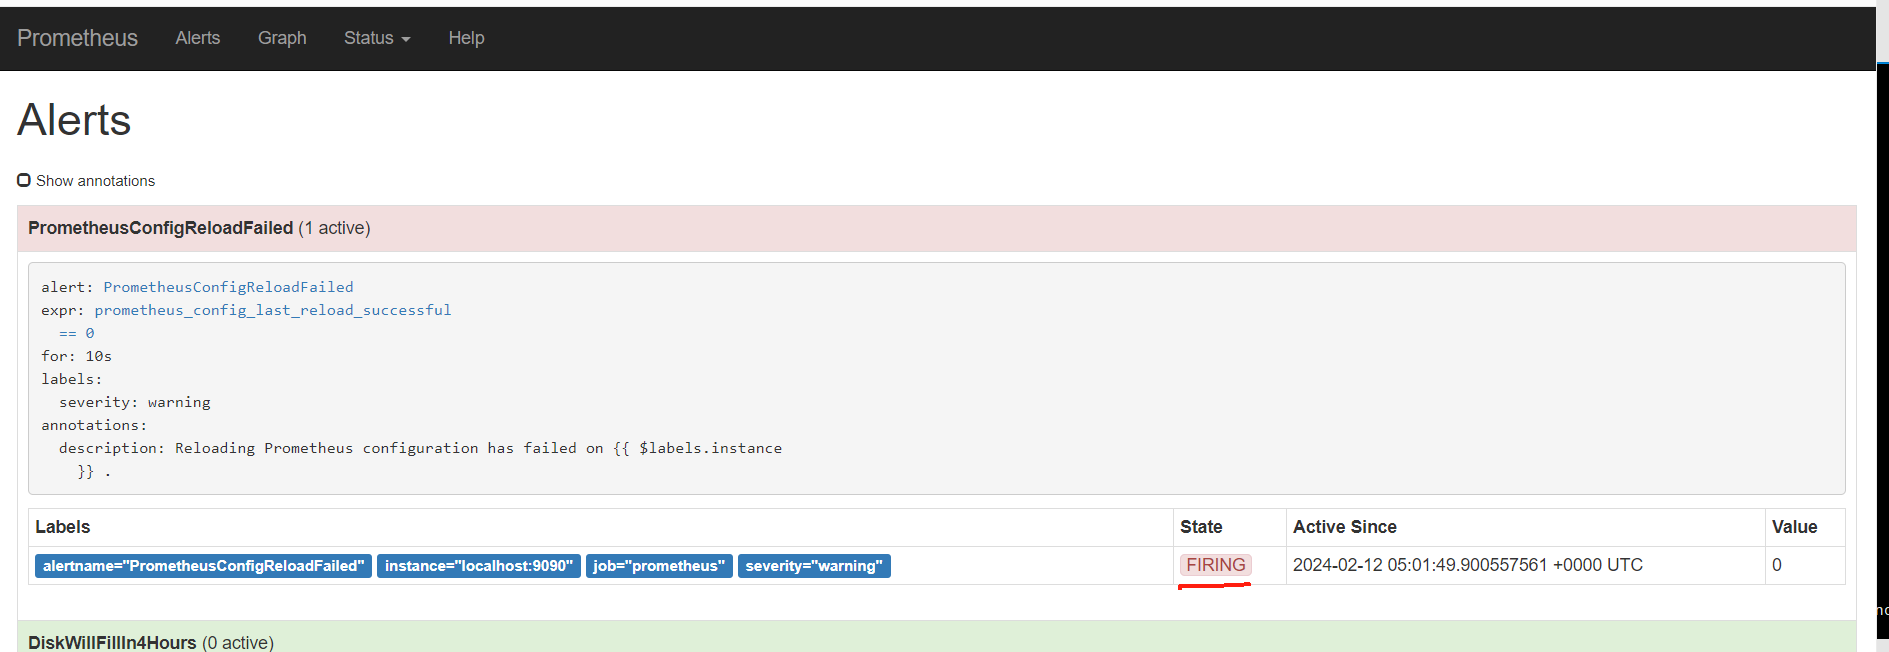
重载失败的邮件告警出来了,只是有点延迟的厉害,邮件通知,这个邮件主题,好像是标签合在一起了
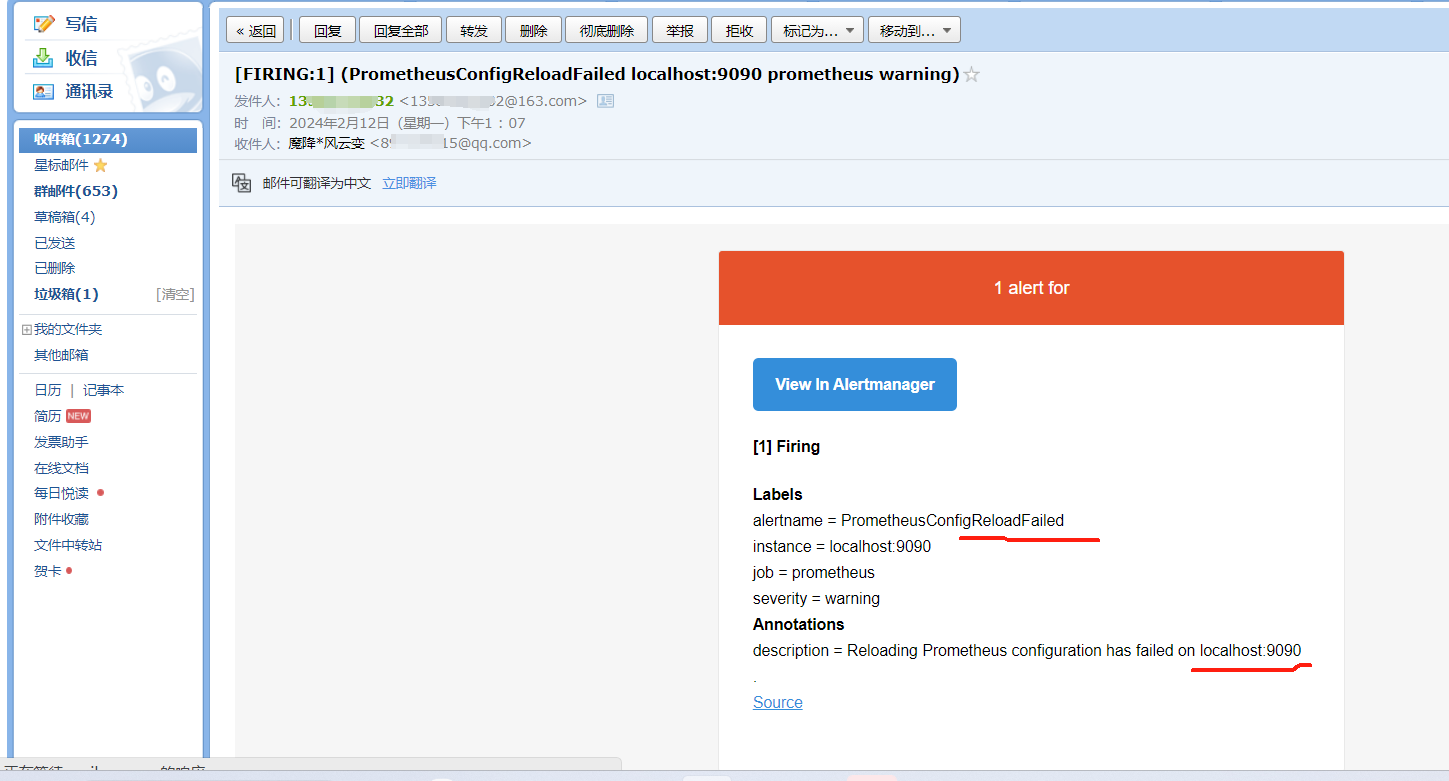
可用性警报(服务,up机器,缺失指标)
服务可用性
我们之前开启systemd,只收集三个服务的情况。
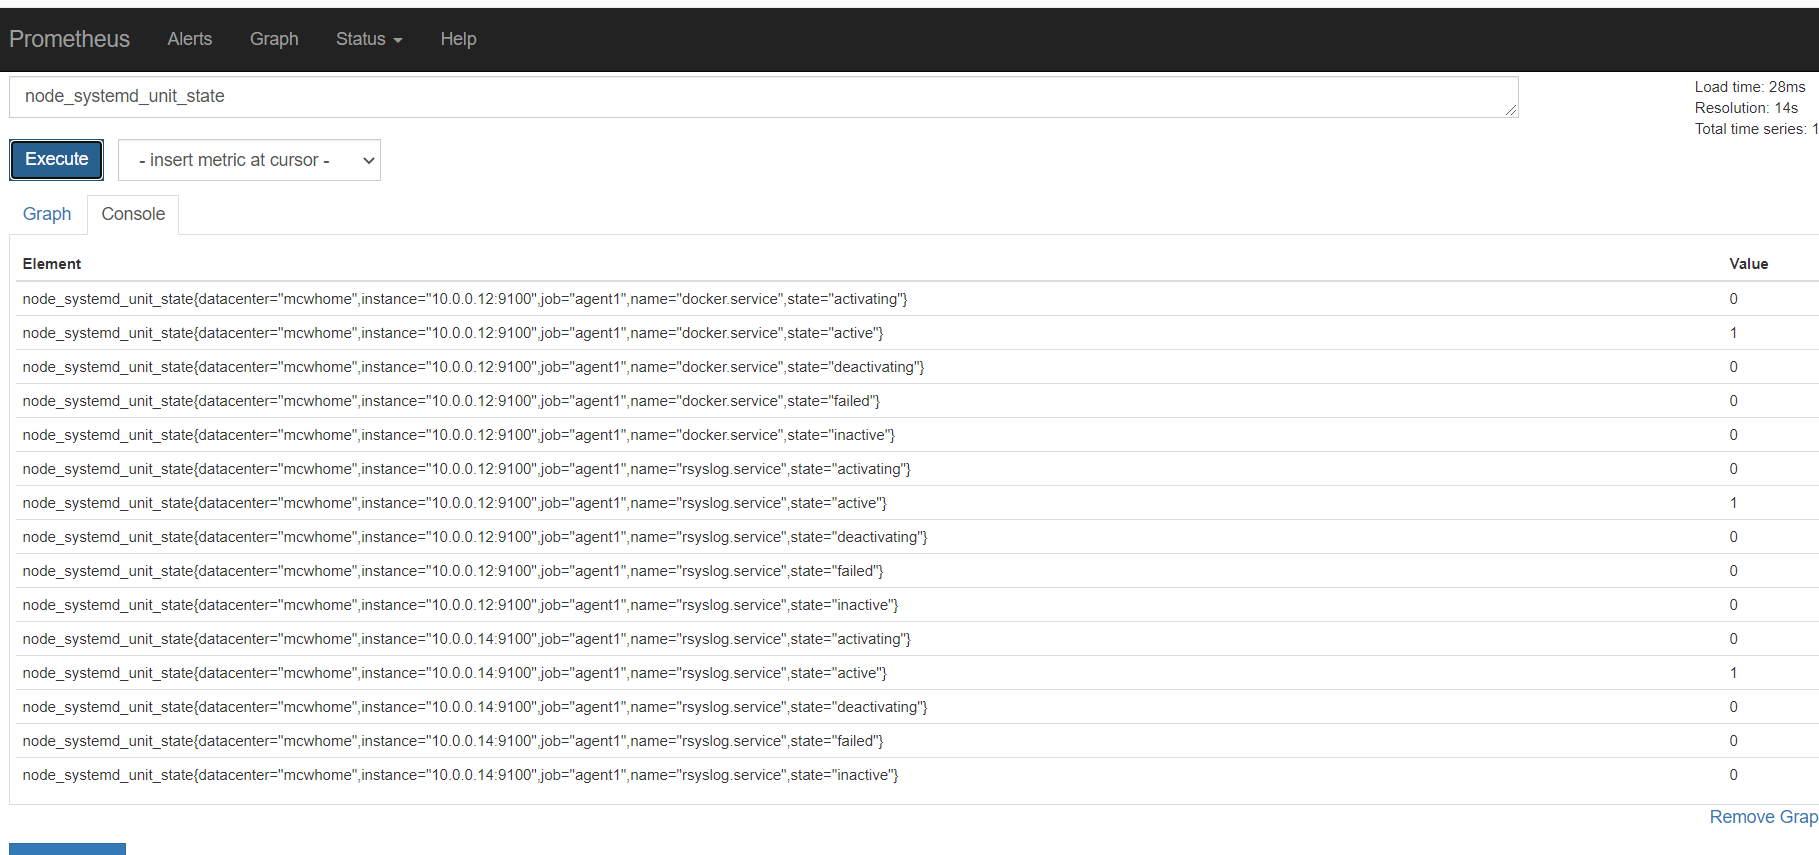
查找服务状态active不是1的,就是服务不正常的,然后告警
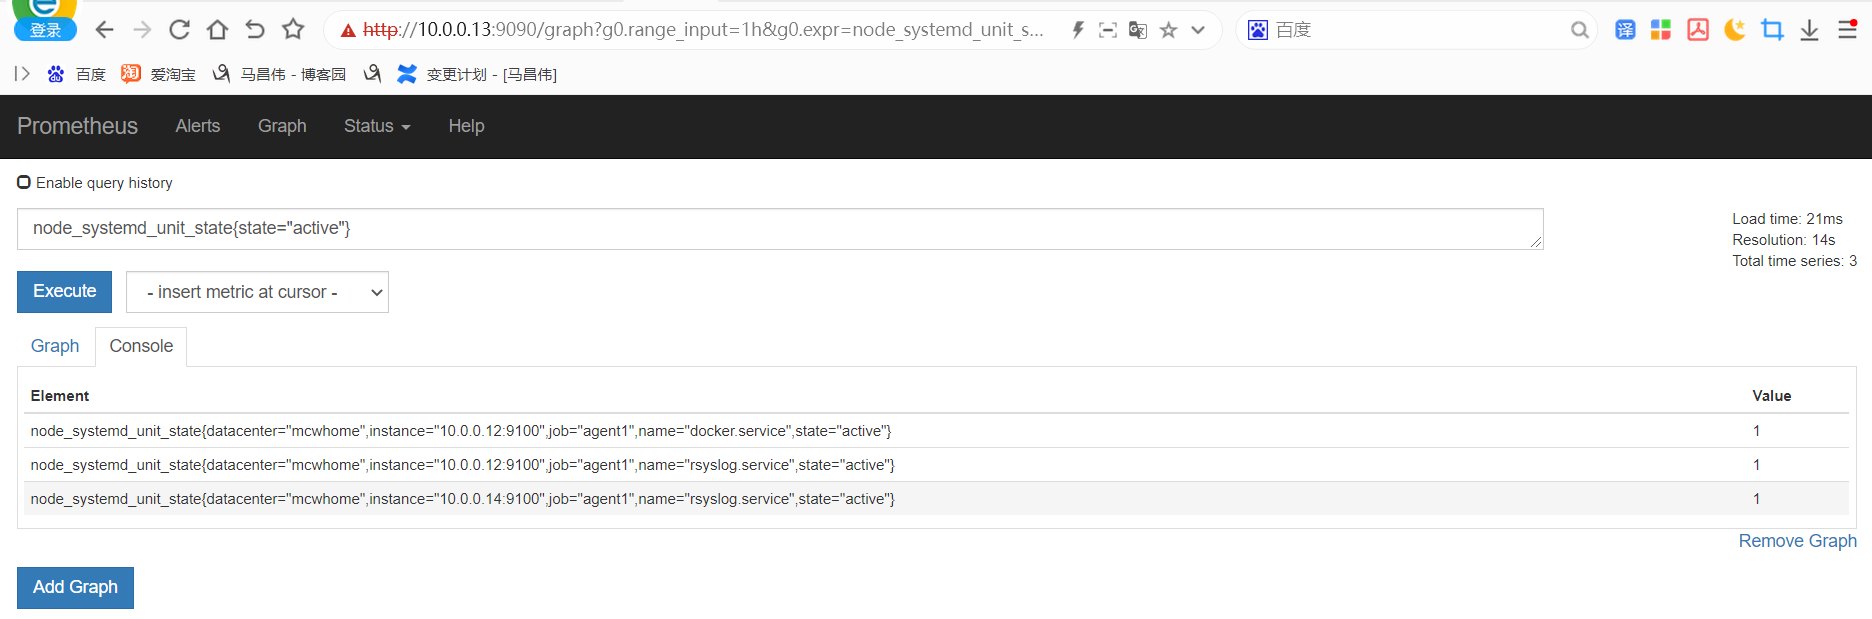
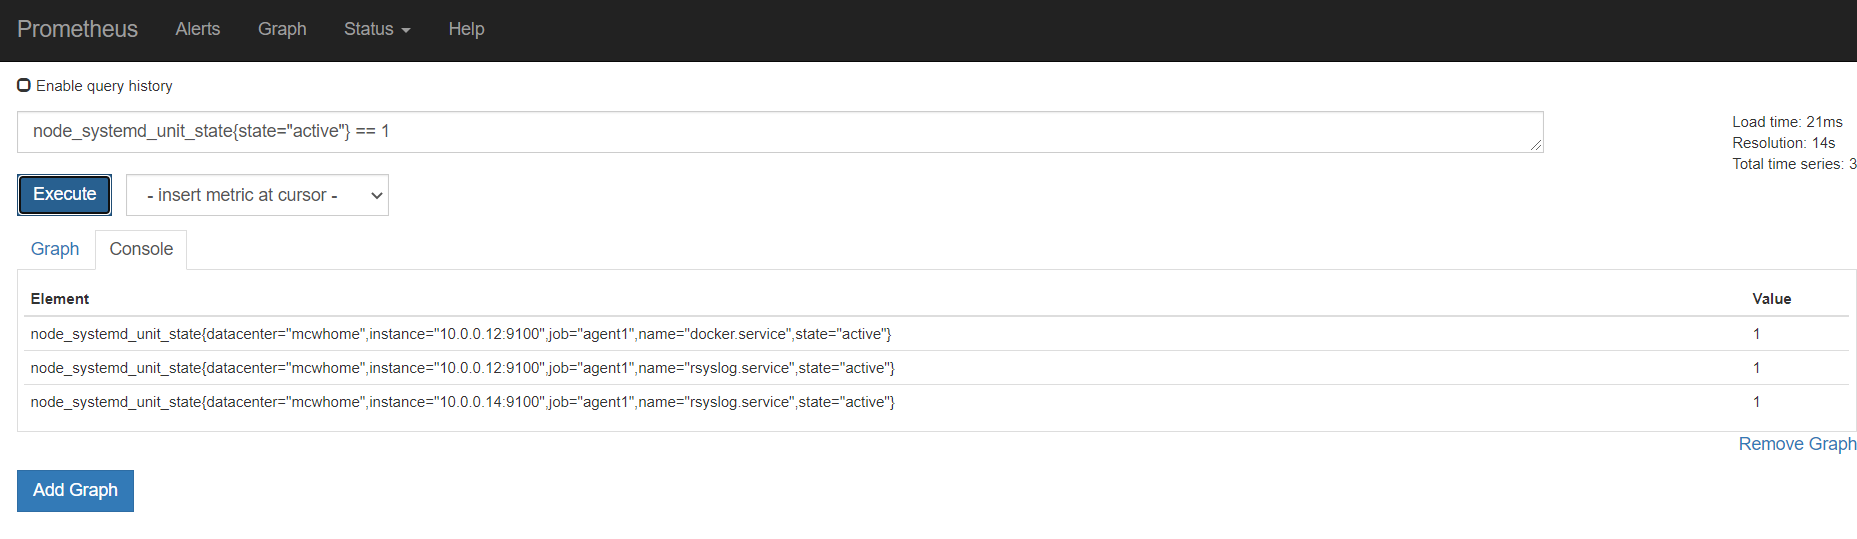
编写告警配置文件
[root@mcw03 ~]# vim /etc/rules/keyongxing_alerts.yml
[root@mcw03 ~]# cat /etc/rules/keyongxing_alerts.yml
groups:
  - name: keyongxing_alerts
    rules:
    - alert: NodeServiceDown
      expr: node_systemd_unit_state{state="active"} == 0
      for: 60s
      labels:
        severity: critical
      annotations:
        summary: Service {{ $labels.name }} on {{ $labels.instance }} is nolonger active!
        description: Werner Heisenberg says - "OMG Where's my service?"
[root@mcw03 ~]# curl -X POST http://localhost:9090/-/reload
[root@mcw03 ~]#
[root@mcw03 ~]# vim /etc/rules/keyongxing_alerts.yml
[root@mcw03 ~]# cat /etc/rules/keyongxing_alerts.yml
groups:
  - name: Keyongxing_alerts
    rules:
    - alert: NodeServiceDown
      expr: node_systemd_unit_state{state="active"} != 1
      for: 60s
      labels:
        severity: critical
      annotations:
        summary: Service {{ $labels.name }} on {{ $labels.instance }} is nolonger active!
        description: Werner Heisenberg says - "OMG Where's my service?"
[root@mcw03 ~]# curl -X POST http://localhost:9090/-/reload
没有看到这个告警规则,看到报错,先把报错去掉
Feb 12 13:32:32 mcw03 prometheus: level=error ts=2024-02-12T05:32:32.909623139Z caller=file.go:321 component="discovery manager scrape" discovery=file msg="Error reading file" path=/etc/targets/docker/daemons.yml err="yaml: unmarshal errors:\n line 4: field datacenter not found in type struct { Targets []string \"yaml:\\\"targets\\\"\"; Labels model.LabelSet \"yaml:\\\"labels\\\"\" }"
修改完成之后,告警规则还是没有出来,
[root@mcw03 ~]# cat /etc/targets/docker/daemons.yml
- targets:
  - "10.0.0.12:8080"
- labels:
  "datacenter": "mcwymlhome"
[root@mcw03 ~]# vim /etc/targets/docker/daemons.yml
[root@mcw03 ~]# cat /etc/targets/docker/daemons.yml
- targets:
  - "10.0.0.12:8080"
[root@mcw03 ~]# curl -X POST http://localhost:9090/-/reload
[root@mcw03 ~]#
放到别处一份,在重载一下
[root@mcw03 ~]# cat /etc/rules/keyongxing_alerts.yml
groups:
  - name: Keyongxing_alerts
    rules:
    - alert: NodeServiceDown
      expr: node_systemd_unit_state{state="active"} != 1
      for: 60s
      labels:
        severity: critical
      annotations:
        summary: Service {{ $labels.name }} on {{ $labels.instance }} is nolonger active!
        description: Werner Heisenberg says - "OMG Where's my service?"
[root@mcw03 ~]# vim /etc/rules/node_rules.yml
[root@mcw03 ~]# cat /etc/rules/node_rules.yml
groups:
  - name: node_rules
    interval: 10s
    rules:
    - record: instance:node_cpu:avg_rate5m
      expr:  100 - avg(irate(node_cpu_seconds_total{job='agent1',mode='idle'}[5m])) by (instance)*100
    - record: instace:node_memory_usage:percentage
      expr: (node_memory_MemTotal_bytes-(node_memory_MemFree_bytes+node_memory_Buffers_bytes+node_memory_Cached_bytes))/node_memory_MemTotal_bytes*100
      labels:
        metric_type: aggregation
        name: machangwei
  - name: xiaoma_rules
    rules:
    - record: mcw:diskusage
      expr: (node_filesystem_size_bytes{mountpoint="/"}-node_filesystem_free_bytes{mountpoint="/"})/node_filesystem_size_bytes{mountpoint="/"}*100
    - alert: NodeServiceDown
      expr: node_systemd_unit_state{state="active"} != 1
      for: 60s
      labels:
        severity: critical
      annotations:
        summary: Service {{ $labels.name }} on {{ $labels.instance }} is nolonger active!
        description: Werner Heisenberg says - "OMG Where's my service?"

[root@mcw03 ~]# curl -X POST http://localhost:9090/-/reload
[root@mcw03 ~]#
可以看到,可以同名的。现在是两个,我们找的是alert的名字,而不是找组的-name名字,找错了
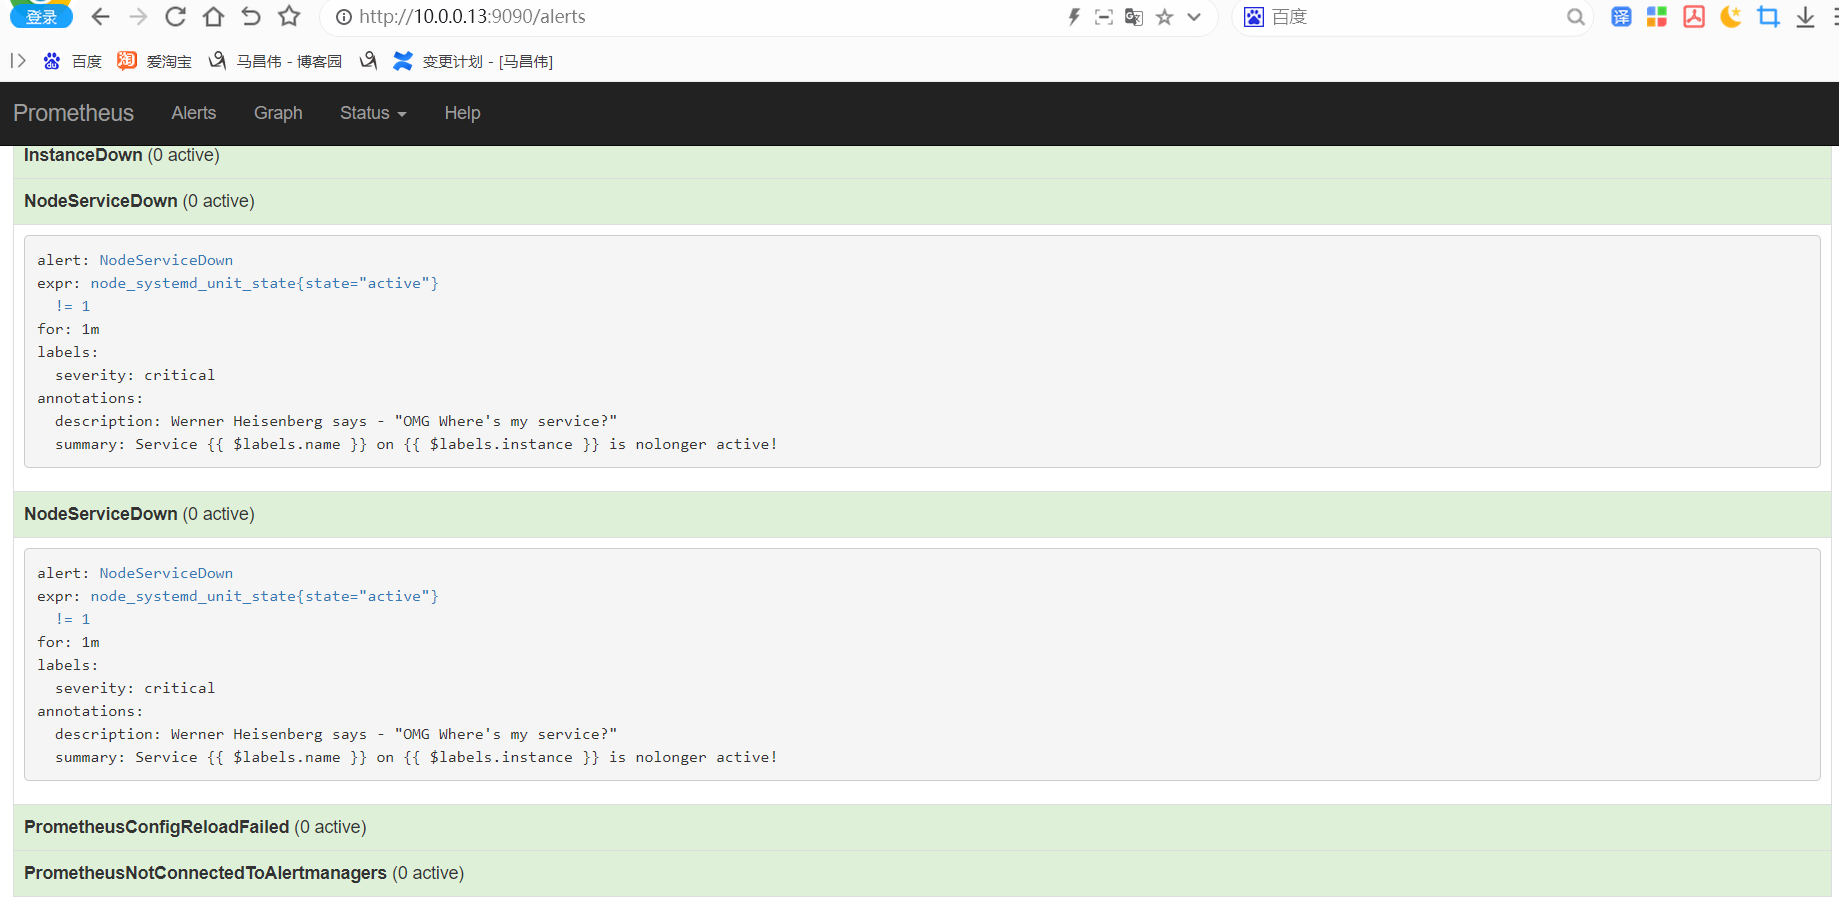
我们停掉这个服务,触发一下告警
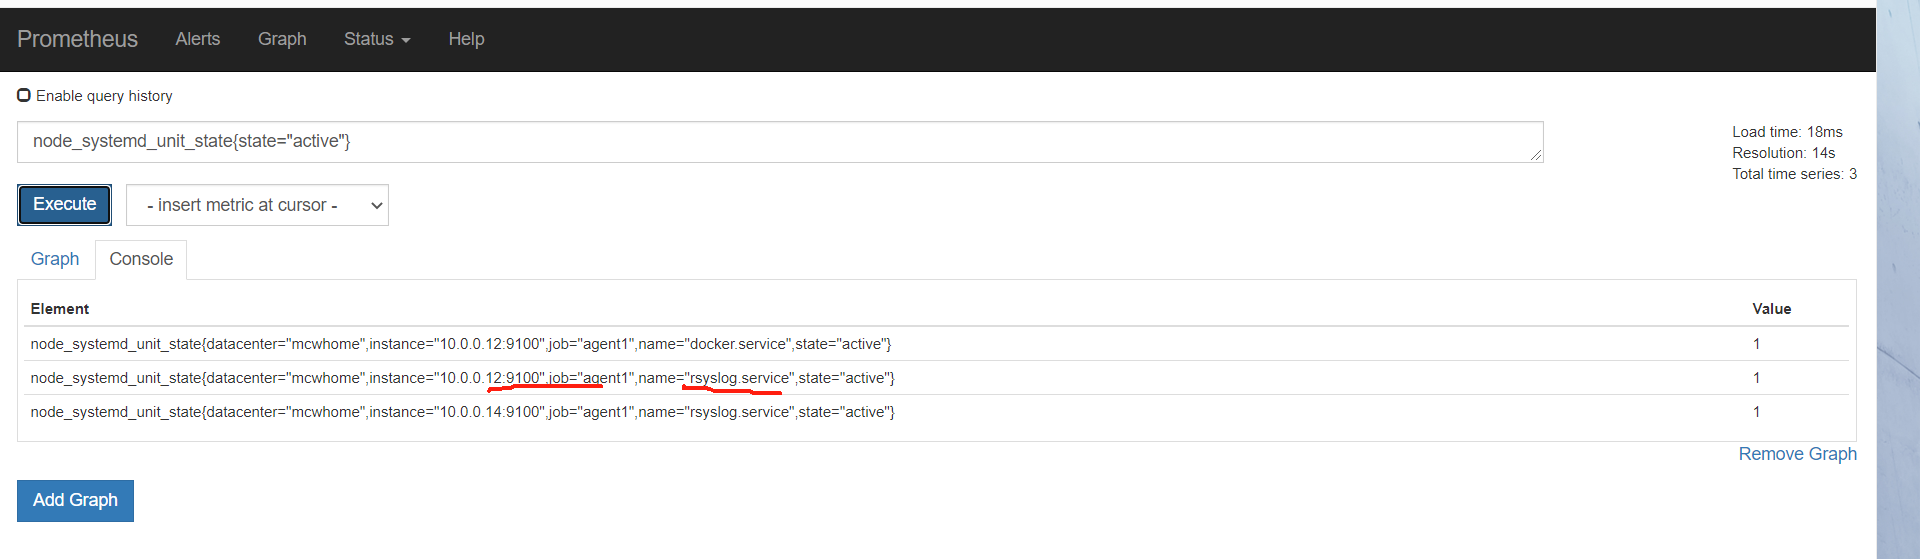
停止服务
[root@mcw02 ~]# systemctl status rsyslog.service
● rsyslog.service - System Logging Service
   Loaded: loaded (/usr/lib/systemd/system/rsyslog.service; enabled; vendor preset: enabled)
   Active: active (running) since Sat 2024-02-10 22:40:47 CST; 1 day 15h ago
     Docs: man:rsyslogd(8)
           http://www.rsyslog.com/doc/
 Main PID: 1053 (rsyslogd)
   Memory: 68.0K
   CGroup: /system.slice/rsyslog.service
           └─1053 /usr/sbin/rsyslogd -n

Feb 10 22:40:42 mcw02 systemd[1]: Starting System Logging Service...
Feb 10 22:40:44 mcw02 rsyslogd[1053]:  [origin software="rsyslogd" swVersion="8.24.0" x-pid="1053" x-info="http://www.rsyslog.com"] start
Feb 10 22:40:44 mcw02 rsyslogd[1053]: imjournal: fscanf on state file `/var/lib/rsyslog/imjournal.state' failed  [v8.24.0 try http://www.rsyslog.com/e/2027 ]
Feb 10 22:40:44 mcw02 rsyslogd[1053]: imjournal: ignoring invalid state file [v8.24.0]
Feb 10 22:40:47 mcw02 systemd[1]: Started System Logging Service.
Feb 11 03:48:04 mcw02 rsyslogd[1053]:  [origin software="rsyslogd" swVersion="8.24.0" x-pid="1053" x-info="http://www.rsyslog.com"] rsyslogd was HUPed
[root@mcw02 ~]#
[root@mcw02 ~]# systemctl stop rsyslog.service
[root@mcw02 ~]# systemctl status rsyslog.service
● rsyslog.service - System Logging Service
   Loaded: loaded (/usr/lib/systemd/system/rsyslog.service; enabled; vendor preset: enabled)
   Active: inactive (dead) since Mon 2024-02-12 13:43:13 CST; 2s ago
     Docs: man:rsyslogd(8)
           http://www.rsyslog.com/doc/
  Process: 1053 ExecStart=/usr/sbin/rsyslogd -n $SYSLOGD_OPTIONS (code=exited, status=0/SUCCESS)
 Main PID: 1053 (code=exited, status=0/SUCCESS)

Feb 10 22:40:42 mcw02 systemd[1]: Starting System Logging Service...
Feb 10 22:40:44 mcw02 rsyslogd[1053]:  [origin software="rsyslogd" swVersion="8.24.0" x-pid="1053" x-info="http://www.rsyslog.com"] start
Feb 10 22:40:44 mcw02 rsyslogd[1053]: imjournal: fscanf on state file `/var/lib/rsyslog/imjournal.state' failed  [v8.24.0 try http://www.rsyslog.com/e/2027 ]
Feb 10 22:40:44 mcw02 rsyslogd[1053]: imjournal: ignoring invalid state file [v8.24.0]
Feb 10 22:40:47 mcw02 systemd[1]: Started System Logging Service.
Feb 11 03:48:04 mcw02 rsyslogd[1053]:  [origin software="rsyslogd" swVersion="8.24.0" x-pid="1053" x-info="http://www.rsyslog.com"] rsyslogd was HUPed
Feb 12 13:43:13 mcw02 systemd[1]: Stopping System Logging Service...
Feb 12 13:43:13 mcw02 rsyslogd[1053]:  [origin software="rsyslogd" swVersion="8.24.0" x-pid="1053" x-info="http://www.rsyslog.com"] exiting on signal 15.
Feb 12 13:43:13 mcw02 systemd[1]: Stopped System Logging Service.
[root@mcw02 ~]#
已经触发状态不等于1了
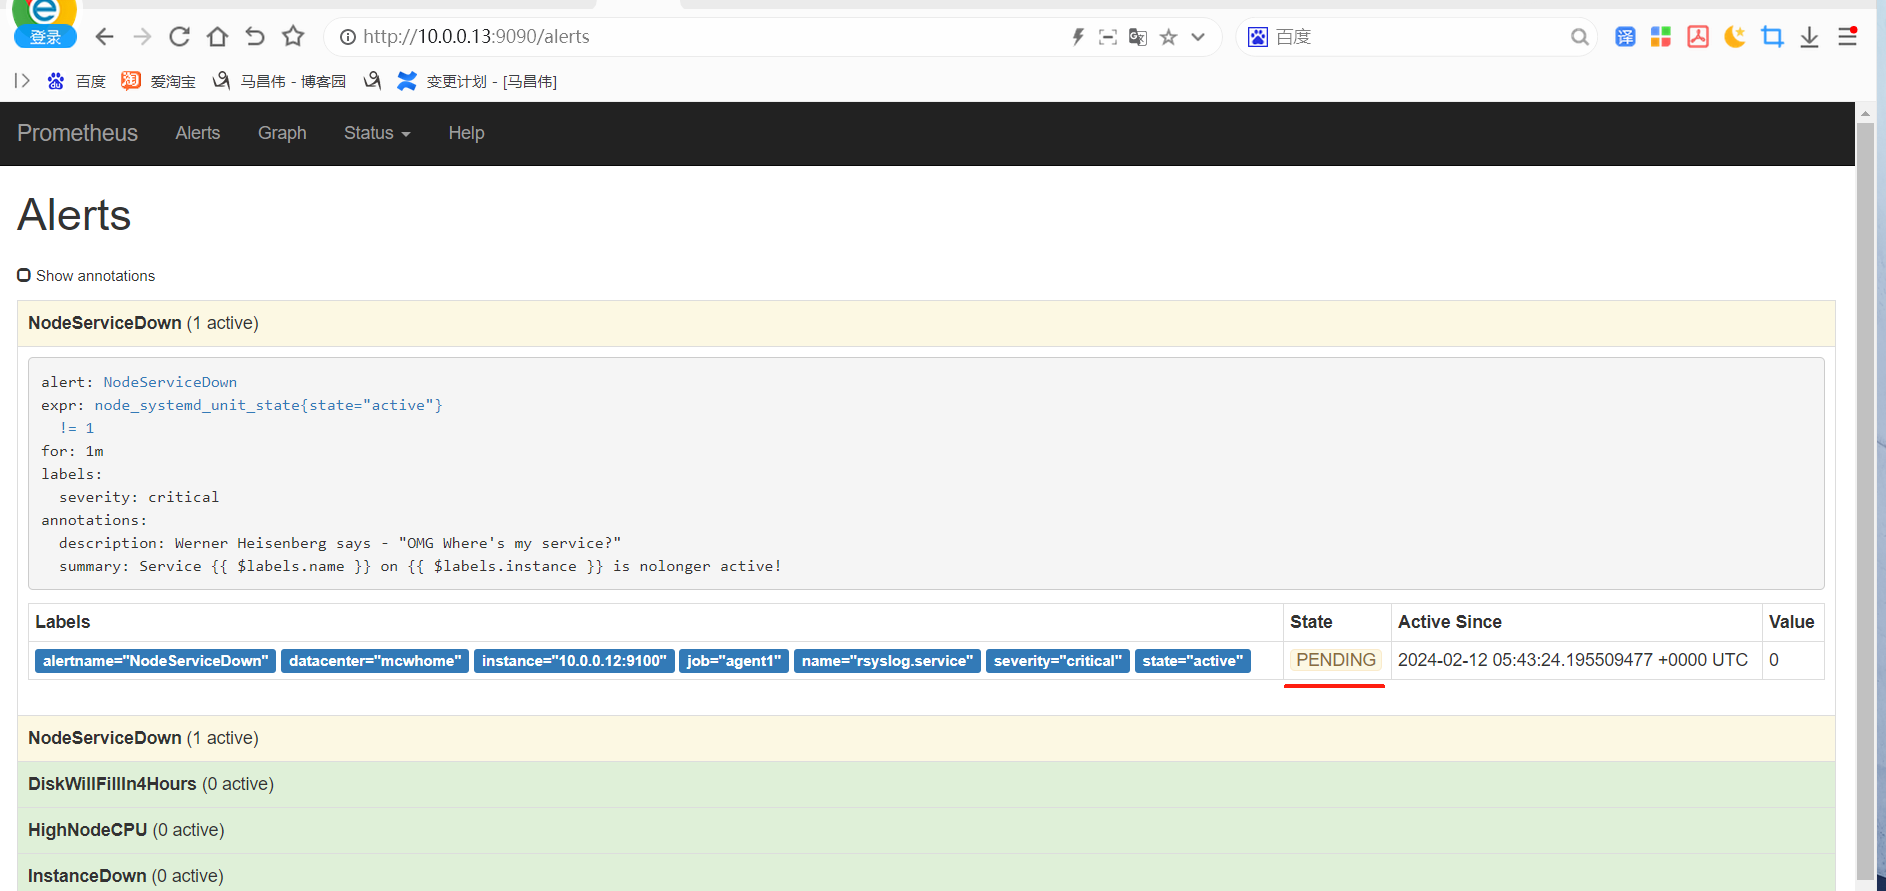
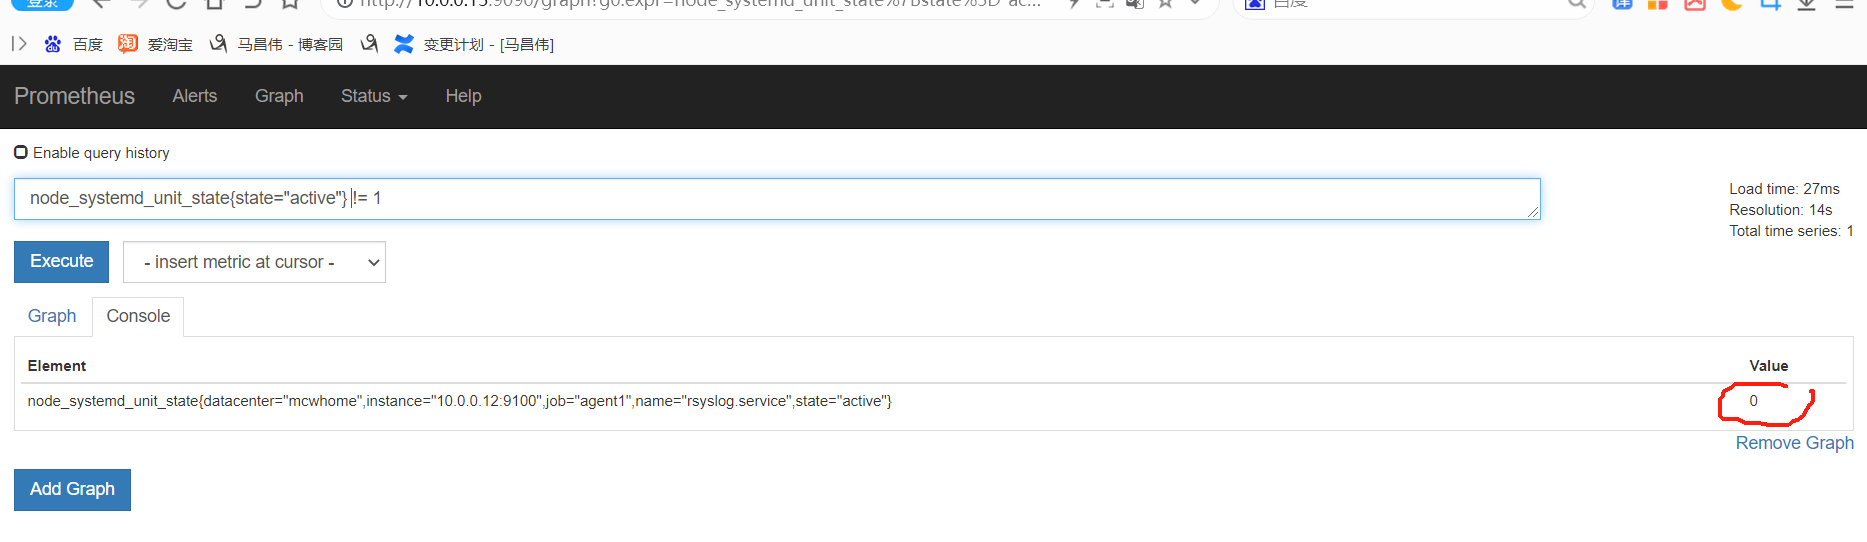
发送 告警通知。虽然告警规则,同样的规则写了两次,并且两个都是触发告警状态,但是这里只发送了一次通知,合理
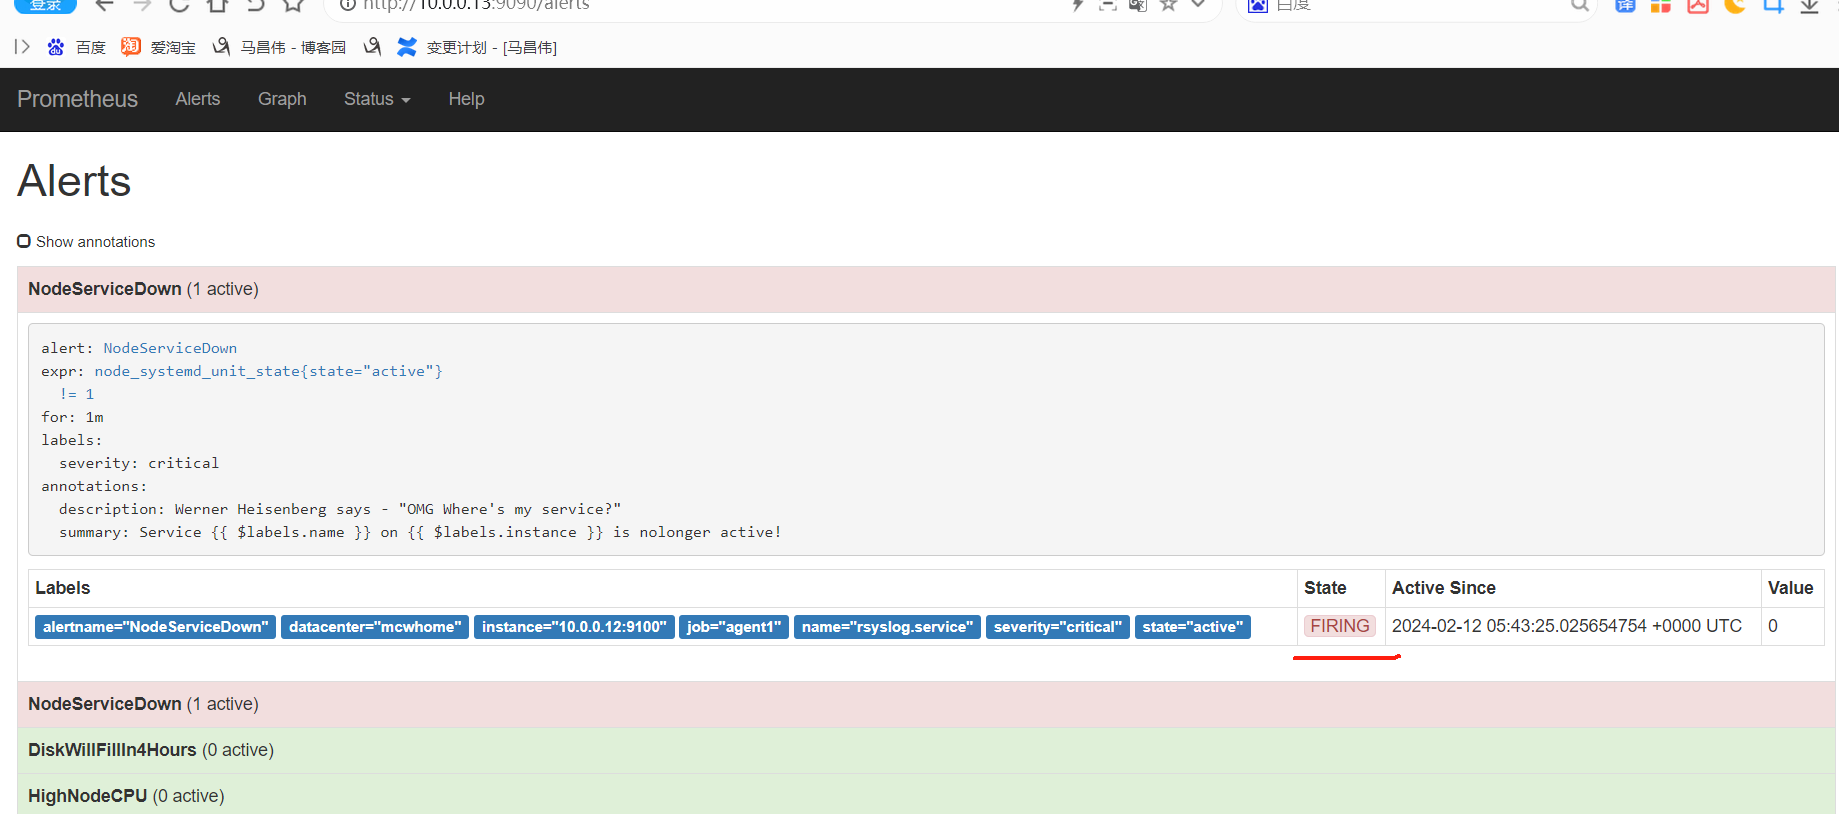
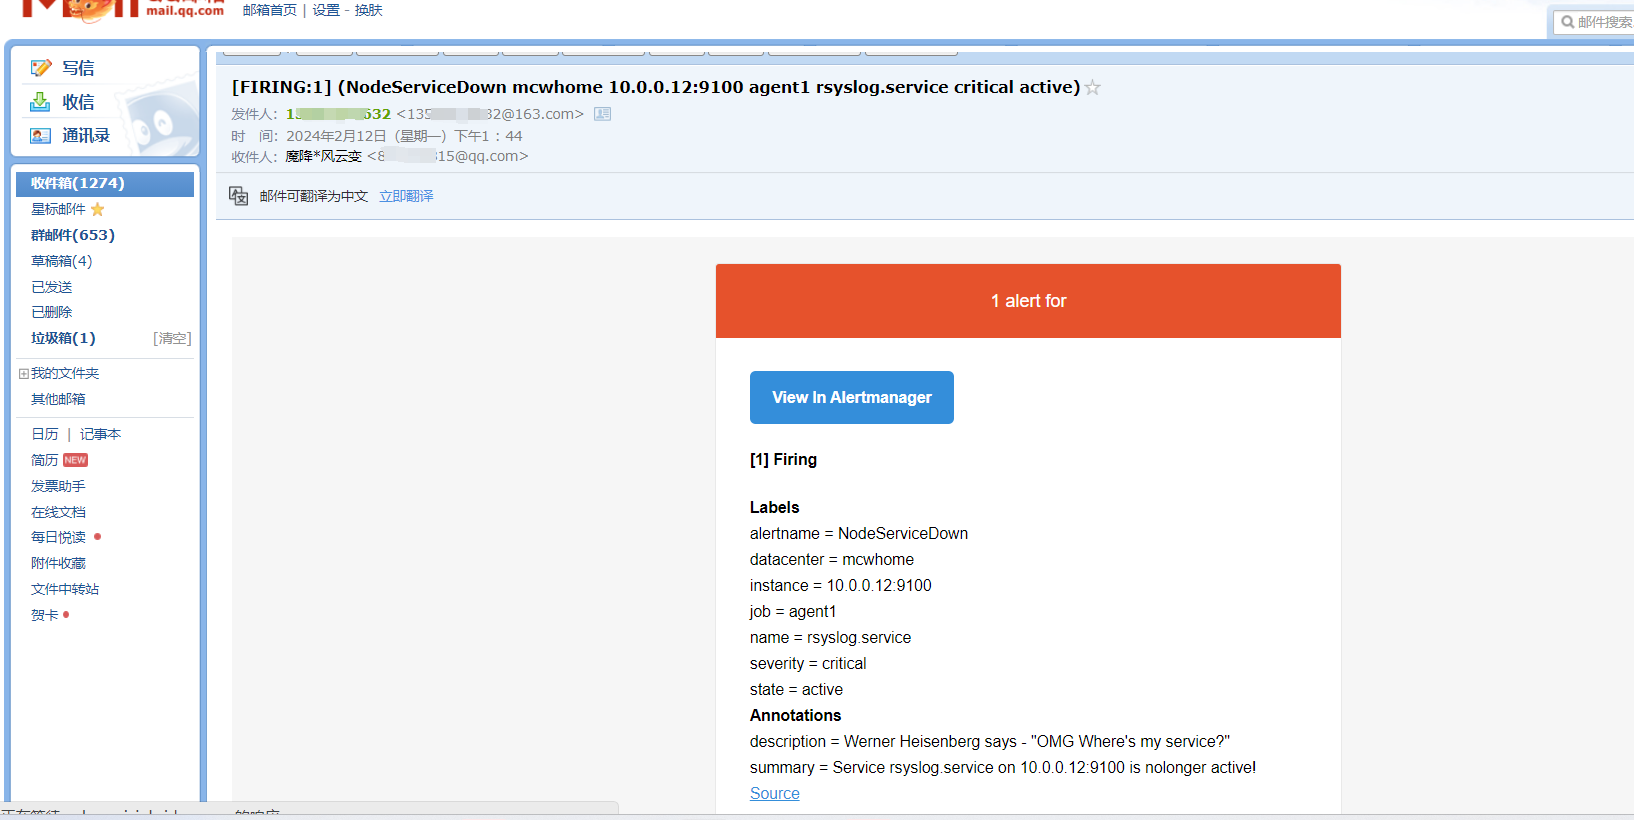
服务重新启动,告警告警消失
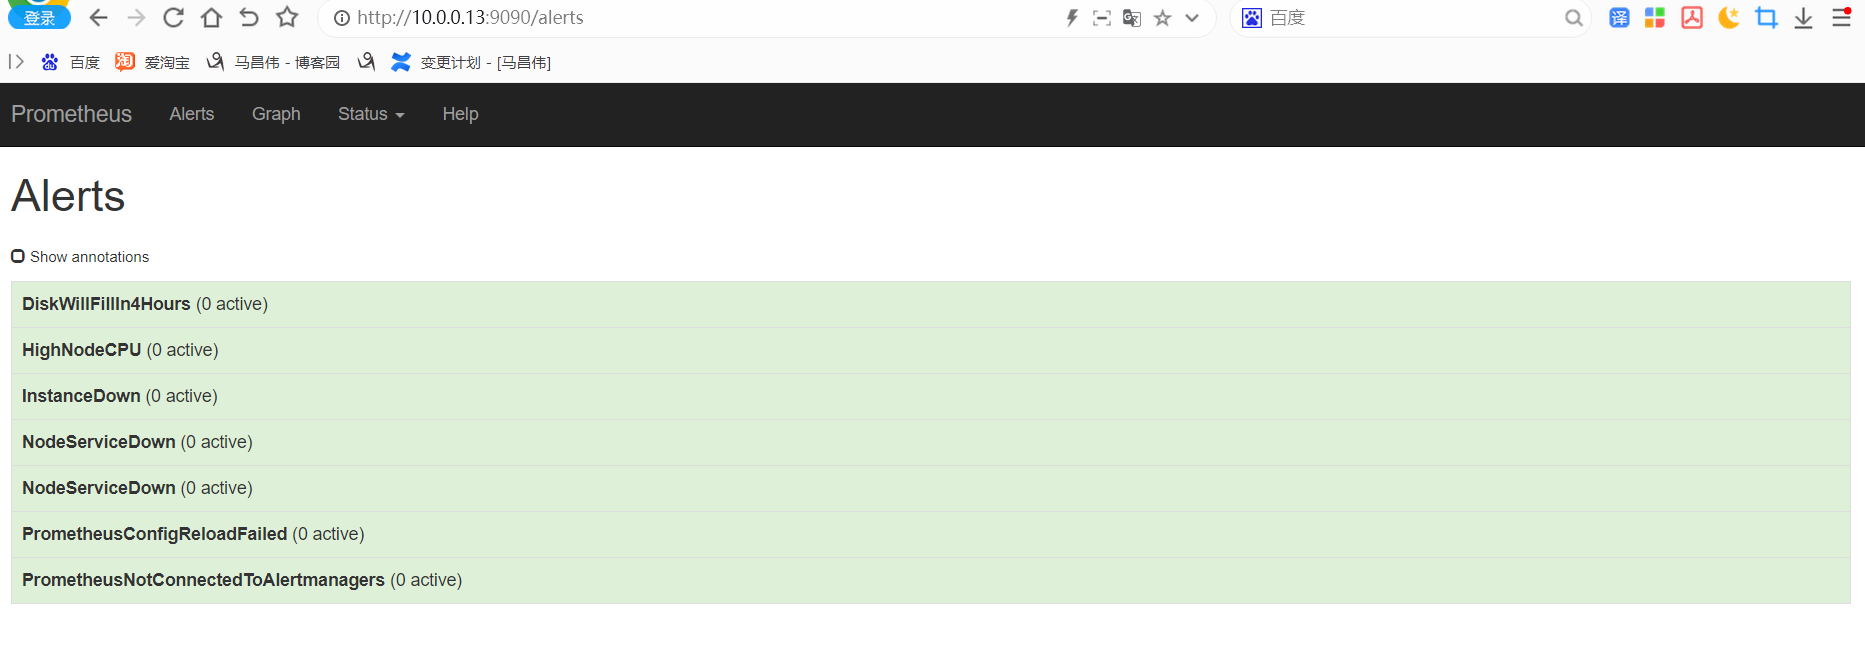
机器可用性
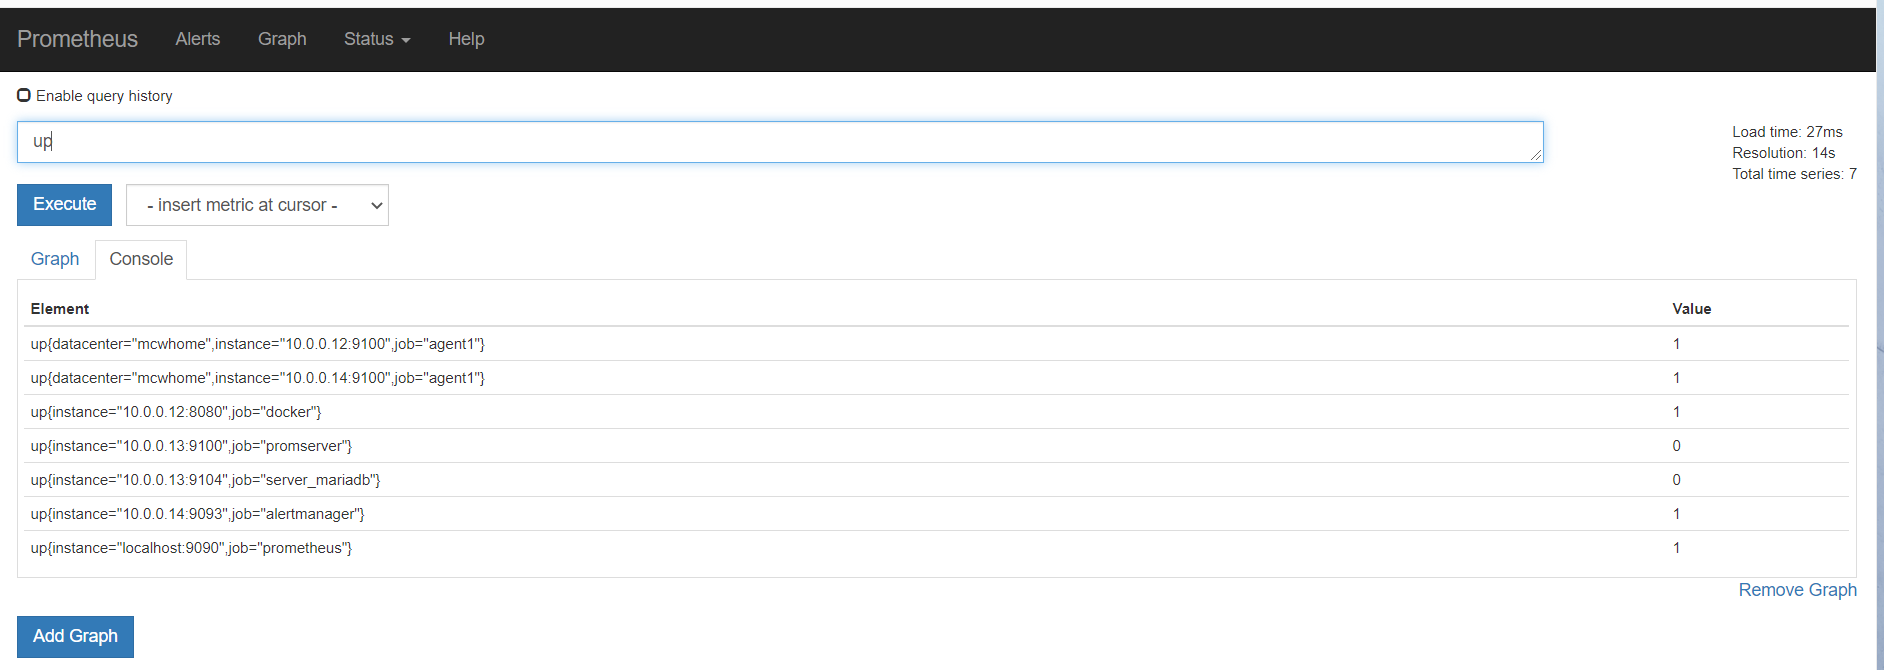
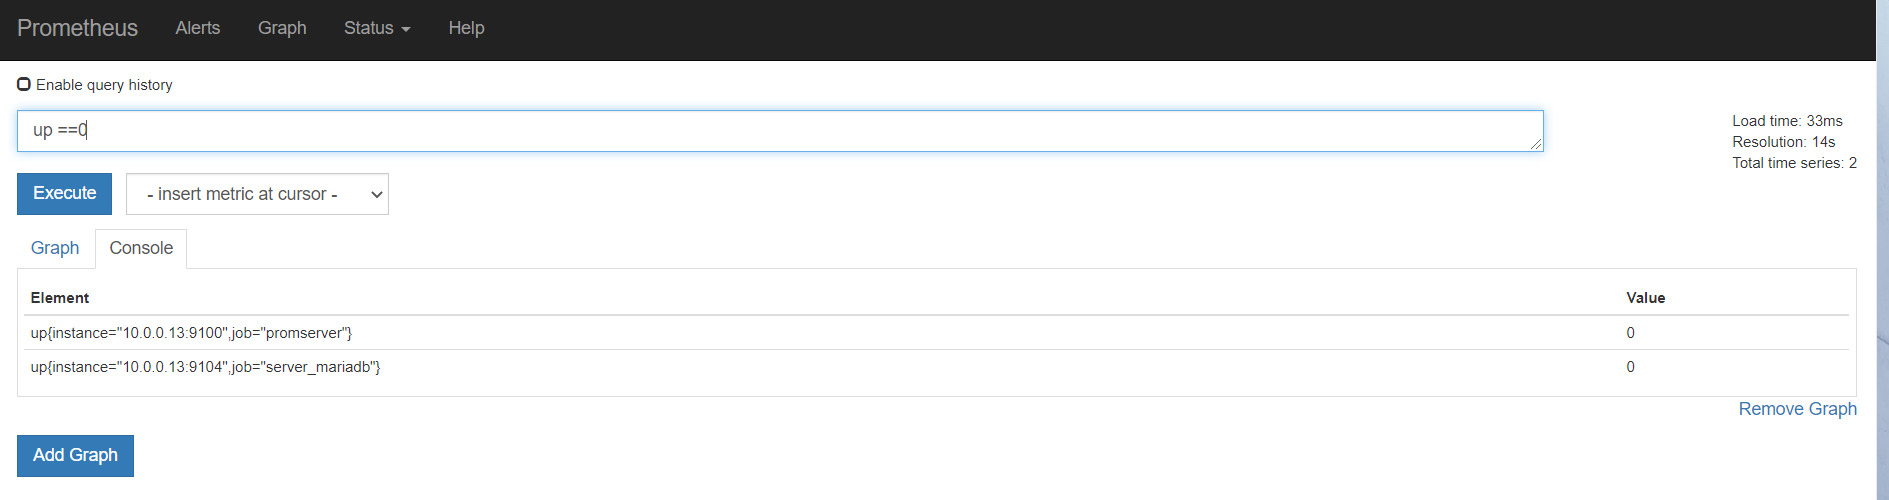
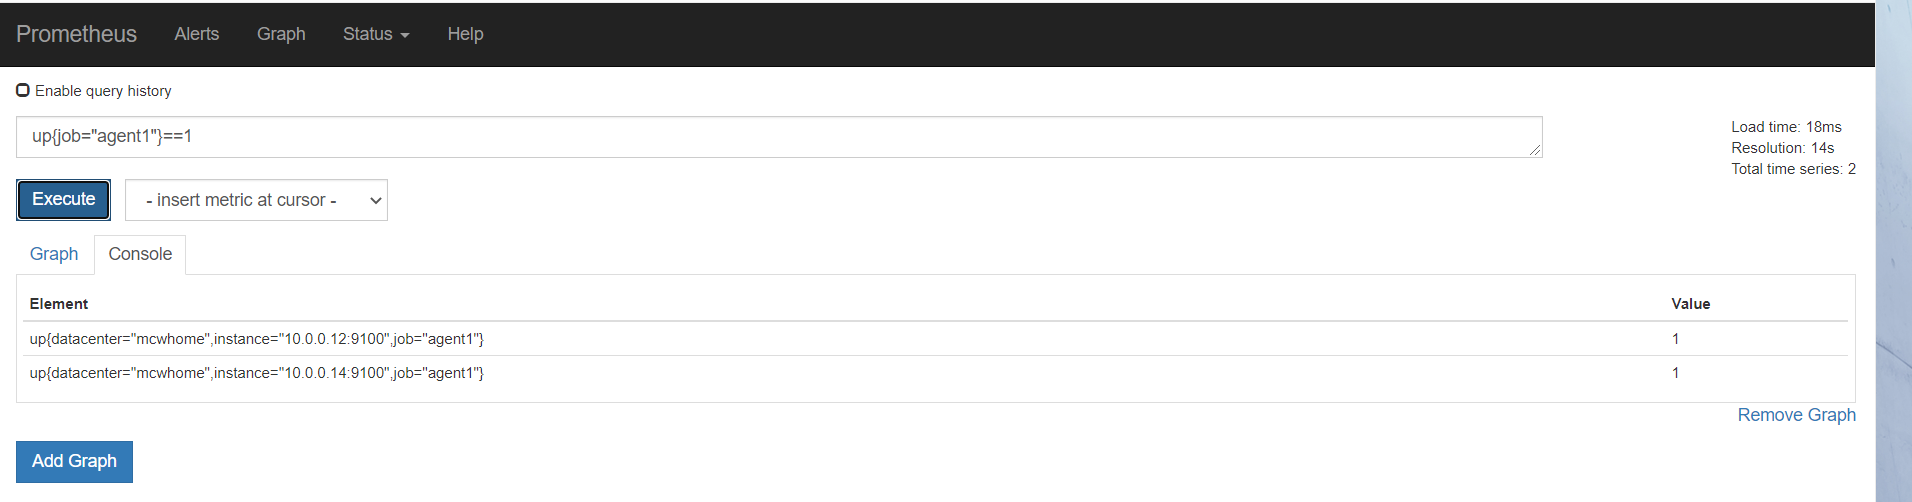
求平均值
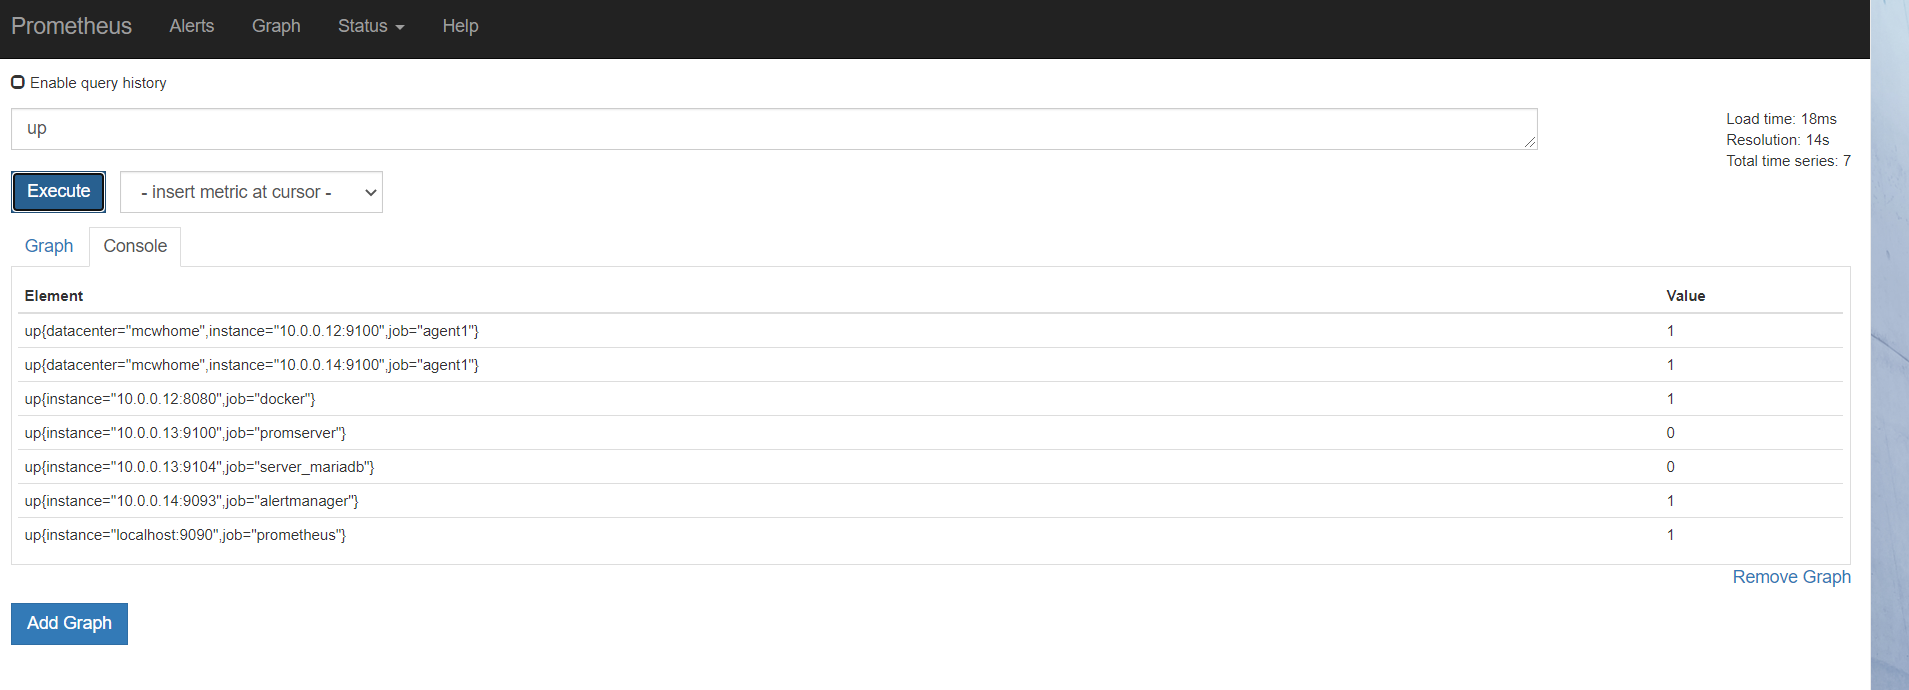
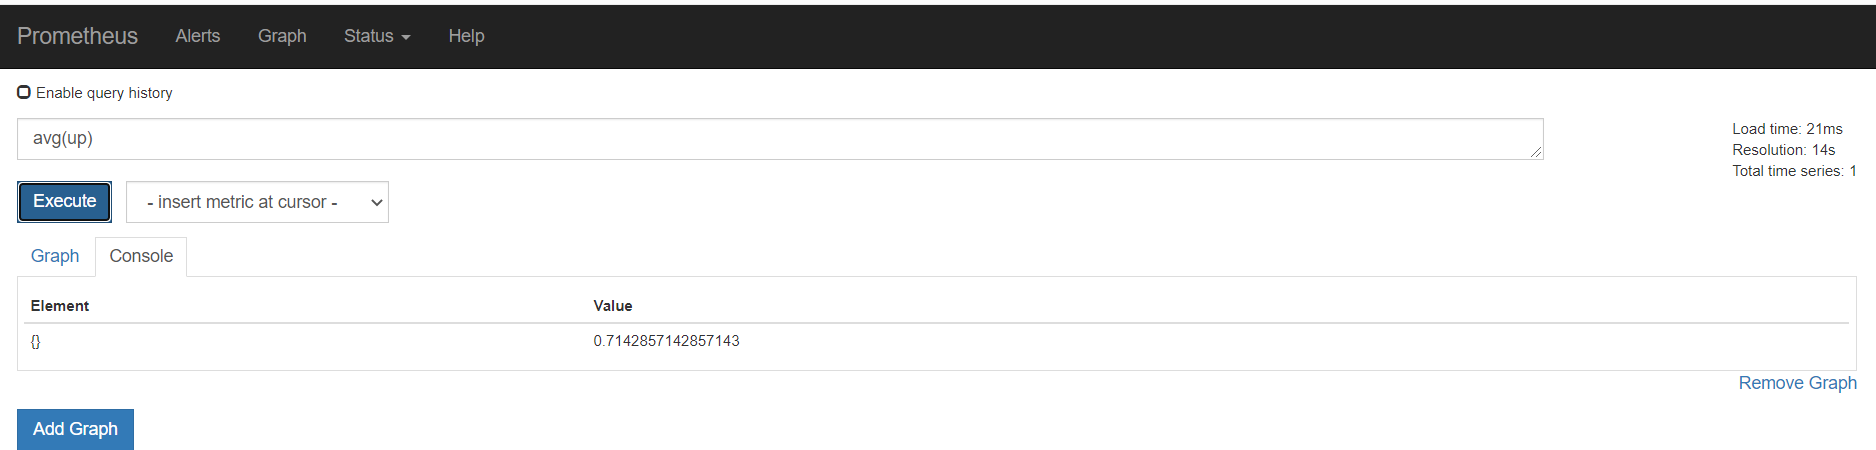
分组聚合,根据作业工作组,求每组的up的均值。
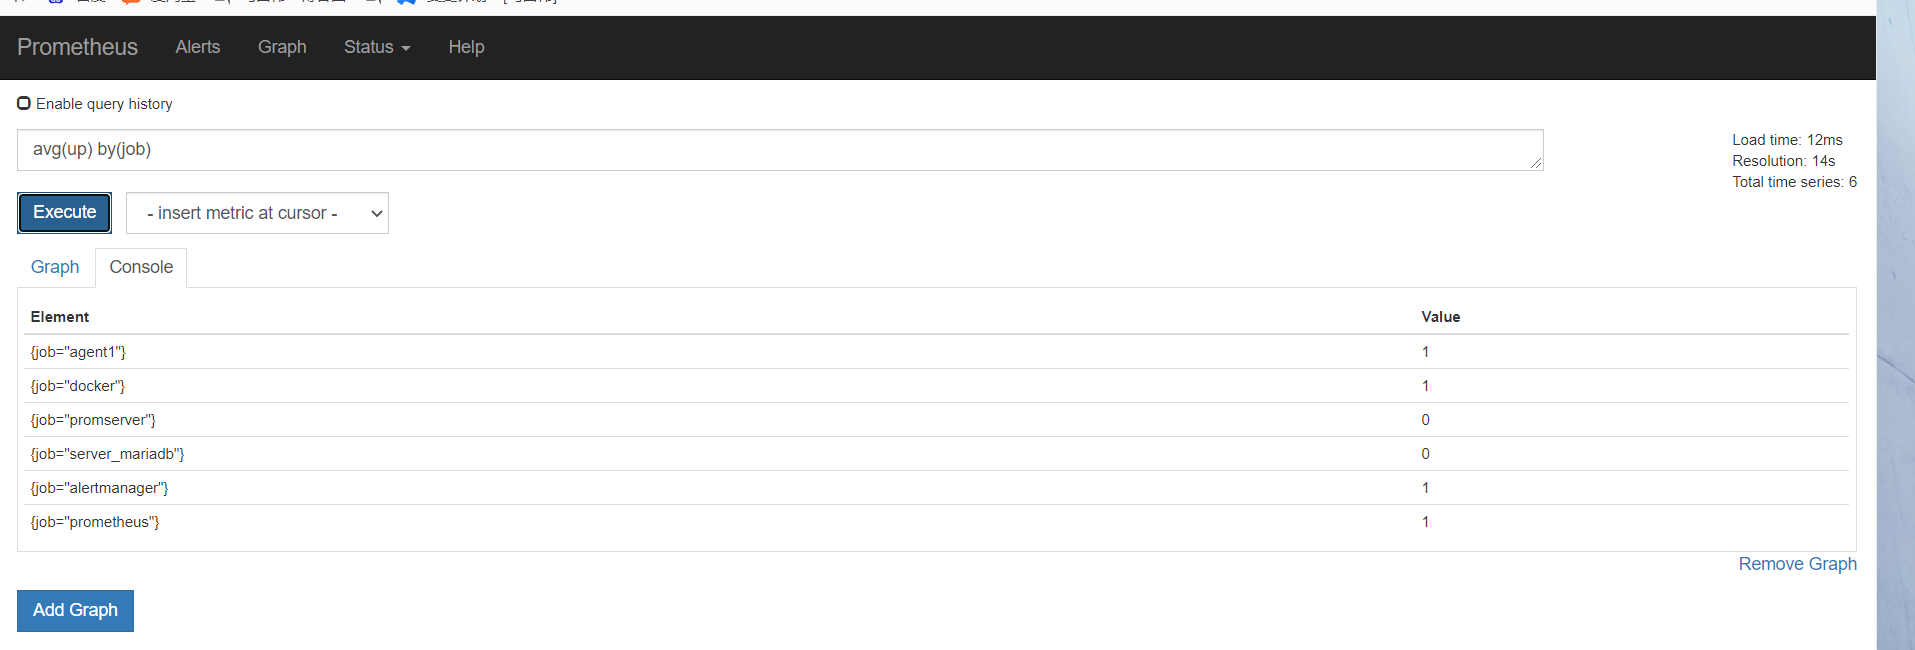
找每个job组,up均值在一半以下,也就是%50的实例无法完成抓取,就可以用来触发告警
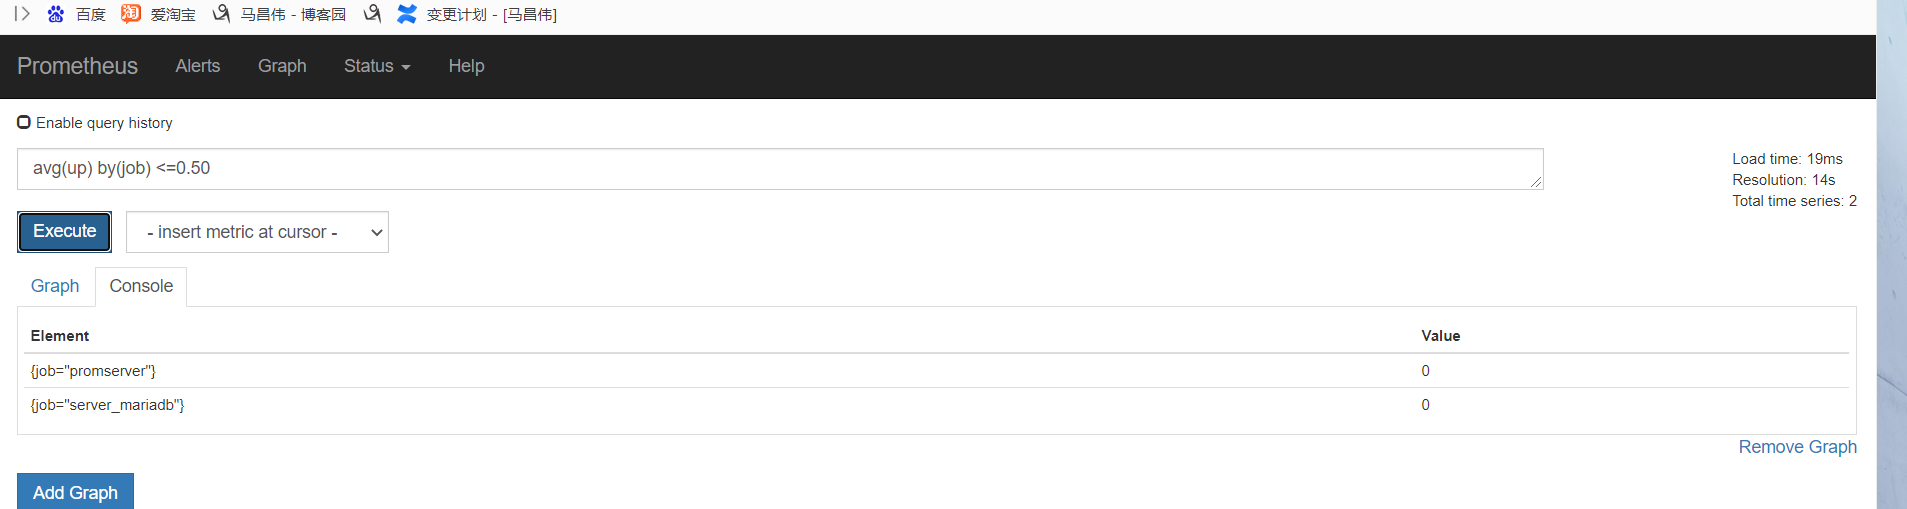
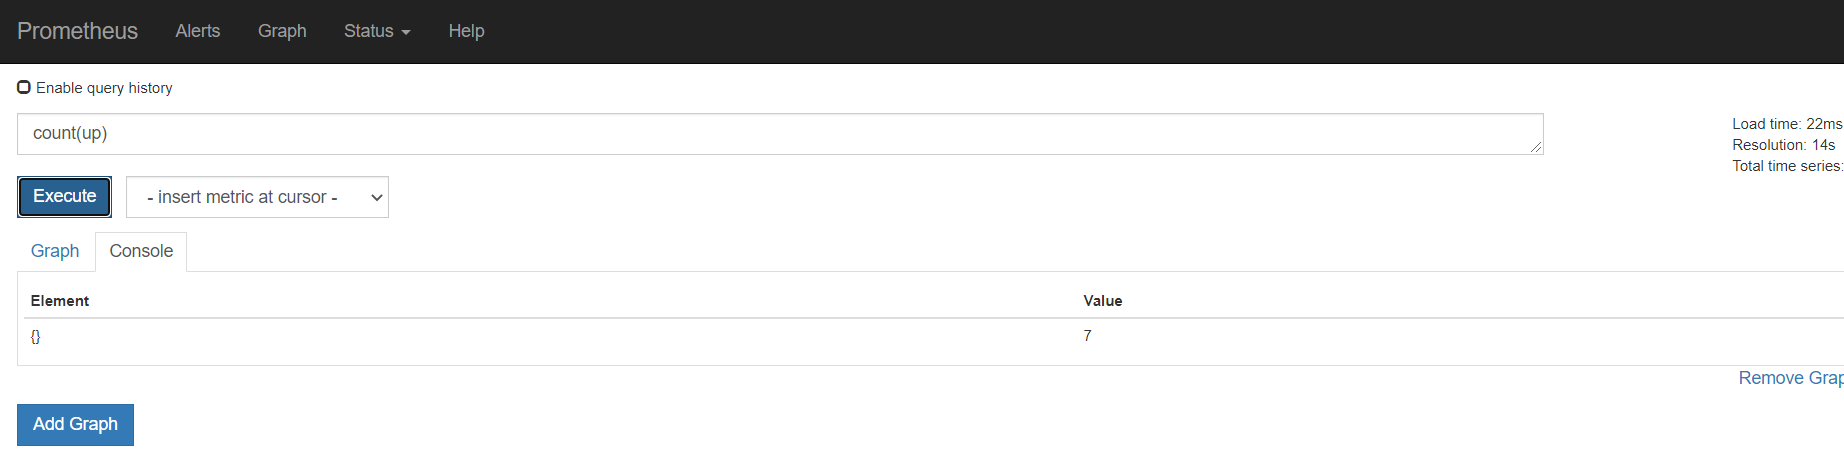
根据job分组求和,up的个数
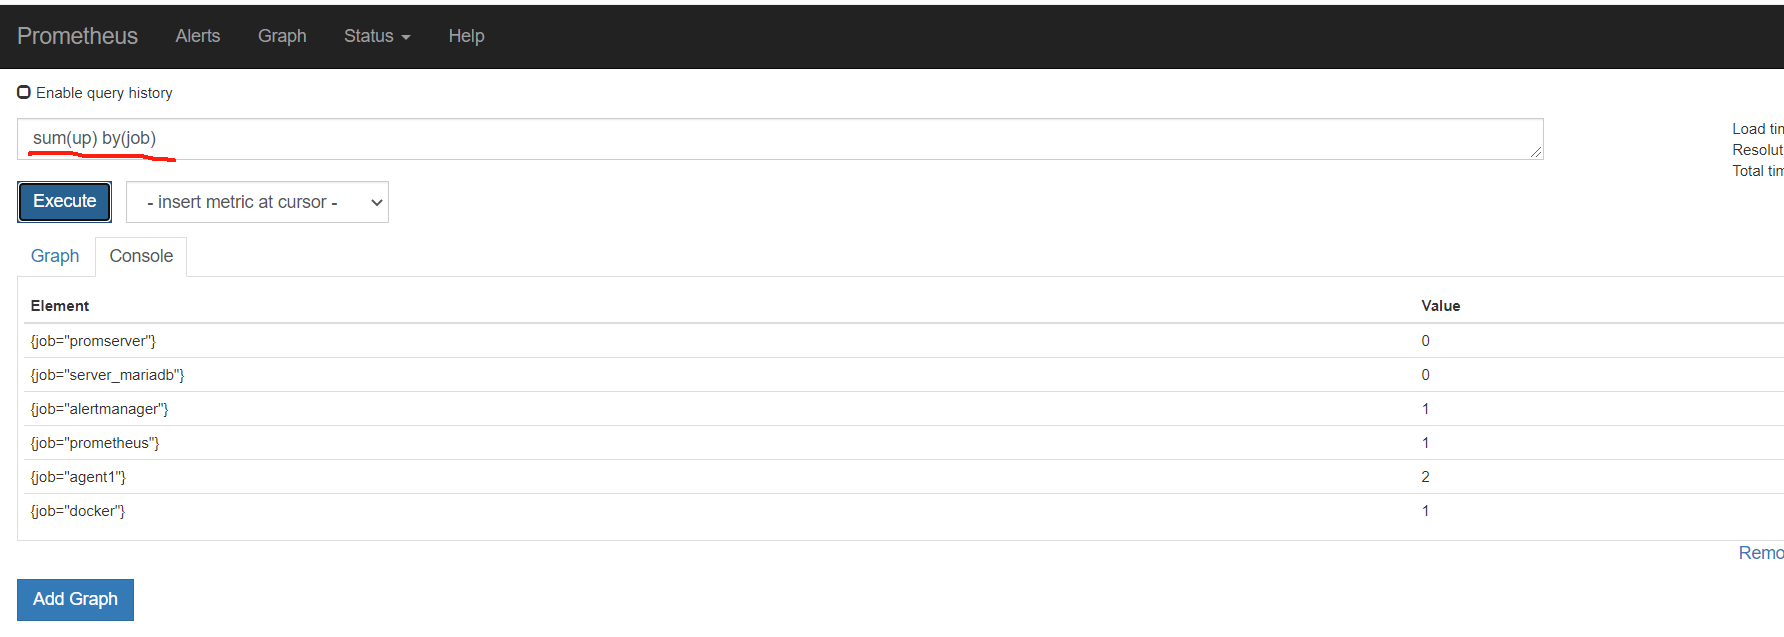
分组统计up个数
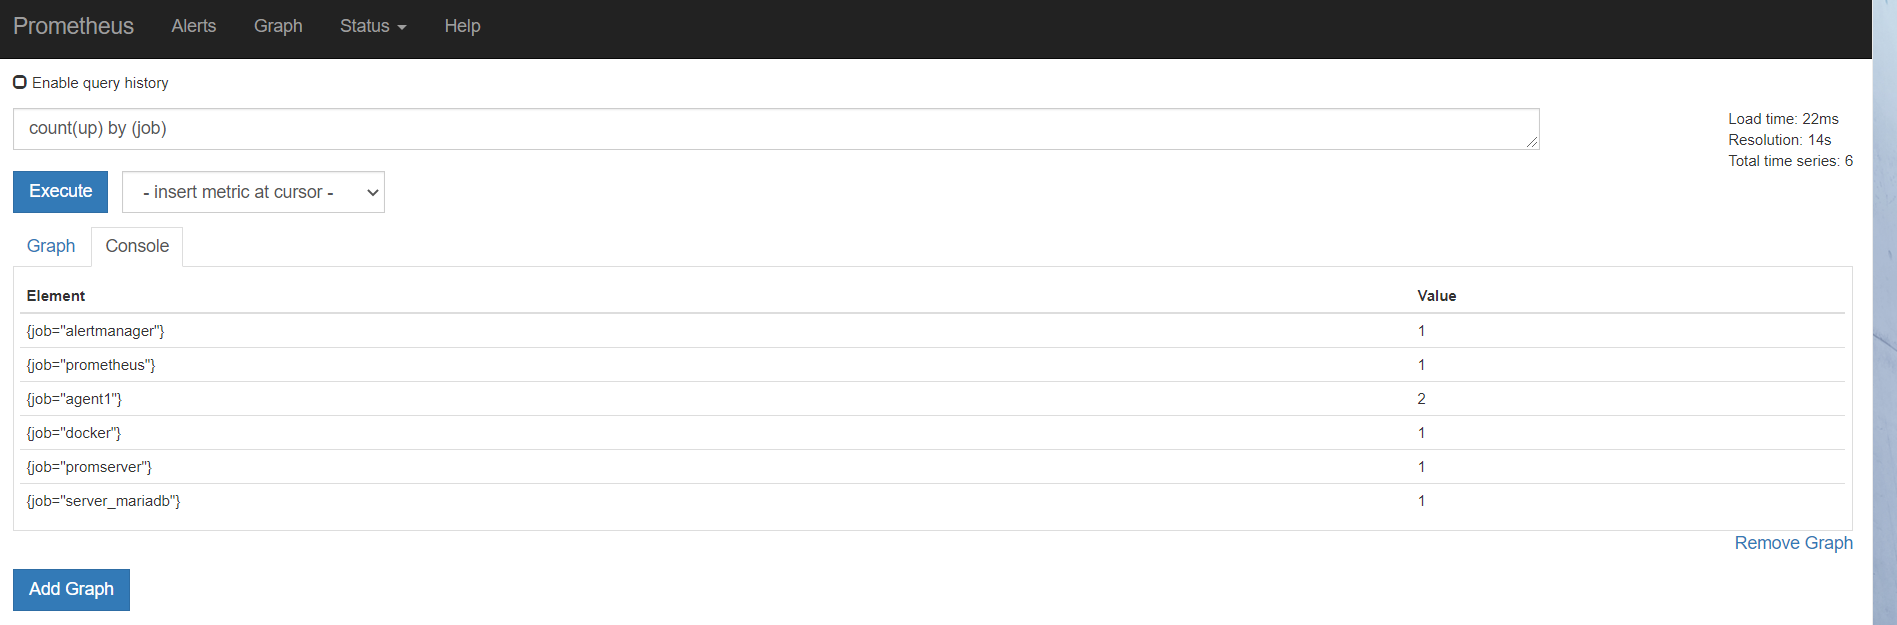
=---------
缺失指标告警
情况如下,用absent,如果有这个指标,就不会返回数据。如果没有这个指标,就返回值为1.这里用于判断这个指标是否存在,表达式是否可以。检测是否存在缺失的指标
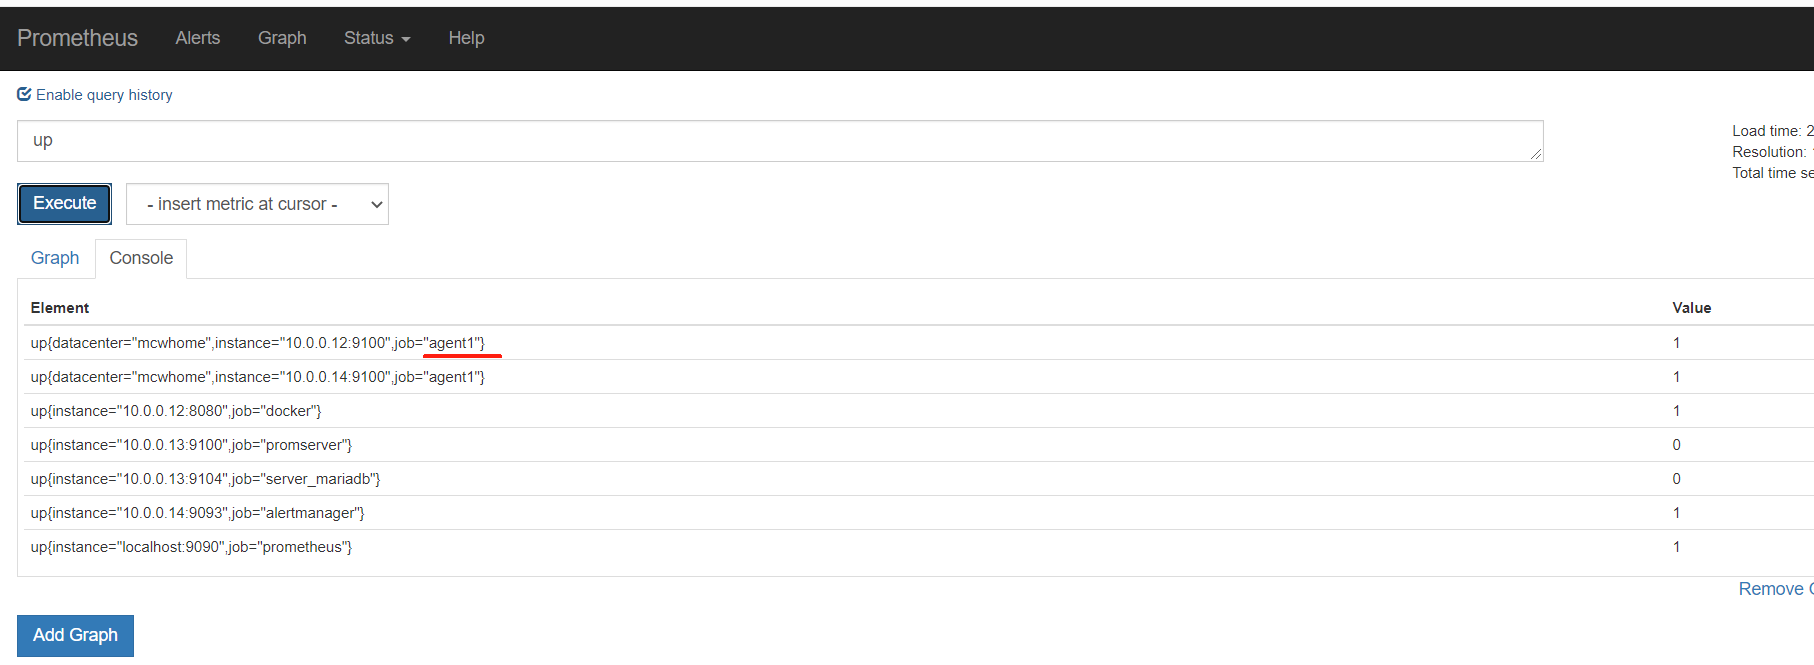
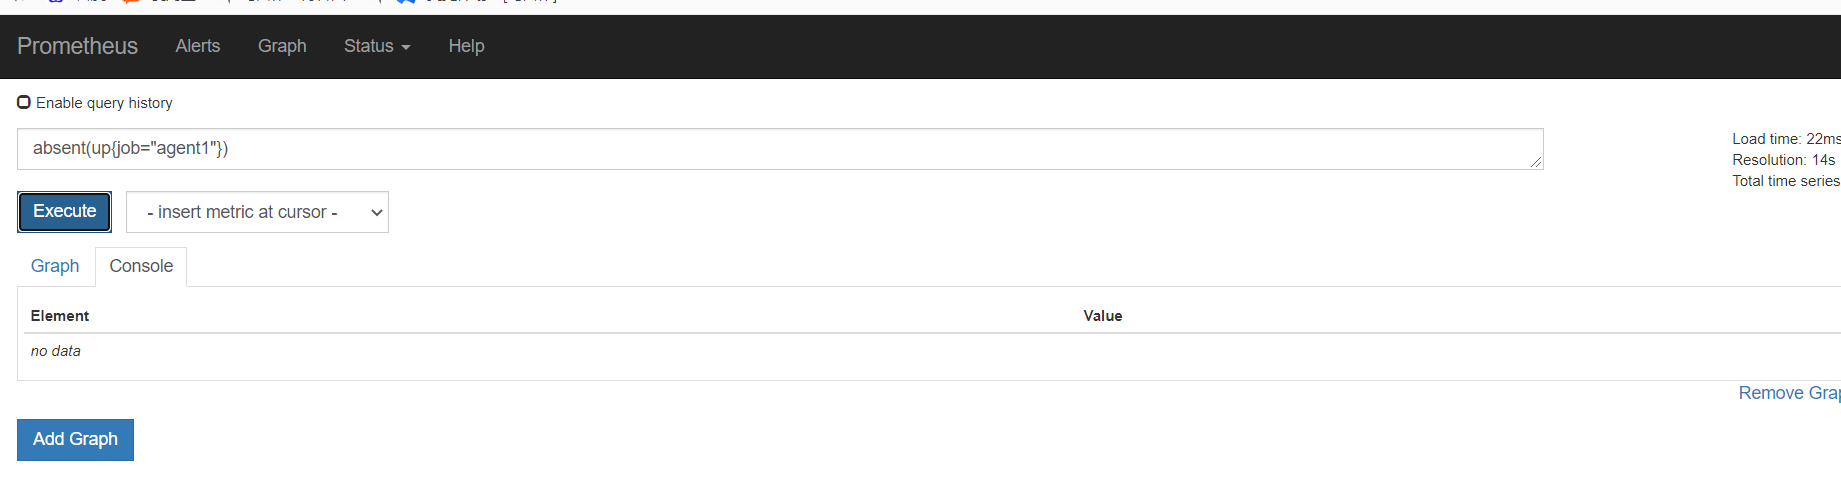
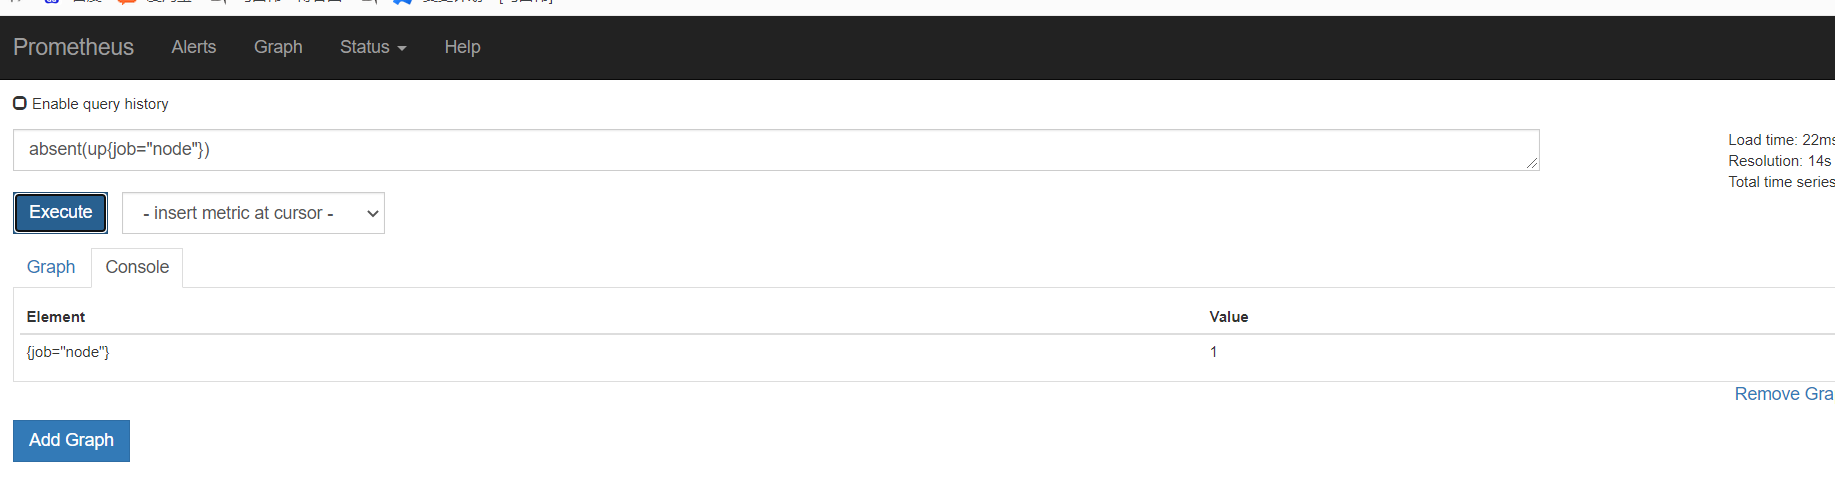
[root@mcw03 ~]# cat /etc/rules/node_rules.yml
groups:
  - name: node_rules
    interval: 10s
    rules:
    - record: instance:node_cpu:avg_rate5m
      expr:  100 - avg(irate(node_cpu_seconds_total{job='agent1',mode='idle'}[5m])) by (instance)*100
    - record: instace:node_memory_usage:percentage
      expr: (node_memory_MemTotal_bytes-(node_memory_MemFree_bytes+node_memory_Buffers_bytes+node_memory_Cached_bytes))/node_memory_MemTotal_bytes*100
      labels:
        metric_type: aggregation
        name: machangwei
  - name: xiaoma_rules
    rules:
    - record: mcw:diskusage
      expr: (node_filesystem_size_bytes{mountpoint="/"}-node_filesystem_free_bytes{mountpoint="/"})/node_filesystem_size_bytes{mountpoint="/"}*100
    - alert: InstanceGone
      expr: absent(up{job="agent1"})
      for: 10s
      labels:
        severity: critical
      annotations:
        summary: Host {{ $labels.name }} is nolonger reporting!
        description: ‘Werner Heisenberg says - "OMG Where are my instances?"

[root@mcw03 ~]# curl -X POST http://localhost:9090/-/reload
[root@mcw03 ~]#
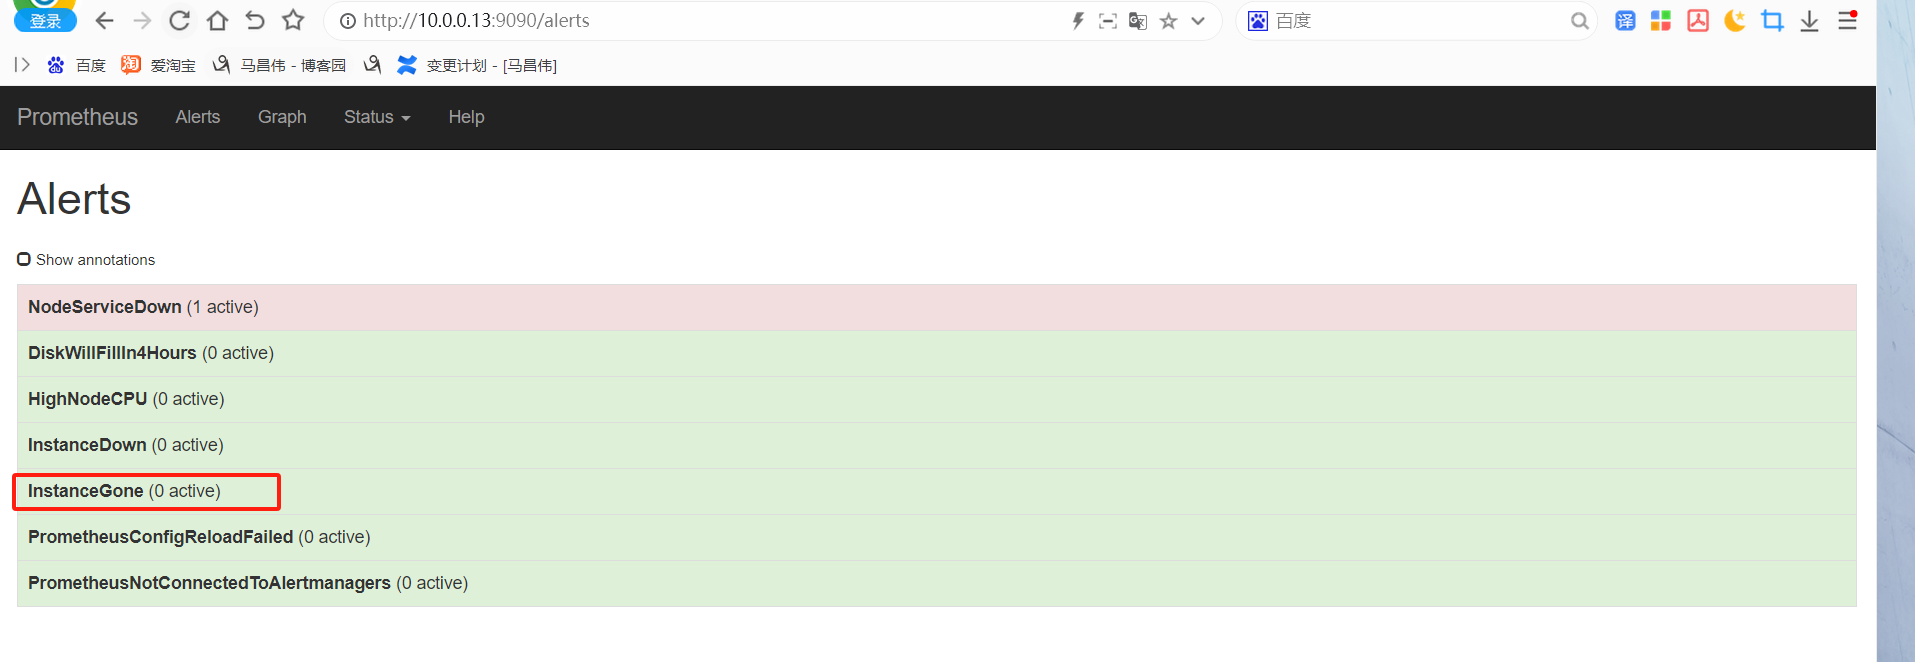
修改为不存在的job,就是缺少值,然后触发了告警
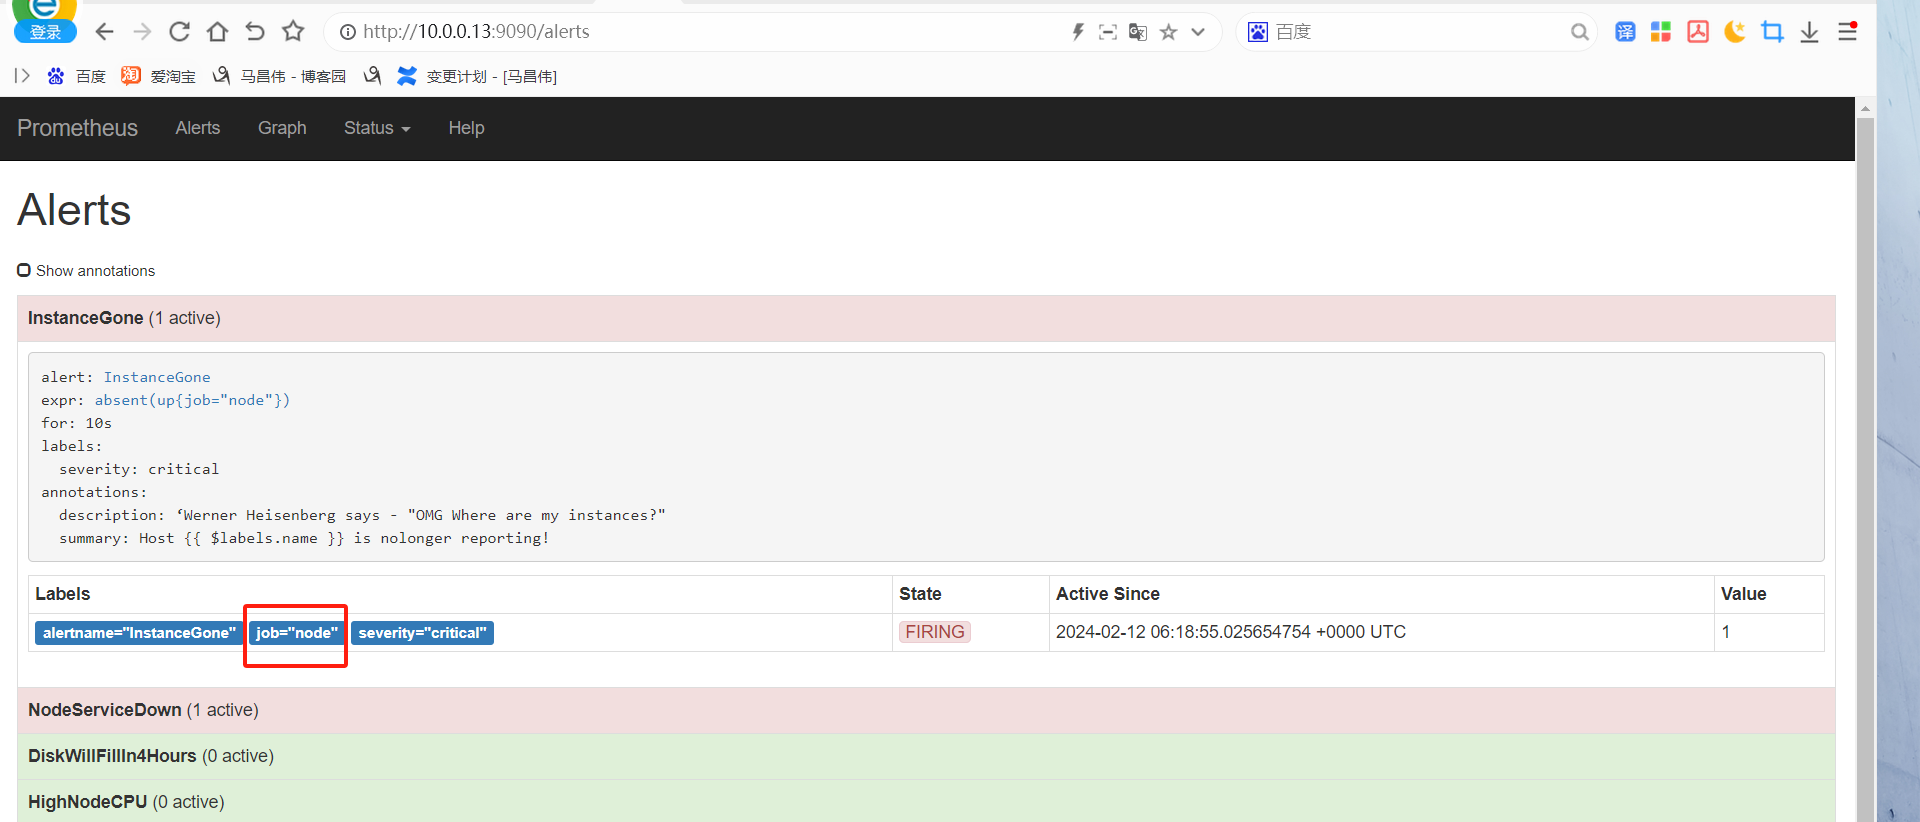
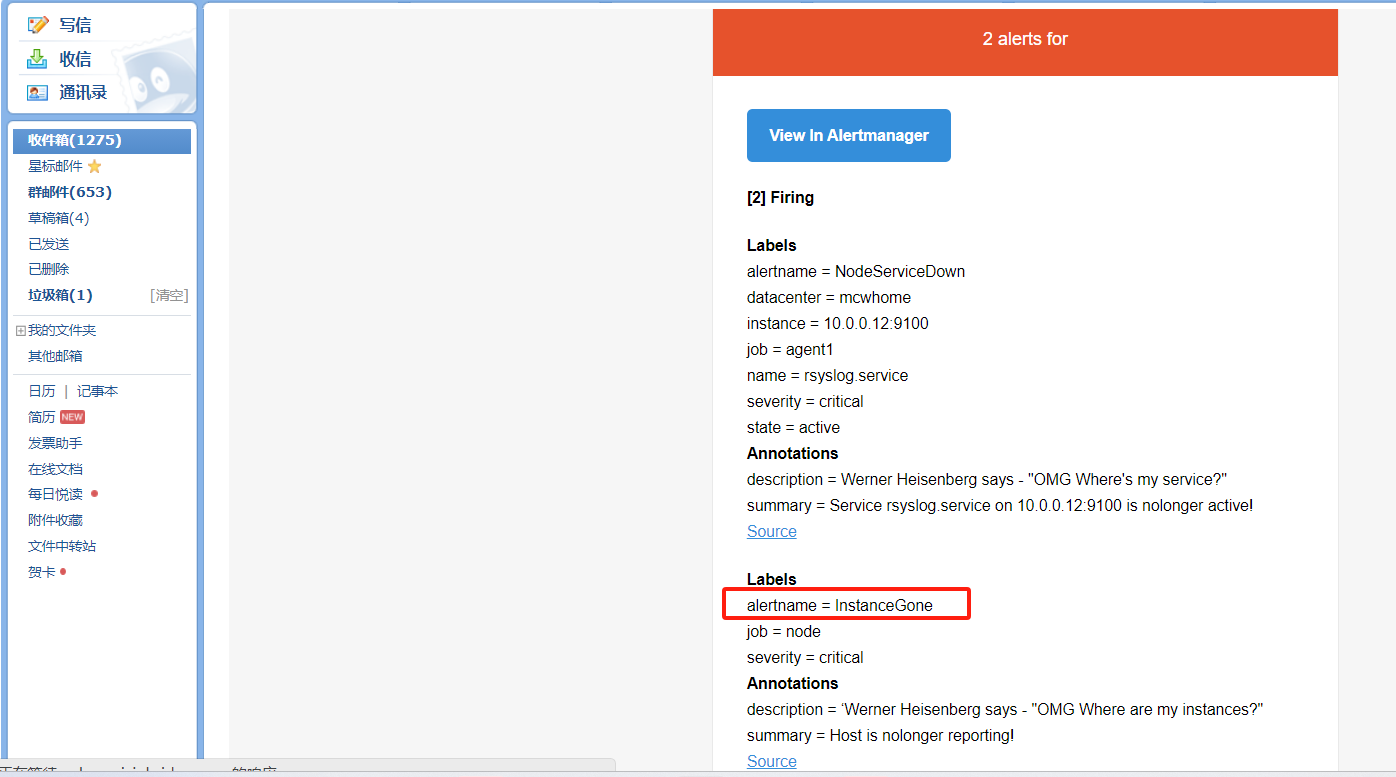
路由
路由配置
[root@mcw04 ~]# cat /etc/alertmanager/alertmanager.yml
global:
  smtp_smarthost: 'smtp.163.com:465'
  smtp_from: '13xx2@163.com'
  smtp_auth_username: '13xx2@163.com'
  smtp_auth_password: 'ExxxxNW'
  smtp_require_tls: false

templates:
  - '/etc/alertmanager/template/*.tmpl'

route:
  receiver: email
receivers:
  - name: 'email'
    email_configs:
      - to: '8xx5@qq.com'
[root@mcw04 ~]#
修改之后。路由下面有分支路由,可以使用标签匹配和正则表达式匹配接受者,接受者在rceivers里面可以定义多个,路由匹配那里用的是接受者配置下的name名称来找到接收者
[root@mcw04 ~]# cat /etc/alertmanager/alertmanager.yml
global:
  smtp_smarthost: 'smtp.163.com:465'
  smtp_from: '13xx32@163.com'
  smtp_auth_username: '13xxx32@163.com'
  smtp_auth_password: 'EHxxNW'
  smtp_require_tls: false

templates:
  - '/etc/alertmanager/template/*.tmpl'

route:
  group_by: ['instance','cluster']
  group_wait: 30s
  group_interval: 5m
  repeat_interval: 3h
  receiver: email
  routes:
  - match:
      severity: critical
    receiver: pager
  - match_re:
      serverity: ^(warning|critical)$
    receiver: support_team

receivers:
  - name: 'email'
    email_configs:
      - to: '8xx15@qq.com'
  - name: 'support_team'
    email_configs:
      - to: '89xx5@qq.com'
  - name: 'pager'
    email_configs:
      - to: '13xx32@163.com'
[root@mcw04 ~]# systemctl restart alertmanager.service
[root@mcw04 ~]#
先弄的都没有触发告警的
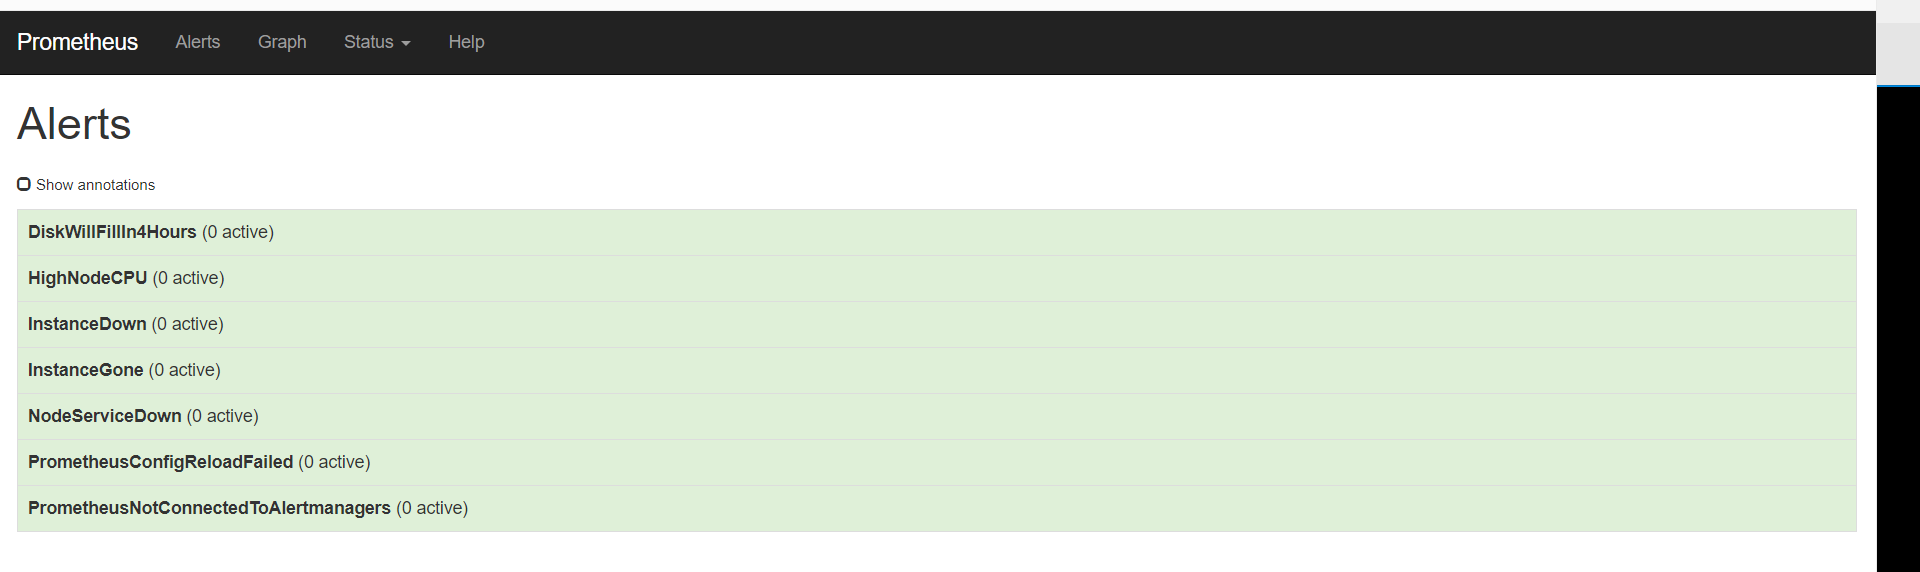
突然发现,我这里把告警规则,写到记录规则下面了。他俩的区别是,一个是record,另外一个是alert,可以混合写在一起,在这里。
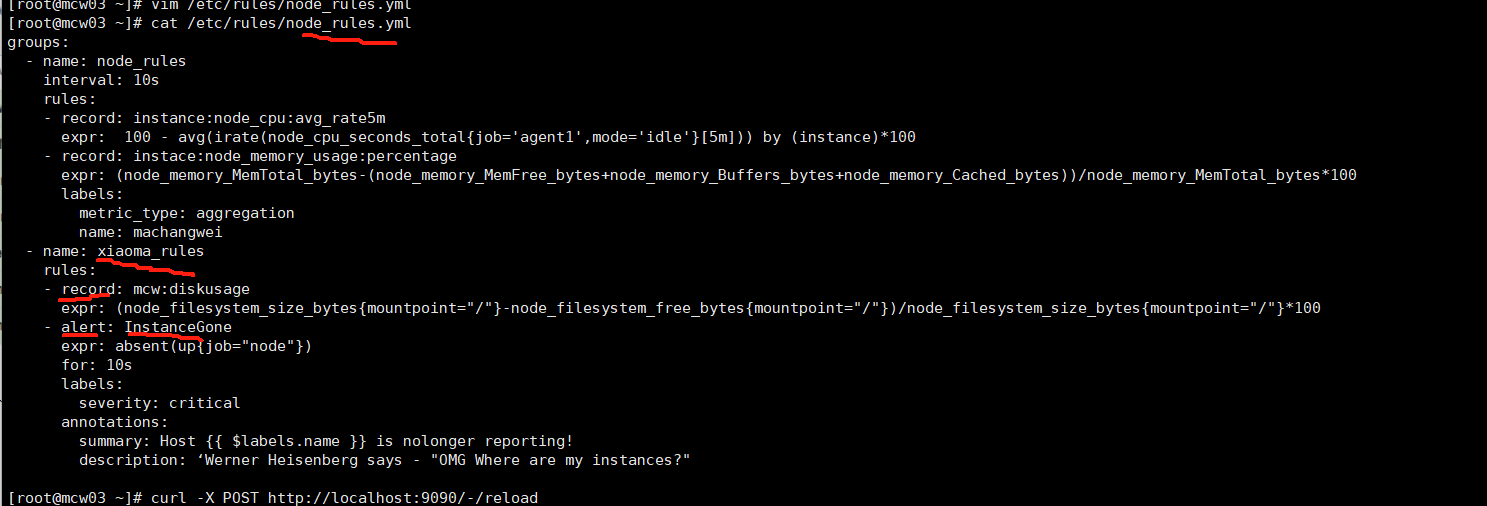
找三个,两个是criticlal的,一个是warning告警的,手动触发一下
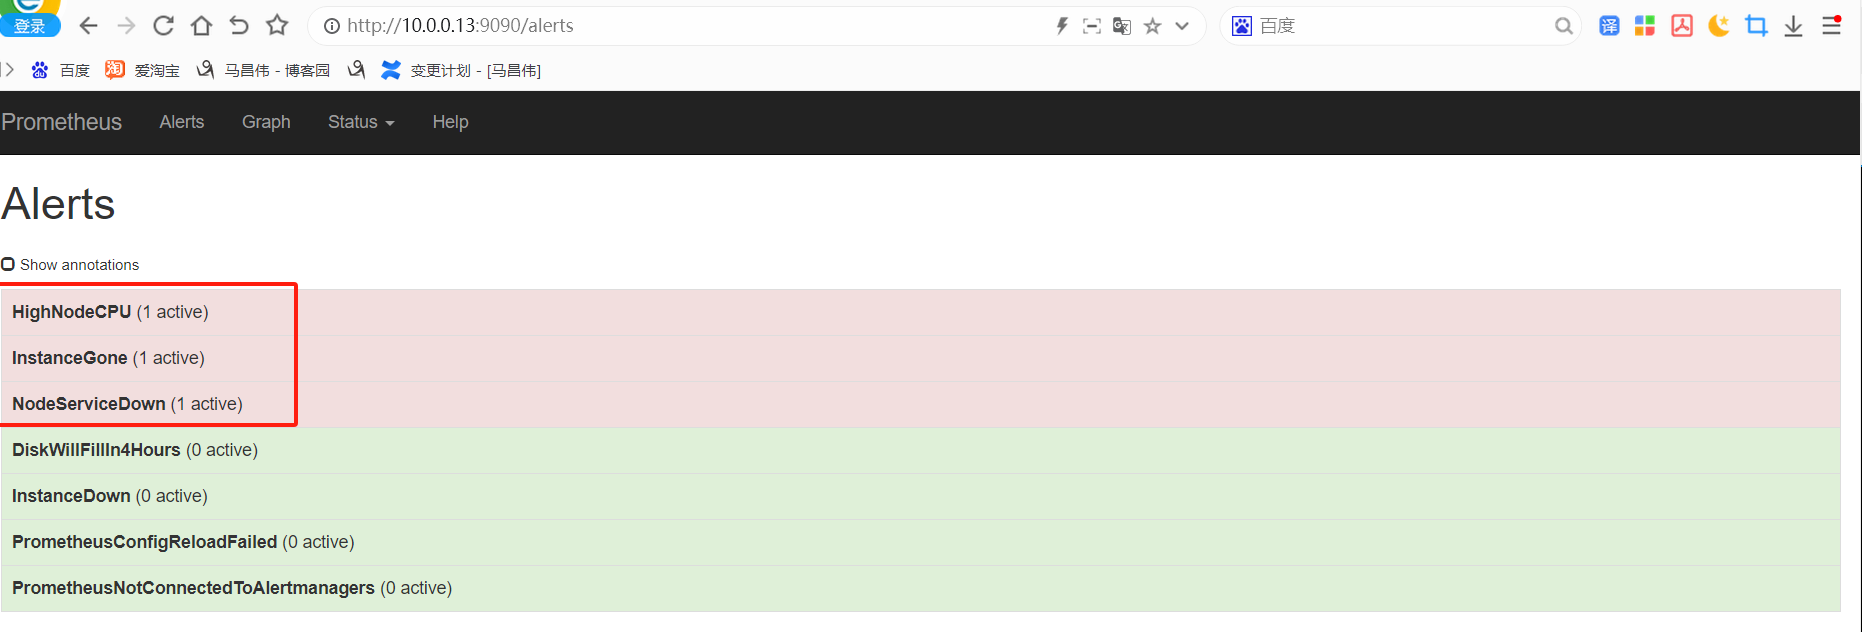
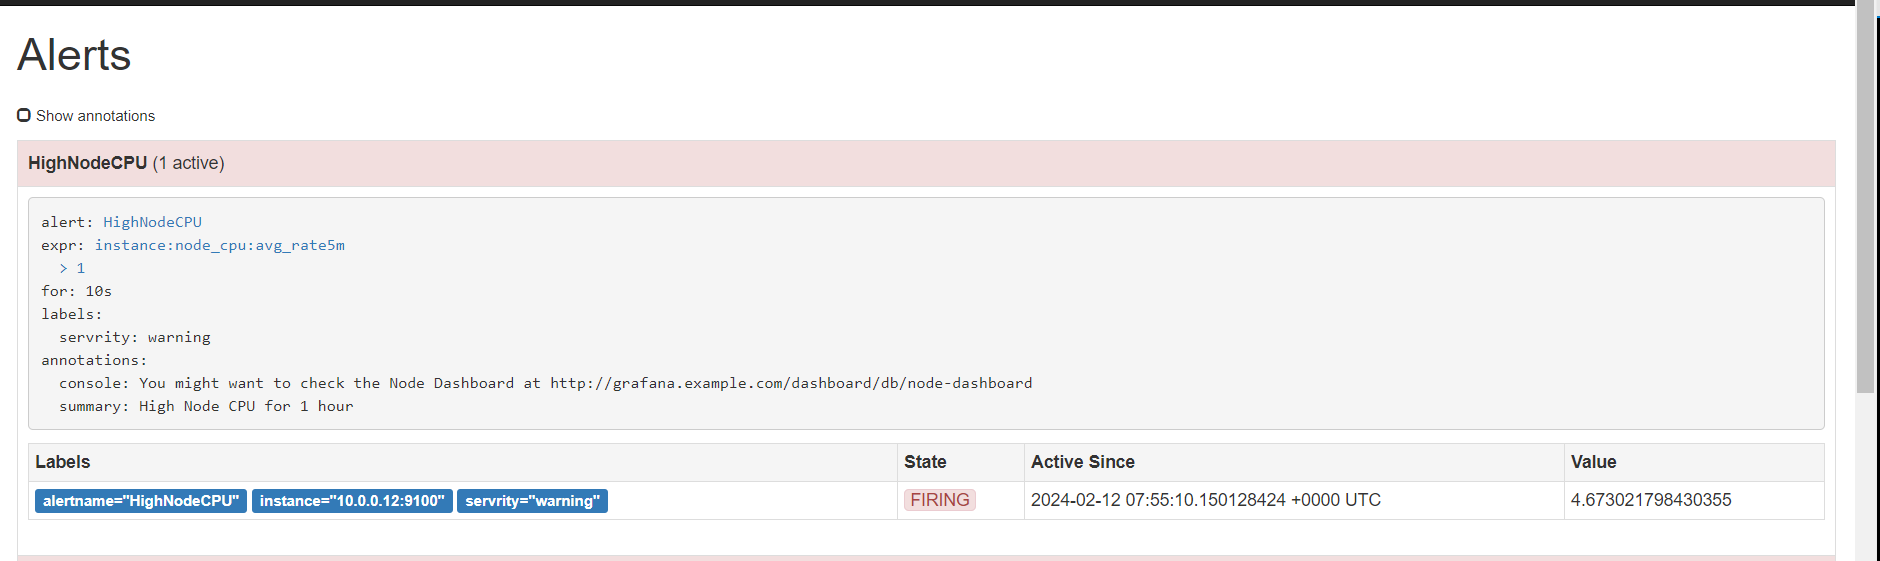
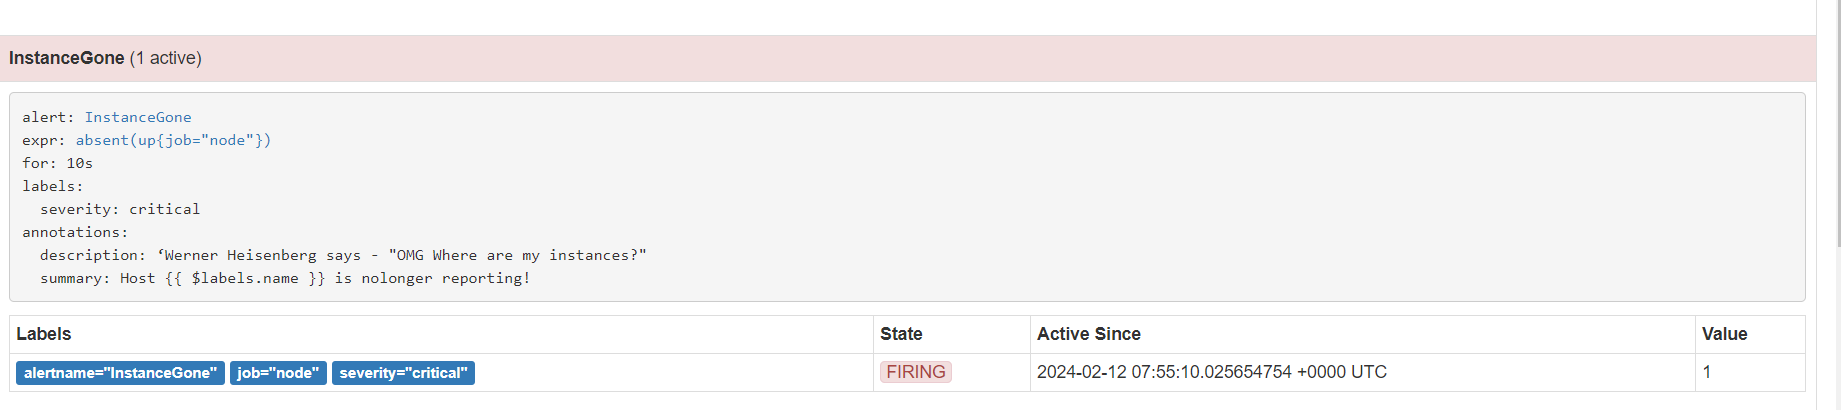
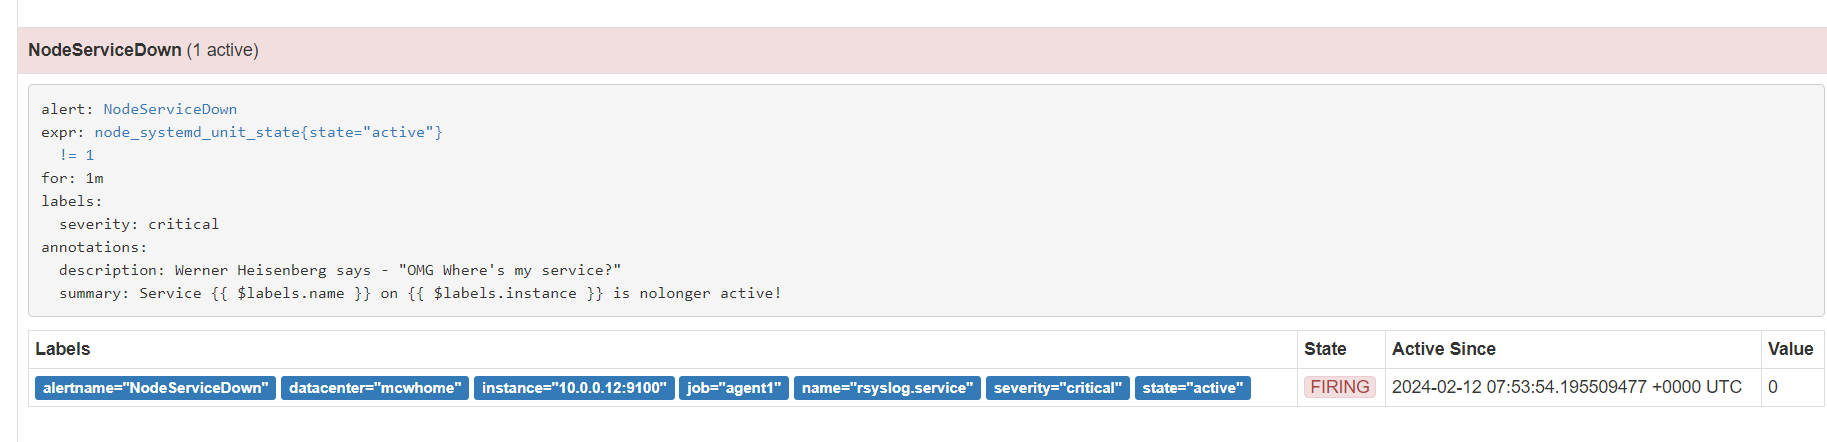
由下可以看到,有critical标签的都发送到163邮箱了。有warning的,是发送到qq邮箱了,告警根据标签或者正则,匹配到了不同的接收者,然后发送到不同的地方了
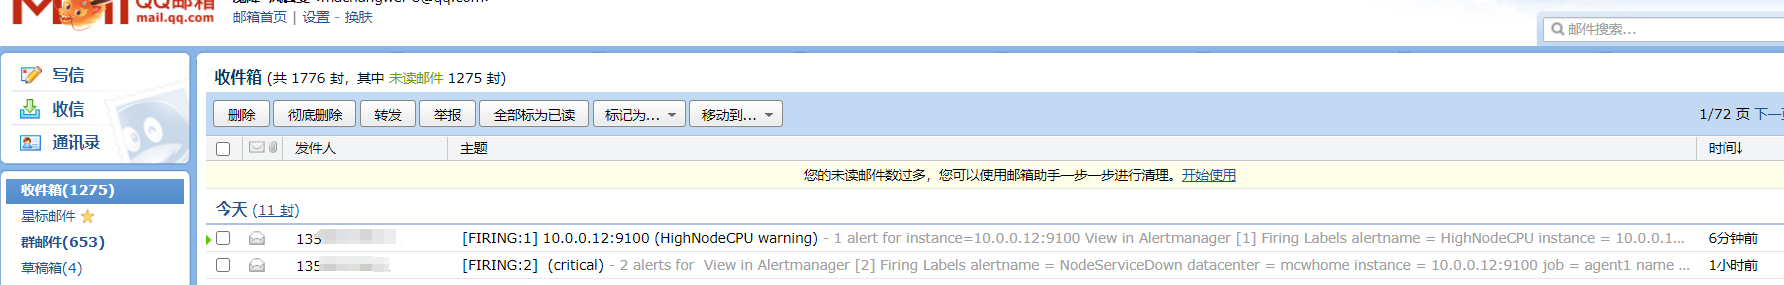
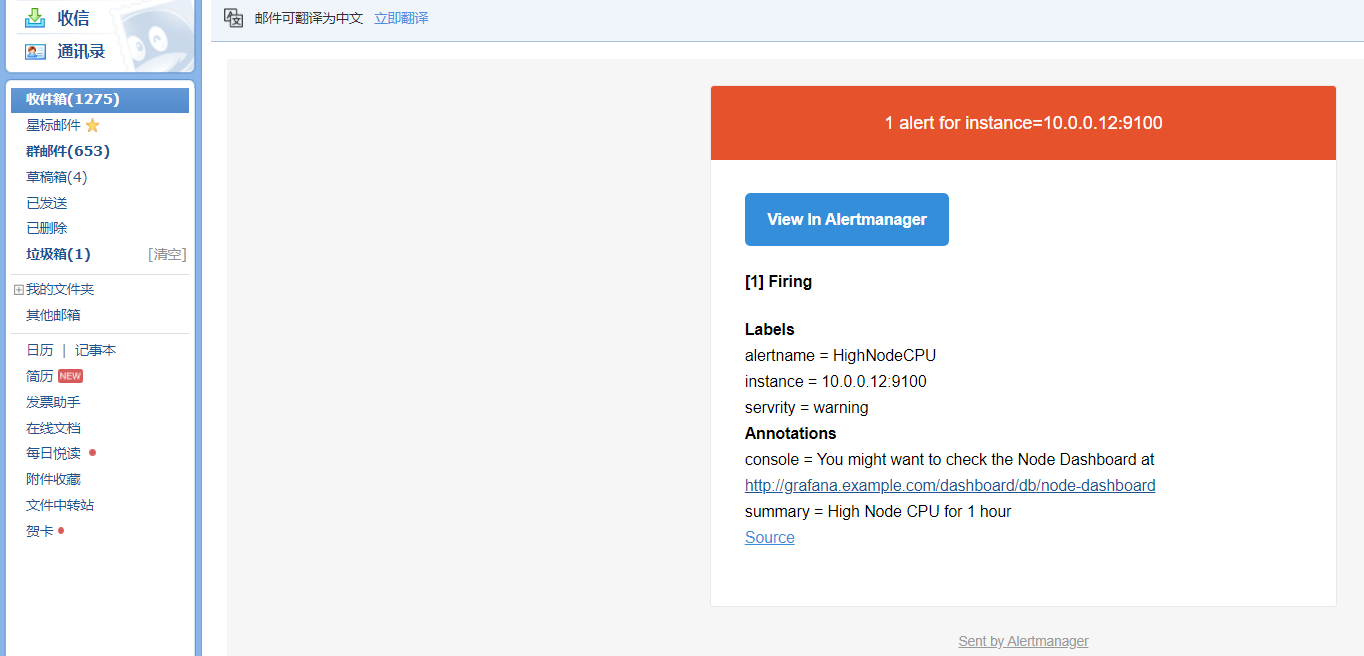
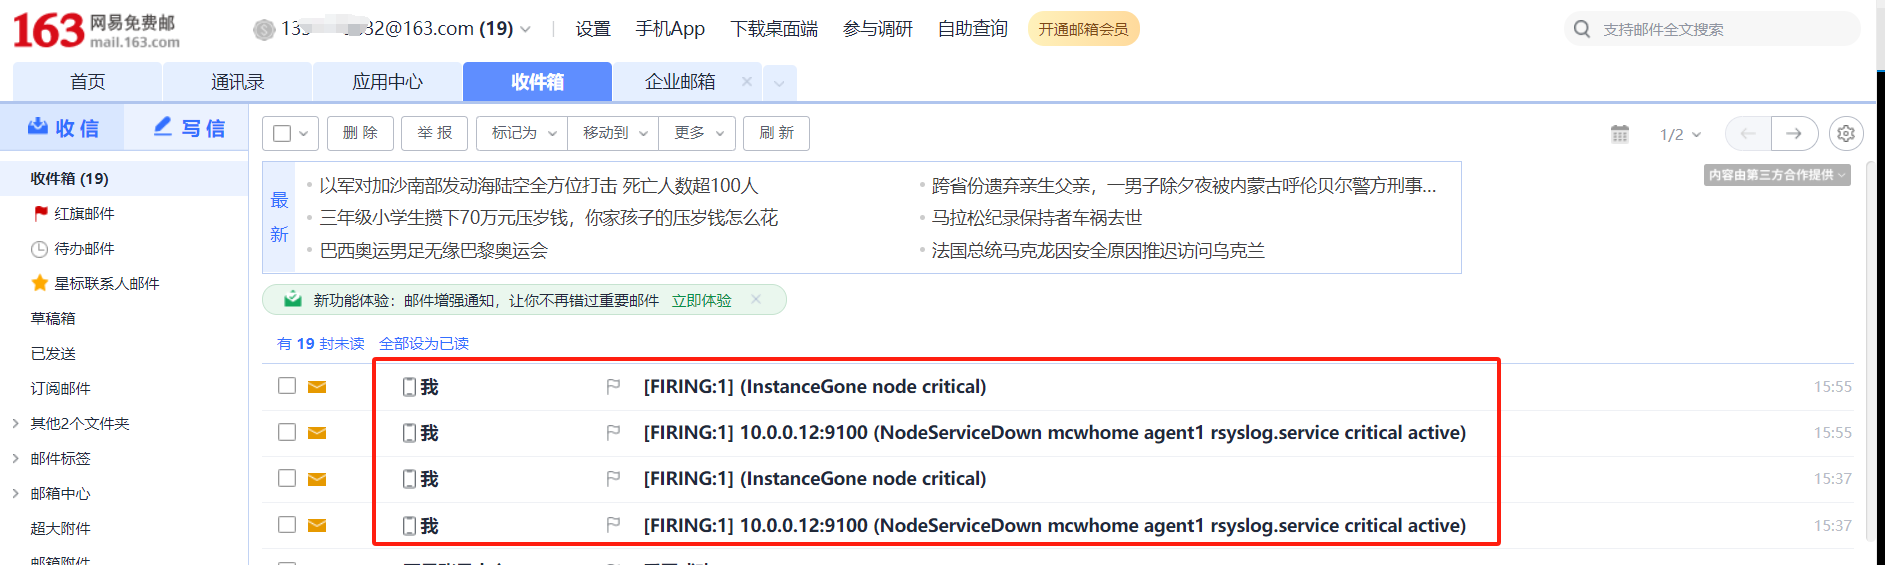
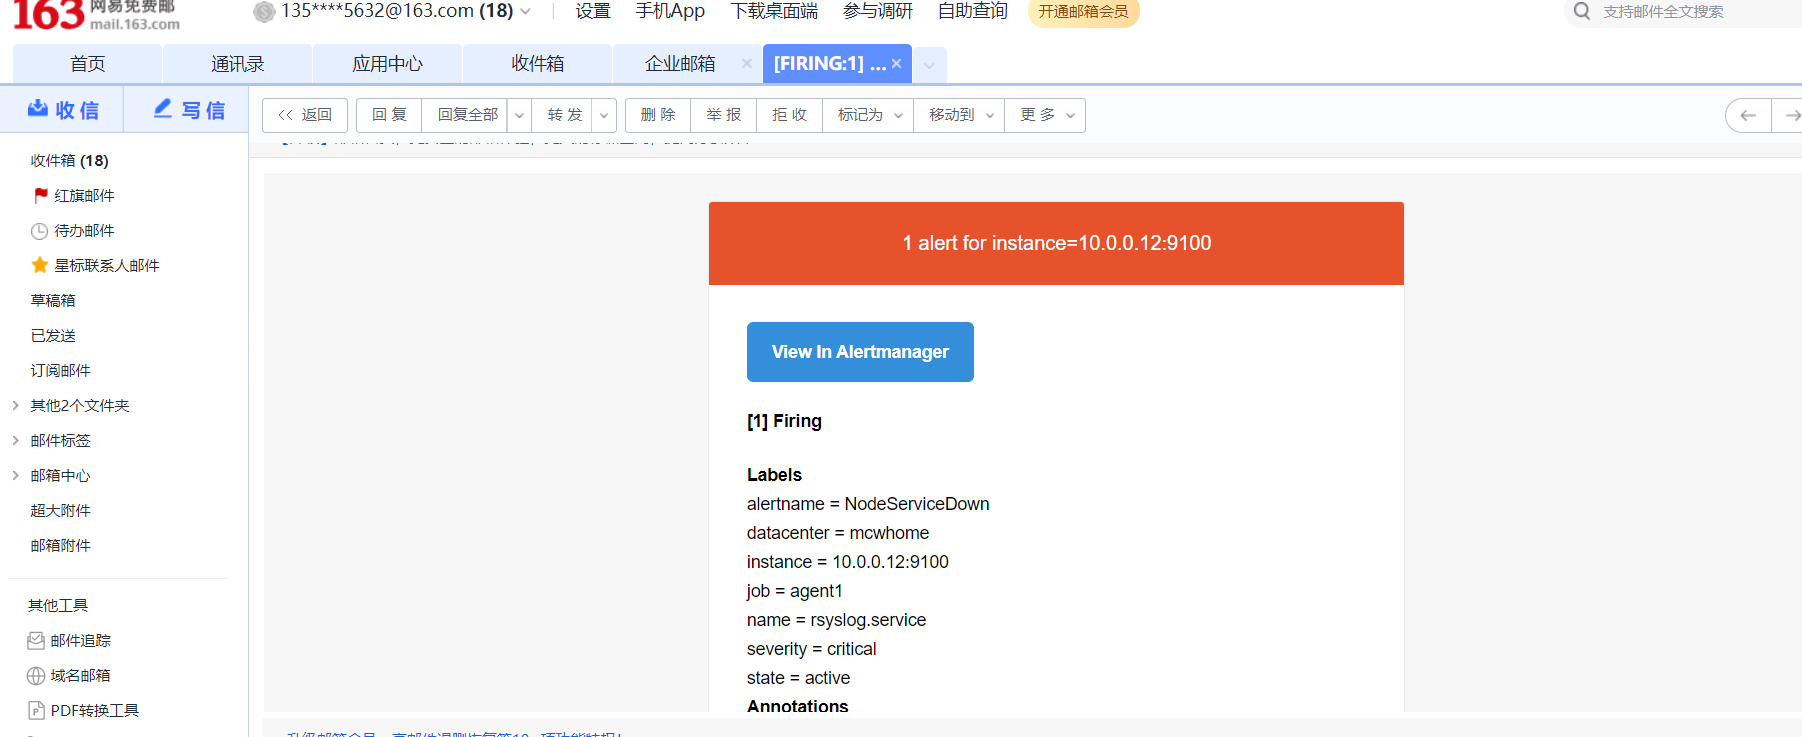
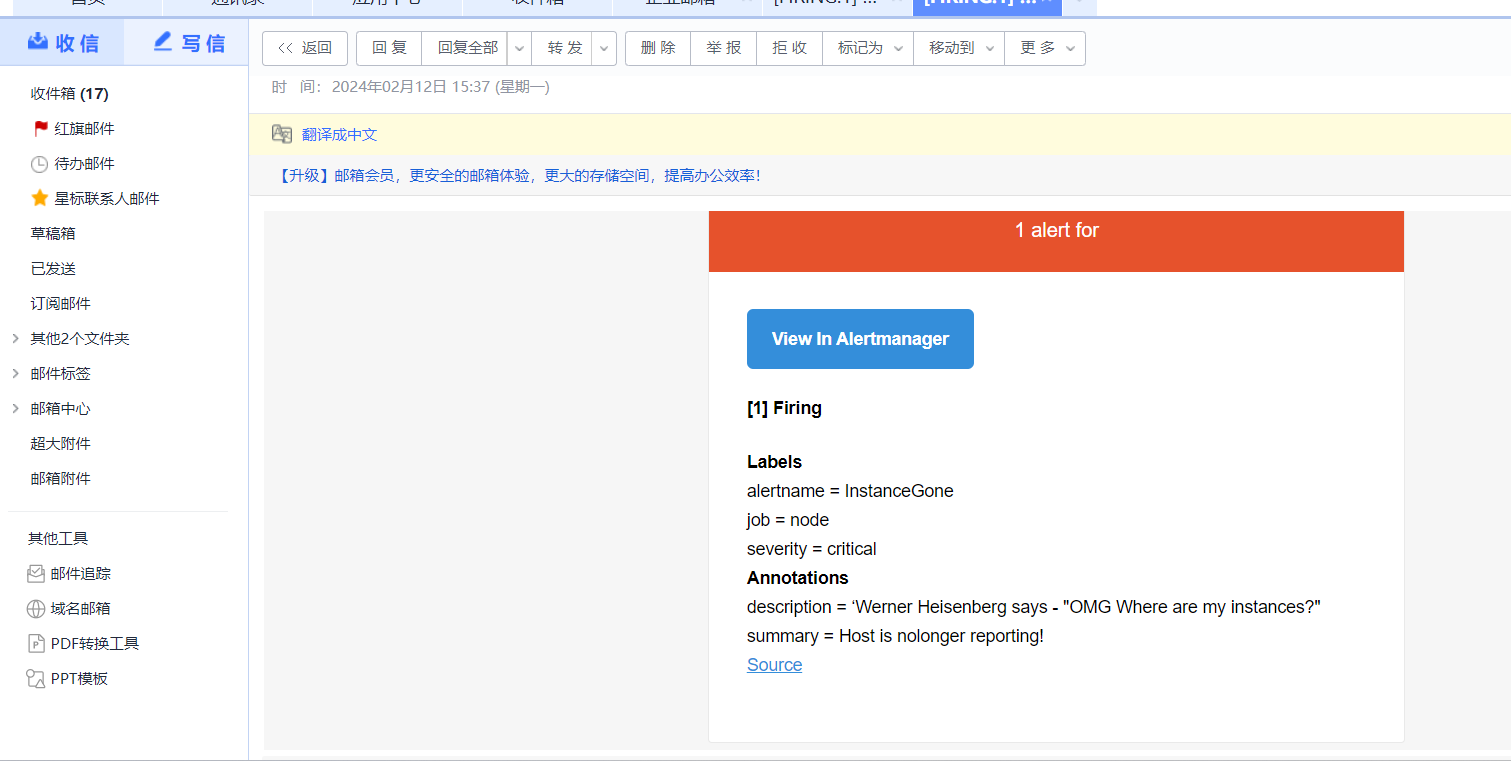

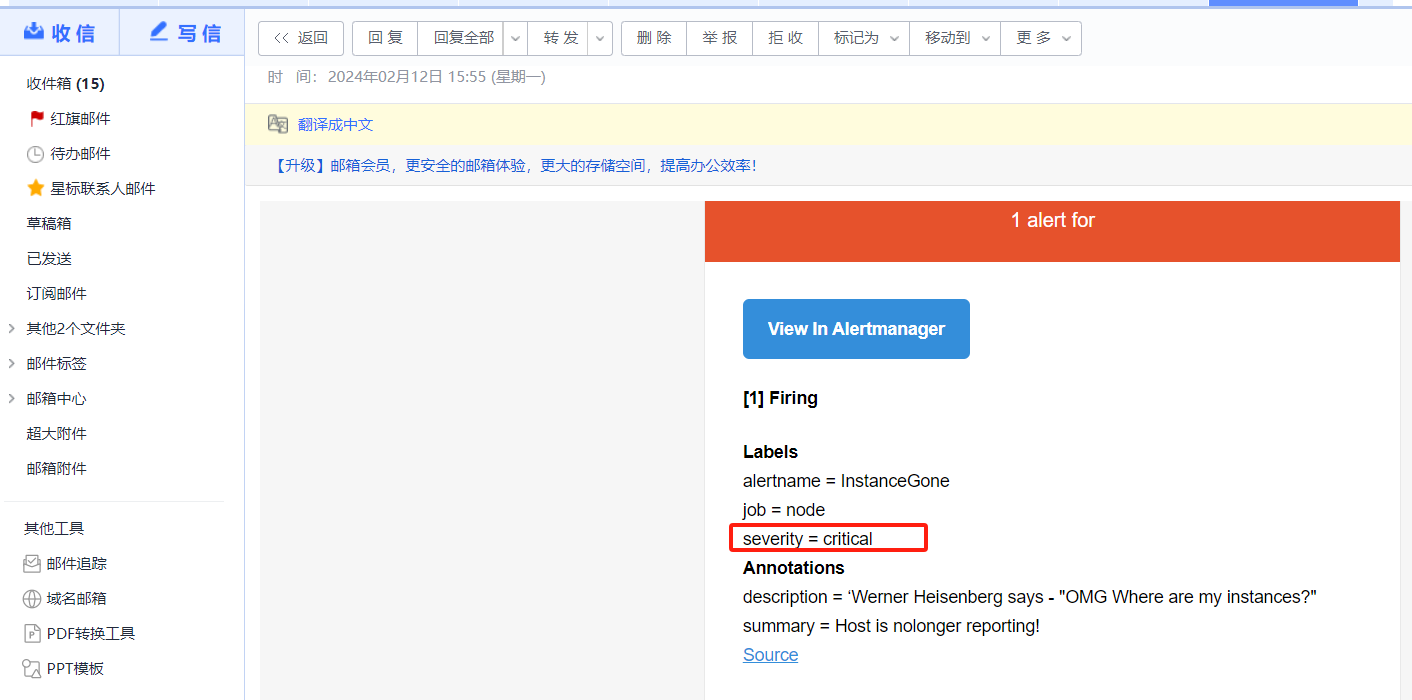
路由表(多条件匹配)
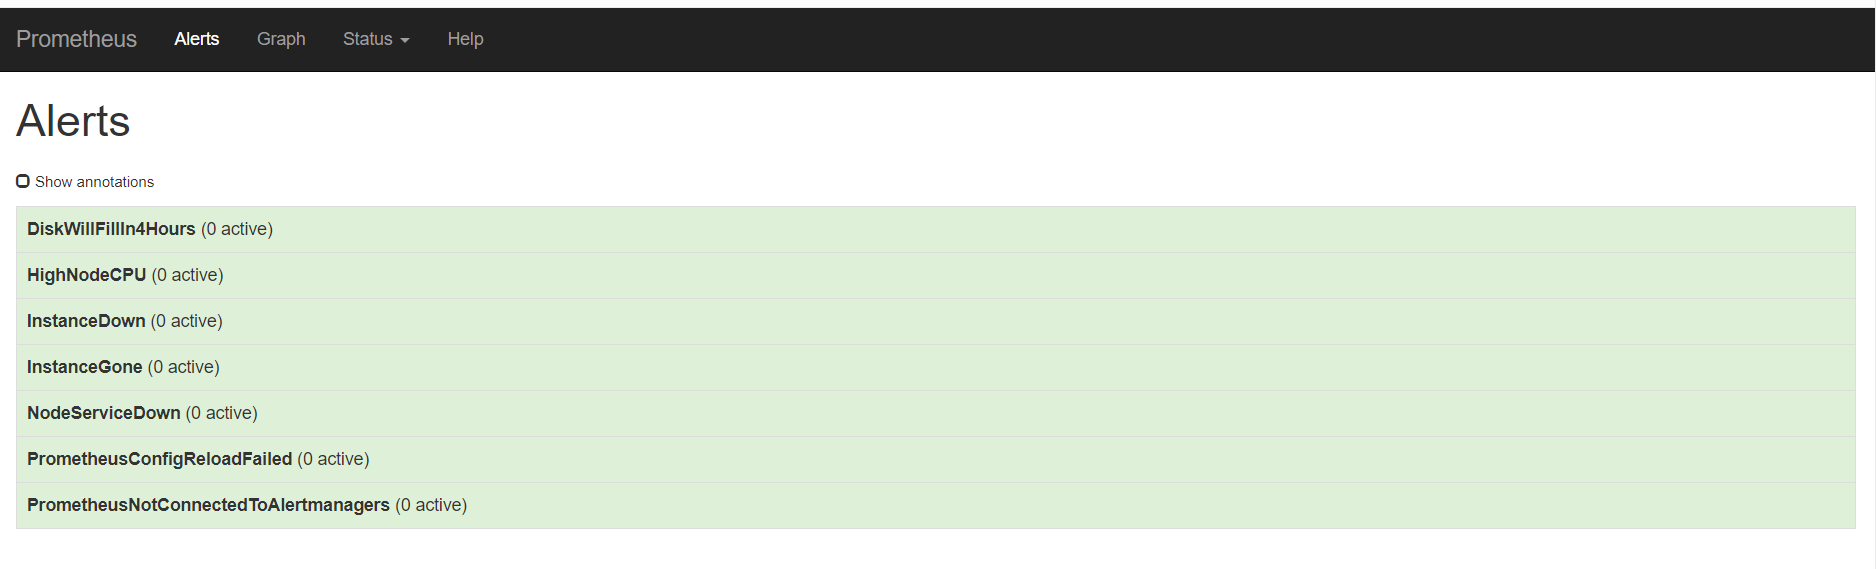
现在的配置是这个的
[root@mcw04 ~]# cat /etc/alertmanager/alertmanager.yml
global:
  smtp_smarthost: 'smtp.163.com:465'
  smtp_from: '13xx32@163.com'
  smtp_auth_username: '13xx2@163.com'
  smtp_auth_password: 'ExxSRNW'
  smtp_require_tls: false

templates:
  - '/etc/alertmanager/template/*.tmpl'

route:
  group_by: ['instance','cluster']
  group_wait: 30s
  group_interval: 5m
  repeat_interval: 3h
  receiver: email
  routes:
  - match:
      severity: critical
    receiver: pager
  - match_re:
      serverity: ^(warning|critical)$
    receiver: support_team

receivers:
  - name: 'email'
    email_configs:
      - to: '8xx5@qq.com'
  - name: 'support_team'
    email_configs:
      - to: '8xx5@qq.com'
  - name: 'pager'
    email_configs:
      - to: '13xx2@163.com'
[root@mcw04 ~]#
critical会匹配到pager,pager是163邮箱
停止一个服务,触发带有critical标签的告警
[root@mcw02 ~]# systemctl stop rsyslog.service
[root@mcw02 ~]#
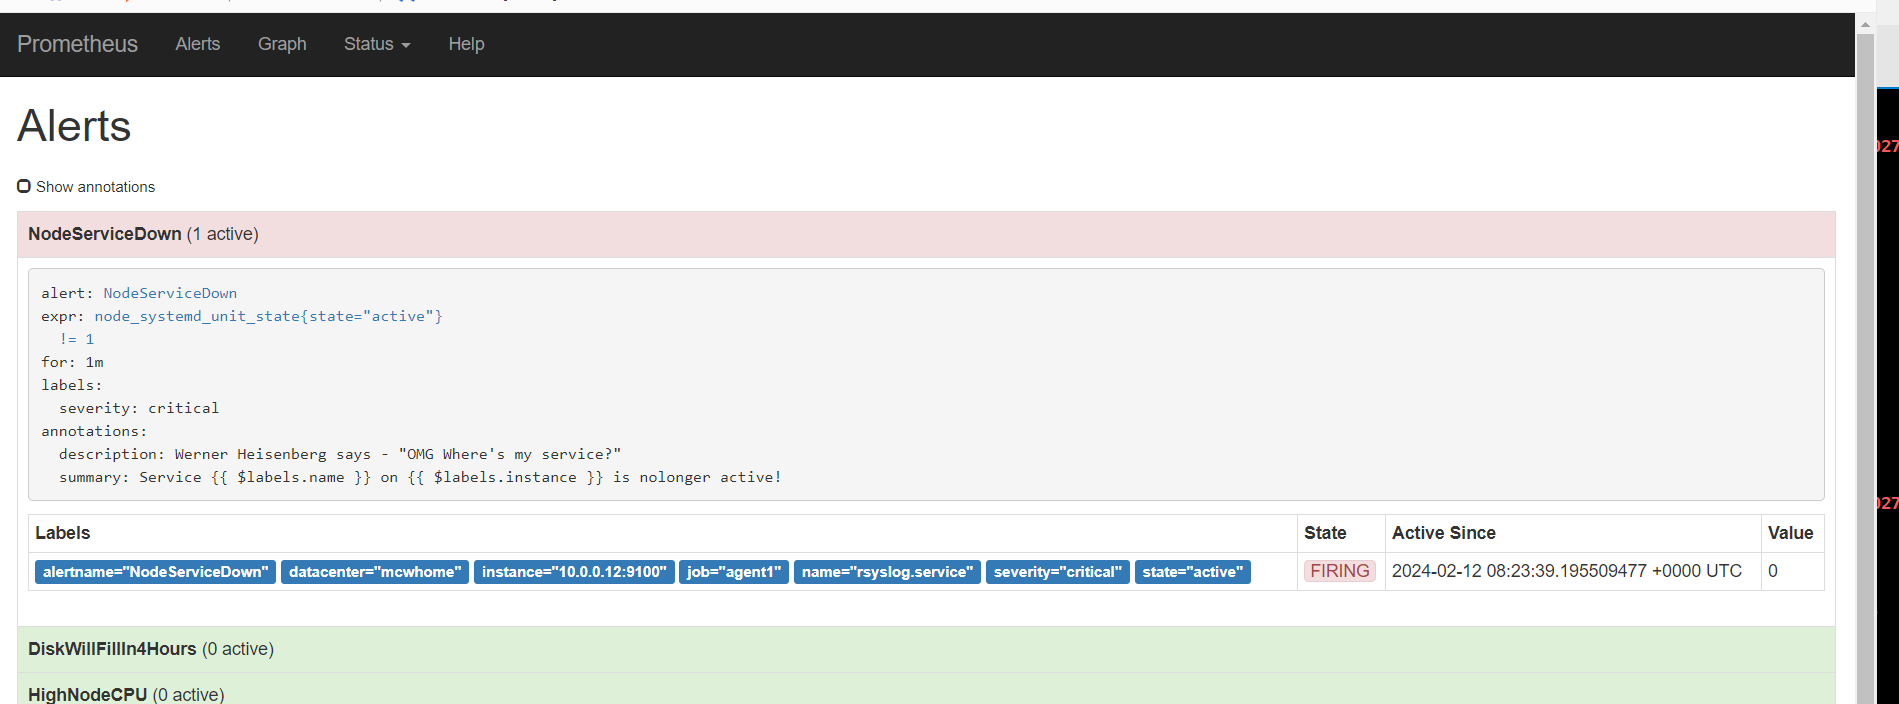
可以看到163邮箱有这个告警了
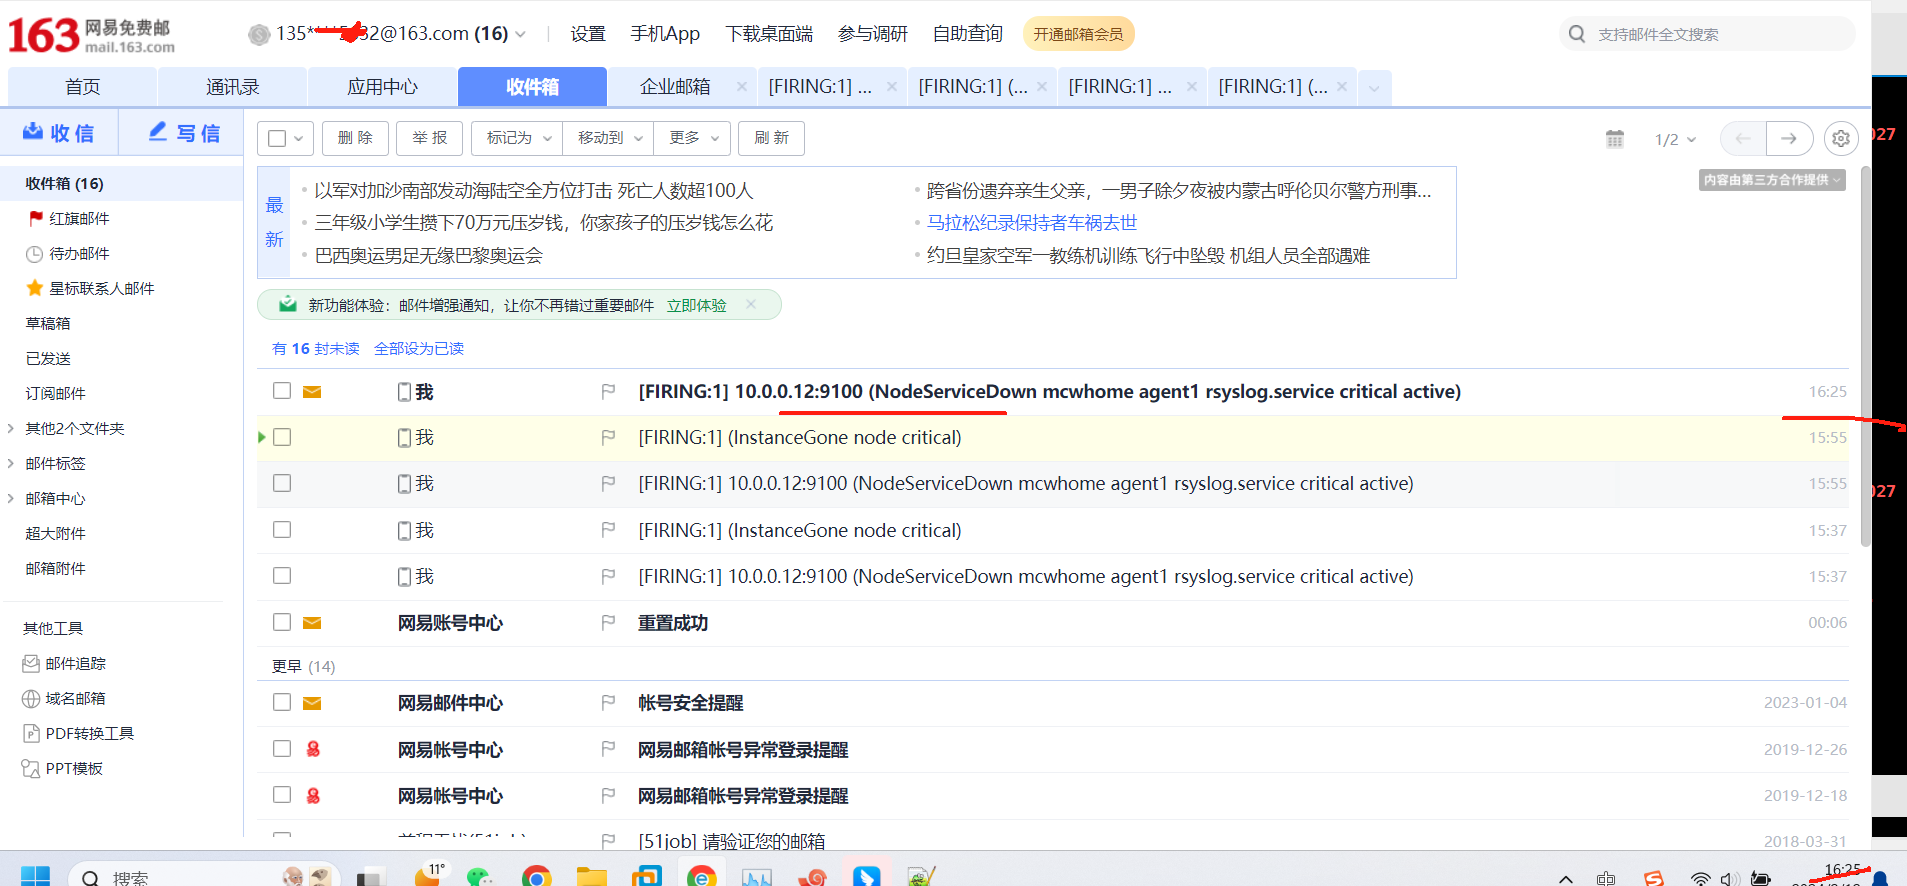
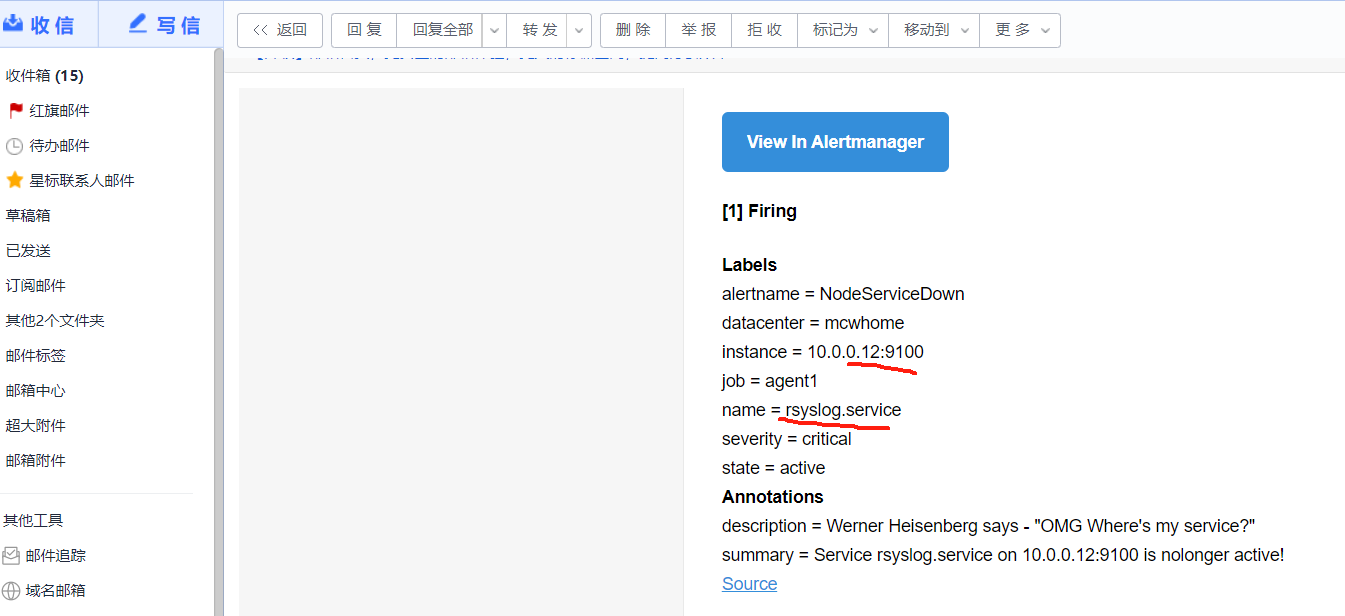
qq邮箱并没有
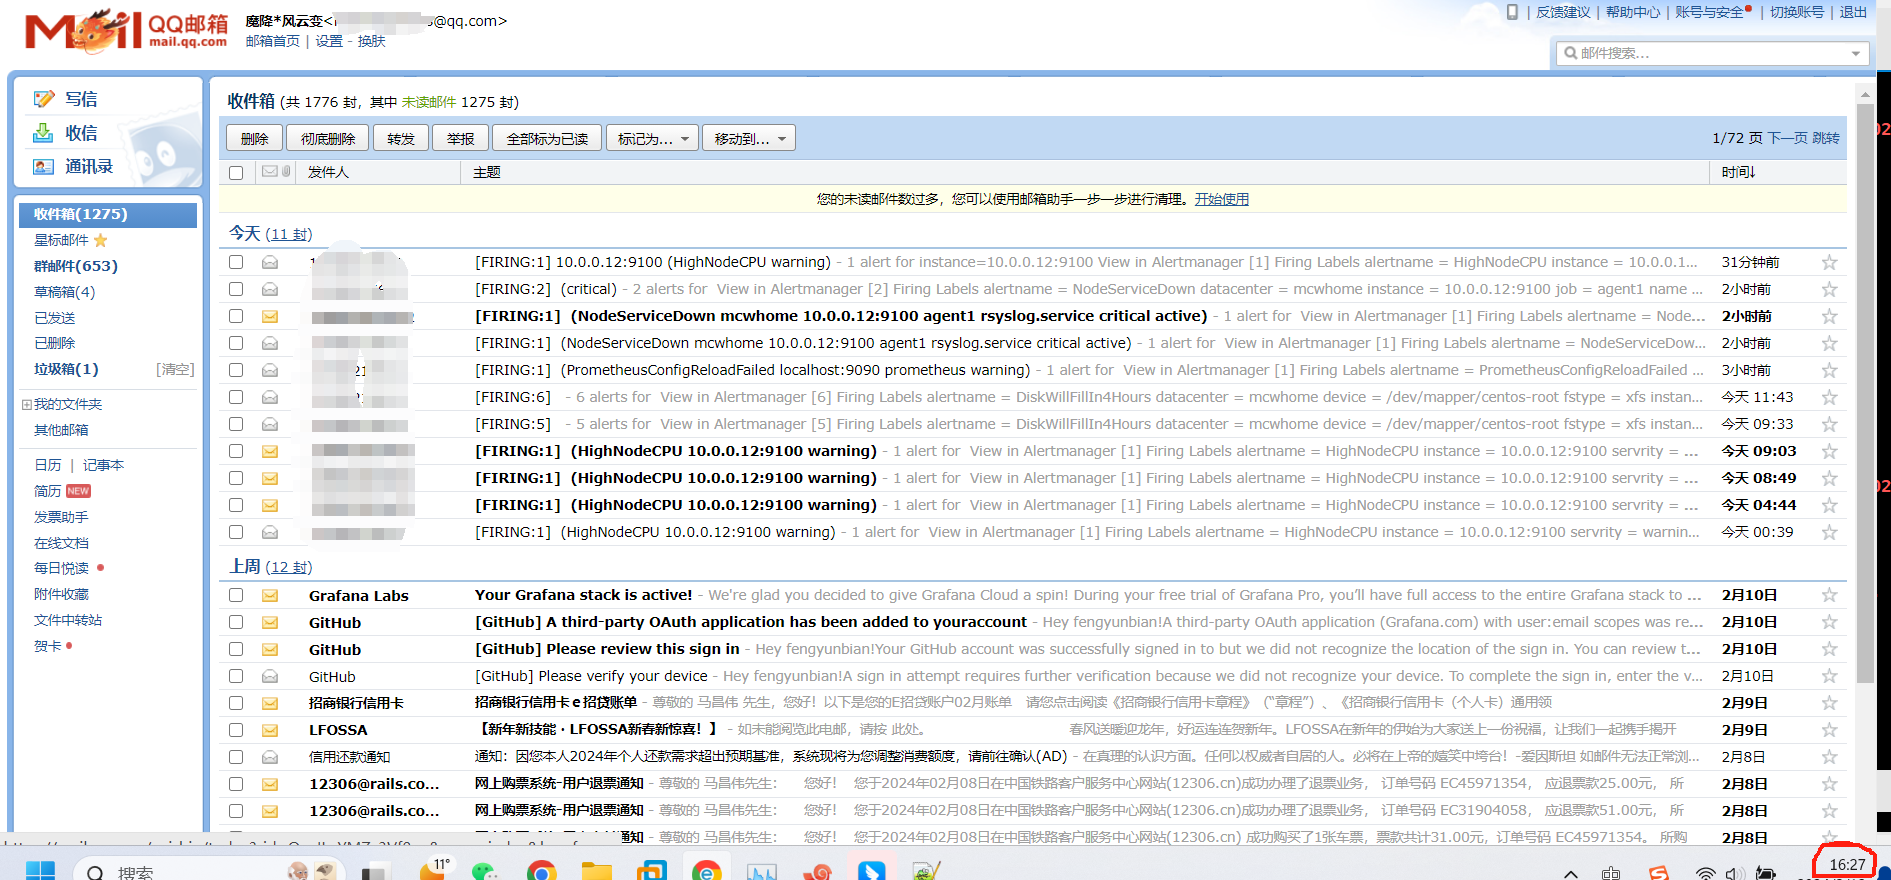
下面重新启动这个服务,恢复告警后,修改路由配置
首先给这个警报规则的,加个标签
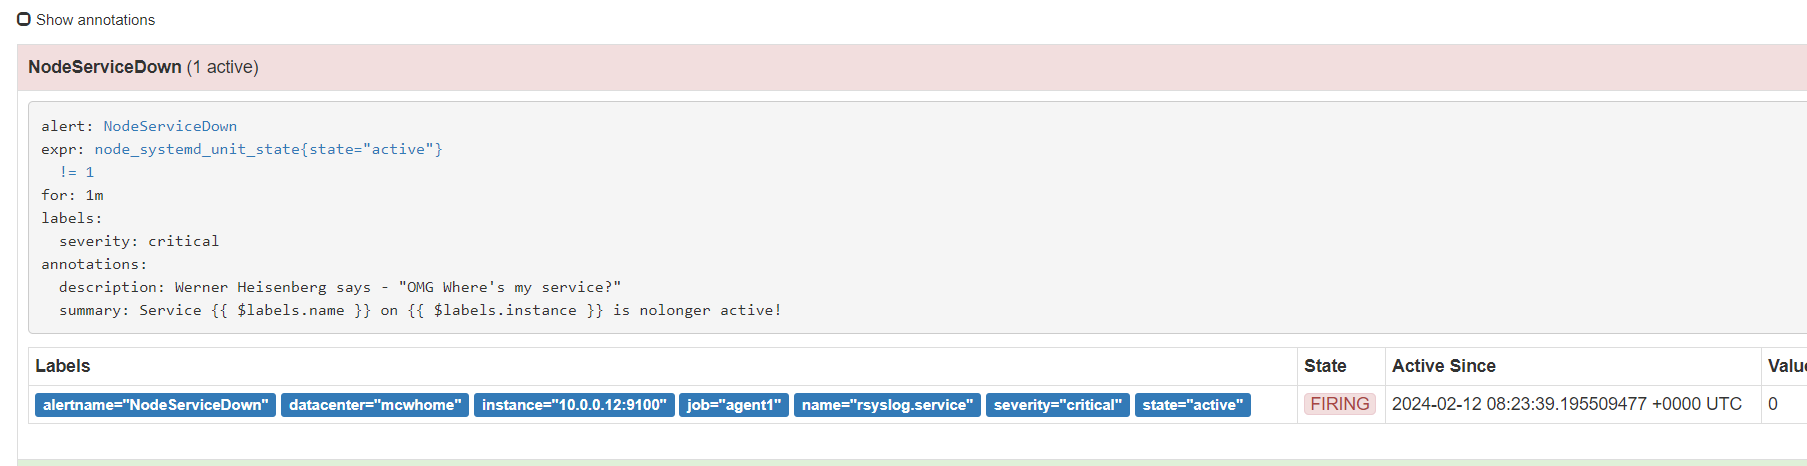
[root@mcw03 ~]# cat /etc/rules/keyongxing_alerts.yml
groups:
  - name: Keyongxing_alerts
    rules:
    - alert: NodeServiceDown
      expr: node_systemd_unit_state{state="active"} != 1
      for: 60s
      labels:
        severity: critical
        service: machangweiapp
      annotations:
        summary: Service {{ $labels.name }} on {{ $labels.instance }} is nolonger active!
        description: Werner Heisenberg says - "OMG Where's my service?"
[root@mcw03 ~]# curl -X POST http://localhost:9090/-/reload
[root@mcw03 ~]#
加的是这个标签
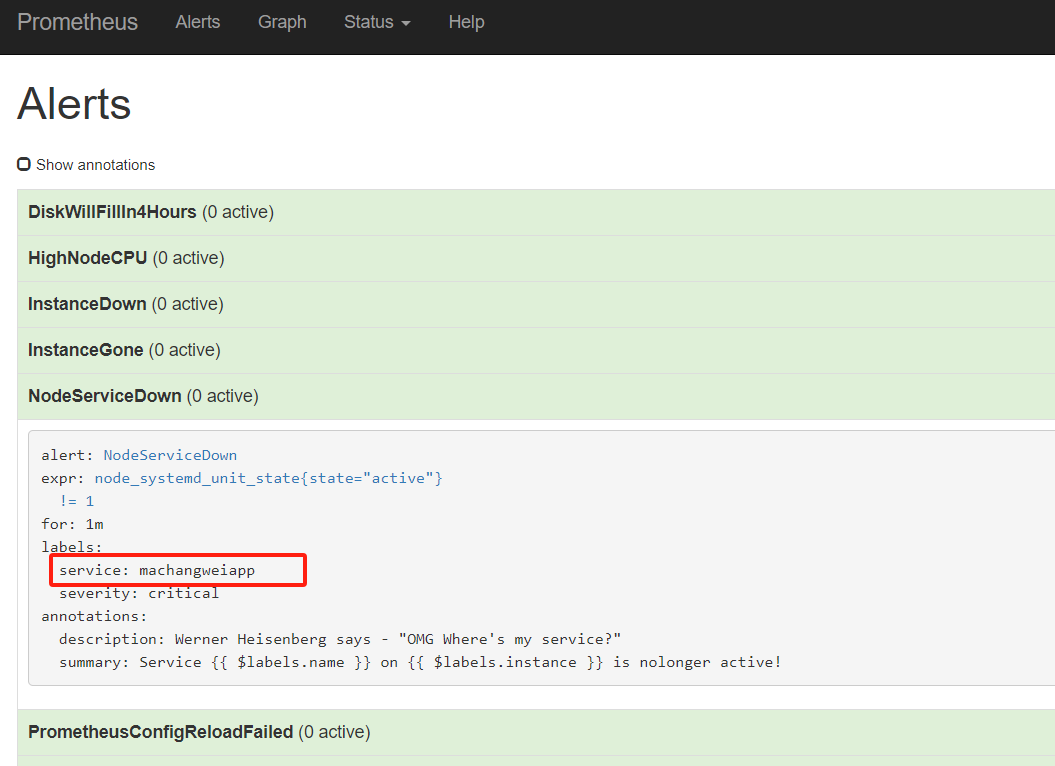
看配置,只看路由部分的,在match下,再接一个路由匹配,这样就是如果是有标签critical的会发给163邮箱。如果再匹配到service:machangweiapp的,那么会发送到qq邮箱,多层匹配。
[root@mcw04 ~]# cat /etc/alertmanager/alertmanager.yml
.....
route:
  group_by: ['instance','cluster']
  group_wait: 30s
  group_interval: 5m
  repeat_interval: 3h
  receiver: email
  routes:
  - match:
      severity: critical
    receiver: pager
    routes:
      - match:
          service: machangweiapp
      receiver: support_team
  - match_re:
      serverity: ^(warning|critical)$
    receiver: support_team

receivers:
  - name: 'email'
    email_configs:
      - to: '8x5@qq.com'
  - name: 'support_team'
    email_configs:
      - to: '8x15@qq.com'
  - name: 'pager'
    email_configs:
      - to: '13x2@163.com'
[root@mcw04 ~]#
[root@mcw04 ~]# systemctl restart alertmanager.service
[root@mcw04 ~]#
下面触发告警试试
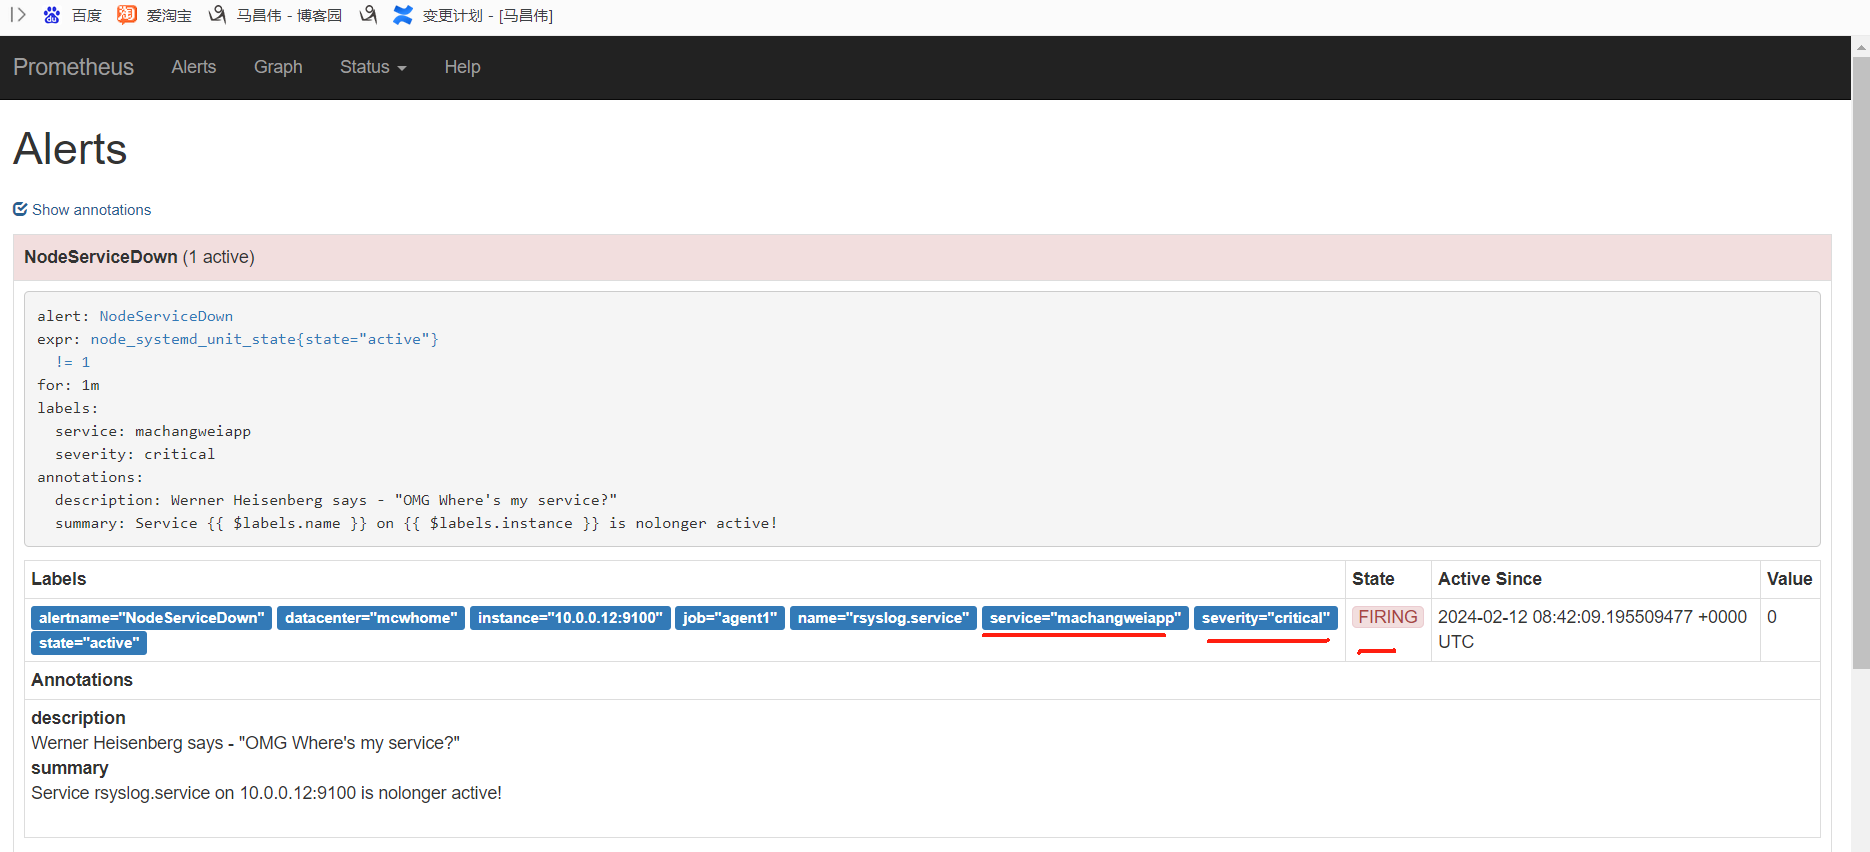
有问题,告警服务
[root@mcw04 ~]# systemctl status alertmanager.service
● alertmanager.service - Prometheus Alertmanager
   Loaded: loaded (/etc/systemd/system/alertmanager.service; disabled; vendor preset: disabled)
   Active: failed (Result: start-limit) since Mon 2024-02-12 16:41:26 CST; 7min ago
  Process: 29042 ExecStart=/usr/local/bin/alertmanager --config.file=/etc/alertmanager/alertmanager.yml --storage.path=/var/lib/alertmanager/ (code=exited, status=1/FAILURE)
 Main PID: 29042 (code=exited, status=1/FAILURE)

Feb 12 16:41:26 mcw04 systemd[1]: alertmanager.service: main process exited, code=exited, status=1/FAILURE
Feb 12 16:41:26 mcw04 systemd[1]: Unit alertmanager.service entered failed state.
Feb 12 16:41:26 mcw04 systemd[1]: alertmanager.service failed.
Feb 12 16:41:26 mcw04 systemd[1]: alertmanager.service holdoff time over, scheduling restart.
Feb 12 16:41:26 mcw04 systemd[1]: start request repeated too quickly for alertmanager.service
Feb 12 16:41:26 mcw04 systemd[1]: Failed to start Prometheus Alertmanager.
Feb 12 16:41:26 mcw04 systemd[1]: Unit alertmanager.service entered failed state.
Feb 12 16:41:26 mcw04 systemd[1]: alertmanager.service failed.
[root@mcw04 ~]# less /var/log/messages
[root@mcw04 ~]# tail -6  /var/log/messages
Feb 12 16:41:26 mcw04 systemd: alertmanager.service holdoff time over, scheduling restart.
Feb 12 16:41:26 mcw04 systemd: start request repeated too quickly for alertmanager.service
Feb 12 16:41:26 mcw04 systemd: Failed to start Prometheus Alertmanager.
Feb 12 16:41:26 mcw04 systemd: Unit alertmanager.service entered failed state.
Feb 12 16:41:26 mcw04 systemd: alertmanager.service failed.
Feb 12 16:45:33 mcw04 grafana-server: logger=cleanup t=2024-02-12T16:45:33.590972694+08:00 level=info msg="Completed cleanup jobs" duration=22.429387ms
[root@mcw04 ~]#
报错了,因为配置文件错了
[root@mcw04 ~]# journalctl -u alertmanager

Feb 12 16:50:08 mcw04 alertmanager[29189]: ts=2024-02-12T08:50:08.744Z caller=cluster.go:186 level=info component=cluster msg="setting advertise address explicitly" addr=10.0.0.14
Feb 12 16:50:08 mcw04 alertmanager[29189]: ts=2024-02-12T08:50:08.751Z caller=cluster.go:683 level=info component=cluster msg="Waiting for gossip to settle..." interval=2s
Feb 12 16:50:08 mcw04 alertmanager[29189]: ts=2024-02-12T08:50:08.782Z caller=coordinator.go:113 level=info component=configuration msg="Loading configuration file" file=/etc/alert
Feb 12 16:50:08 mcw04 alertmanager[29189]: ts=2024-02-12T08:50:08.782Z caller=coordinator.go:118 level=error component=configuration msg="Loading configuration file failed" file=/e
Feb 12 16:50:08 mcw04 alertmanager[29189]: ts=2024-02-12T08:50:08.783Z caller=cluster.go:692 level=info component=cluster msg="gossip not settled but continuing anyway" polls=0 ela
Feb 12 16:50:08 mcw04 systemd[1]: alertmanager.service: main process exited, code=exited, status=1/FAILURE
Feb 12 16:50:08 mcw04 systemd[1]: Unit alertmanager.service entered failed state.
Feb 12 16:50:08 mcw04 systemd[1]: alertmanager.service failed.
Feb 12 16:50:08 mcw04 systemd[1]: alertmanager.service holdoff time over, scheduling restart.
Feb 12 16:50:08 mcw04 systemd[1]: start request repeated too quickly for alertmanager.service
Feb 12 16:50:08 mcw04 systemd[1]: Failed to start Prometheus Alertmanager.
Feb 12 16:50:08 mcw04 systemd[1]: Unit alertmanager.service entered failed state.
Feb 12 16:50:08 mcw04 systemd[1]: alertmanager.service failed.
这里应该是齐平
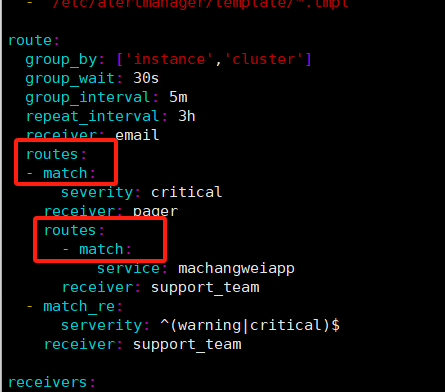
改成如下,route -match 两个,多了空格
route:
  group_by: ['instance','cluster']
  group_wait: 30s
  group_interval: 5m
  repeat_interval: 3h
  receiver: email
  routes:
  - match:
      severity: critical
    receiver: pager
    routes:
    - match:
        service: machangweiapp
      receiver: support_team
  - match_re:
      serverity: ^(warning|critical)$
    receiver: support_team
再次重启,正常了
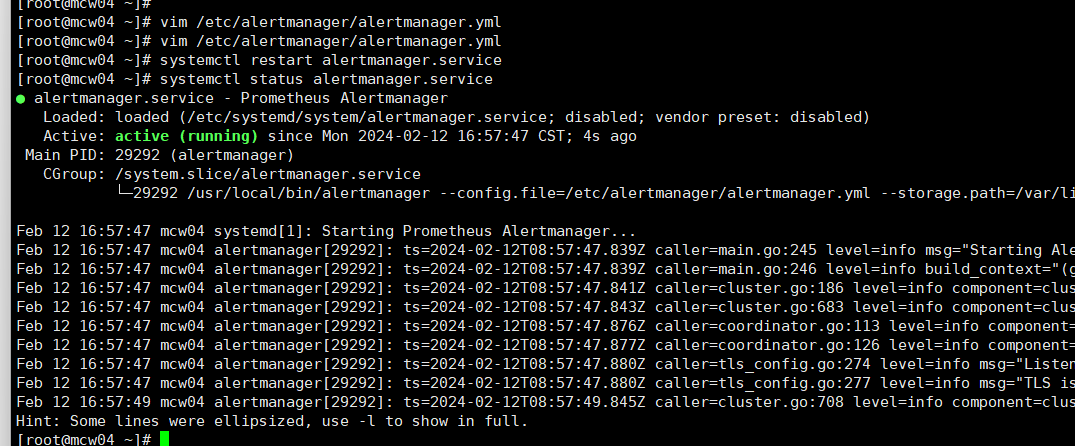
可以看到,已经按照预期,发送给qq了
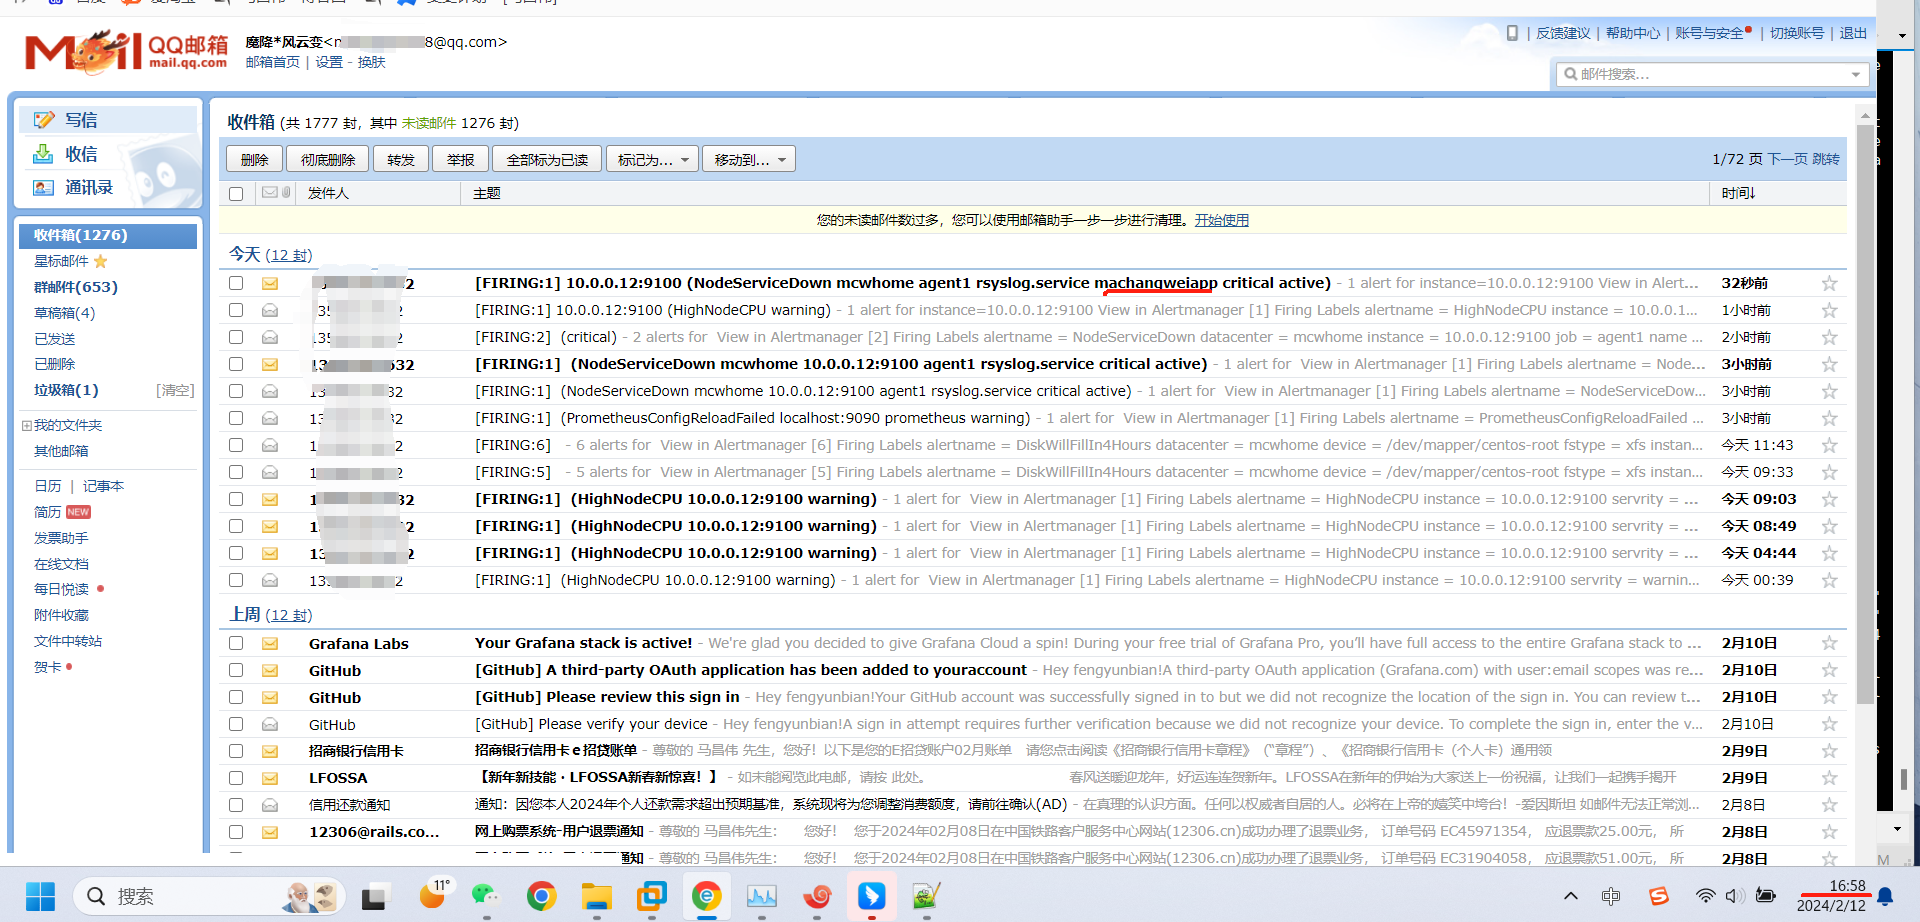
163邮箱没有收到
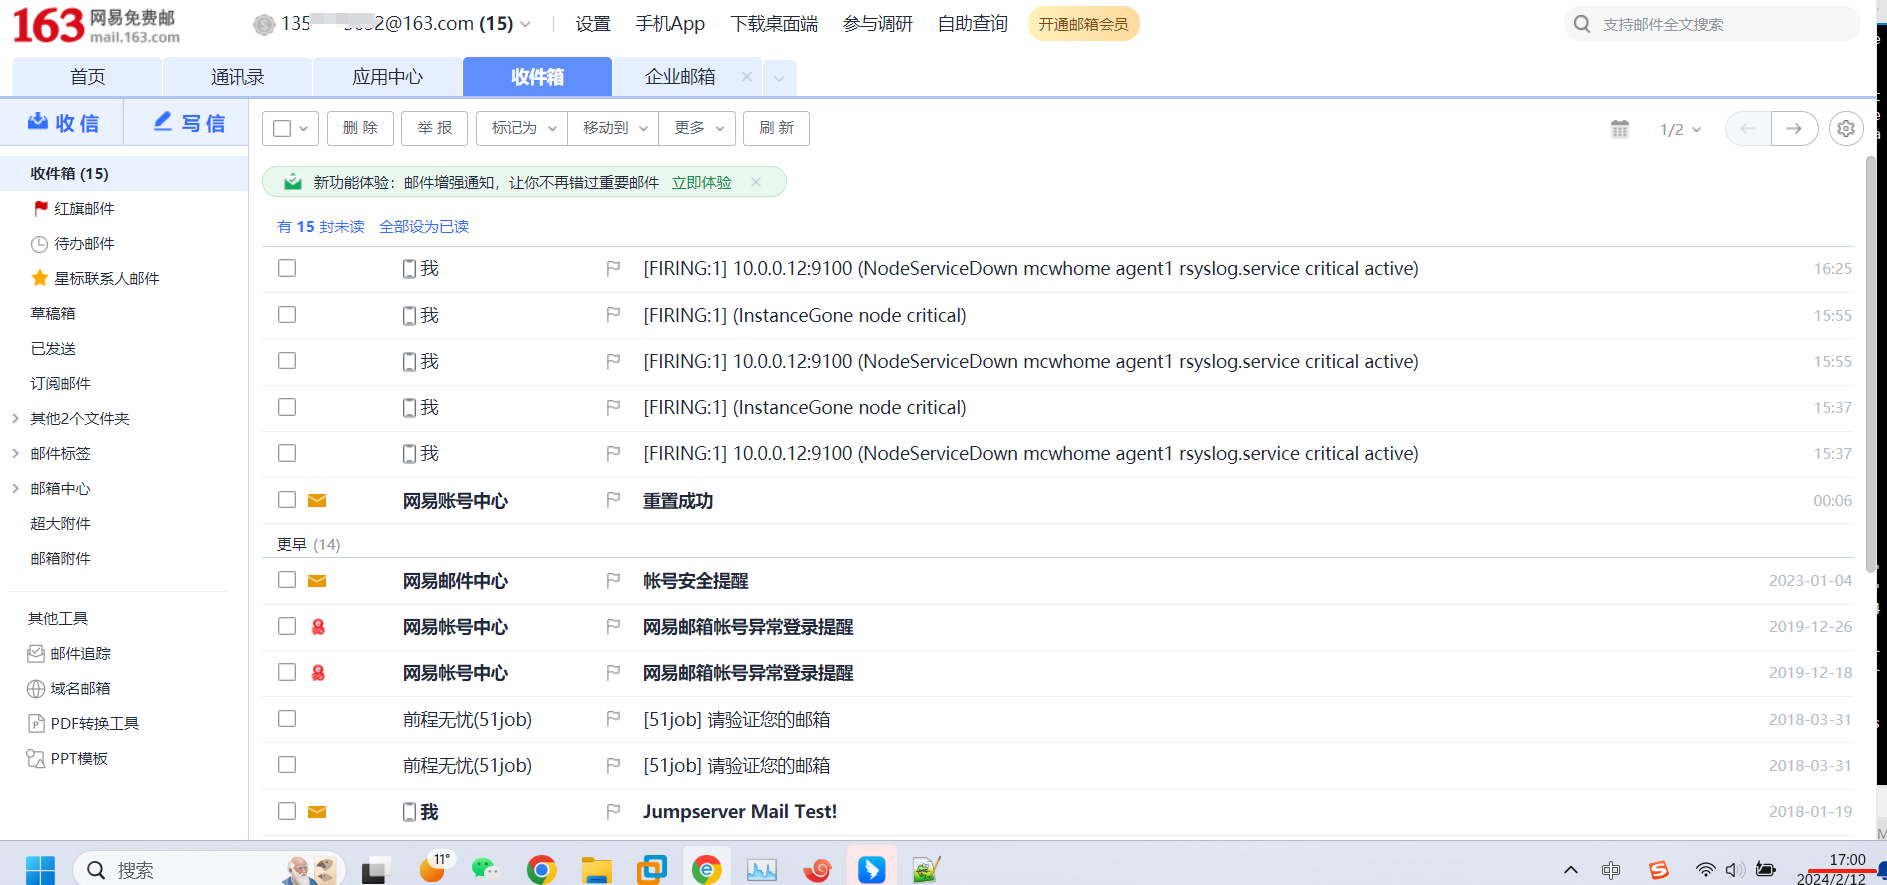
continue开启之后,好像是这个匹配上之后,还可以继续往下匹配;如果是发送到多个地方,可以用这个,默认值是false。
  routes:
  - match:
      severity: critical
    receiver: pager
    continue: true
接收器和通知模板
接收器
在pager接收者下面加slack_configs配置
  - name: 'pager'
    email_configs:
      - to: '13x32@163.com'
    slack_configs:
      - api_url: https://hooks.slack.com/services/ABC123/ABC123/EXAMPLE
        channel: #monitoring
        text: '{{ .CommonAnnotations.summary }}'
[root@mcw04 ~]# cat /etc/alertmanager/alertmanager.yml
global:
  smtp_smarthost: 'smtp.163.com:465'
  smtp_from: '13xx32@163.com'
  smtp_auth_username: '13x2@163.com'
  smtp_auth_password: 'ExSRNW'
  smtp_require_tls: false

templates:
  - '/etc/alertmanager/template/*.tmpl'

route:
  group_by: ['instance','cluster']
  group_wait: 30s
  group_interval: 5m
  repeat_interval: 3h
  receiver: email
  routes:
  - match:
      severity: critical
    receiver: pager
    #routes:
    #- match:
    #    service: machangweiapp
    #  receiver: support_team
  - match_re:
      serverity: ^(warning|critical)$
    receiver: support_team

receivers:
  - name: 'email'
    email_configs:
      - to: '89x5@qq.com'
  - name: 'support_team'
    email_configs:
      - to: '89x15@qq.com'
  - name: 'pager'
    email_configs:
      - to: '13x32@163.com'
    slack_configs:
      - api_url: https://hooks.slack.com/services/ABC123/ABC123/EXAMPLE
        channel: #monitoring
        text: '{{ .CommonAnnotations.summary }}'
[root@mcw04 ~]#
[root@mcw04 ~]# systemctl restart alertmanager.service
[root@mcw04 ~]#
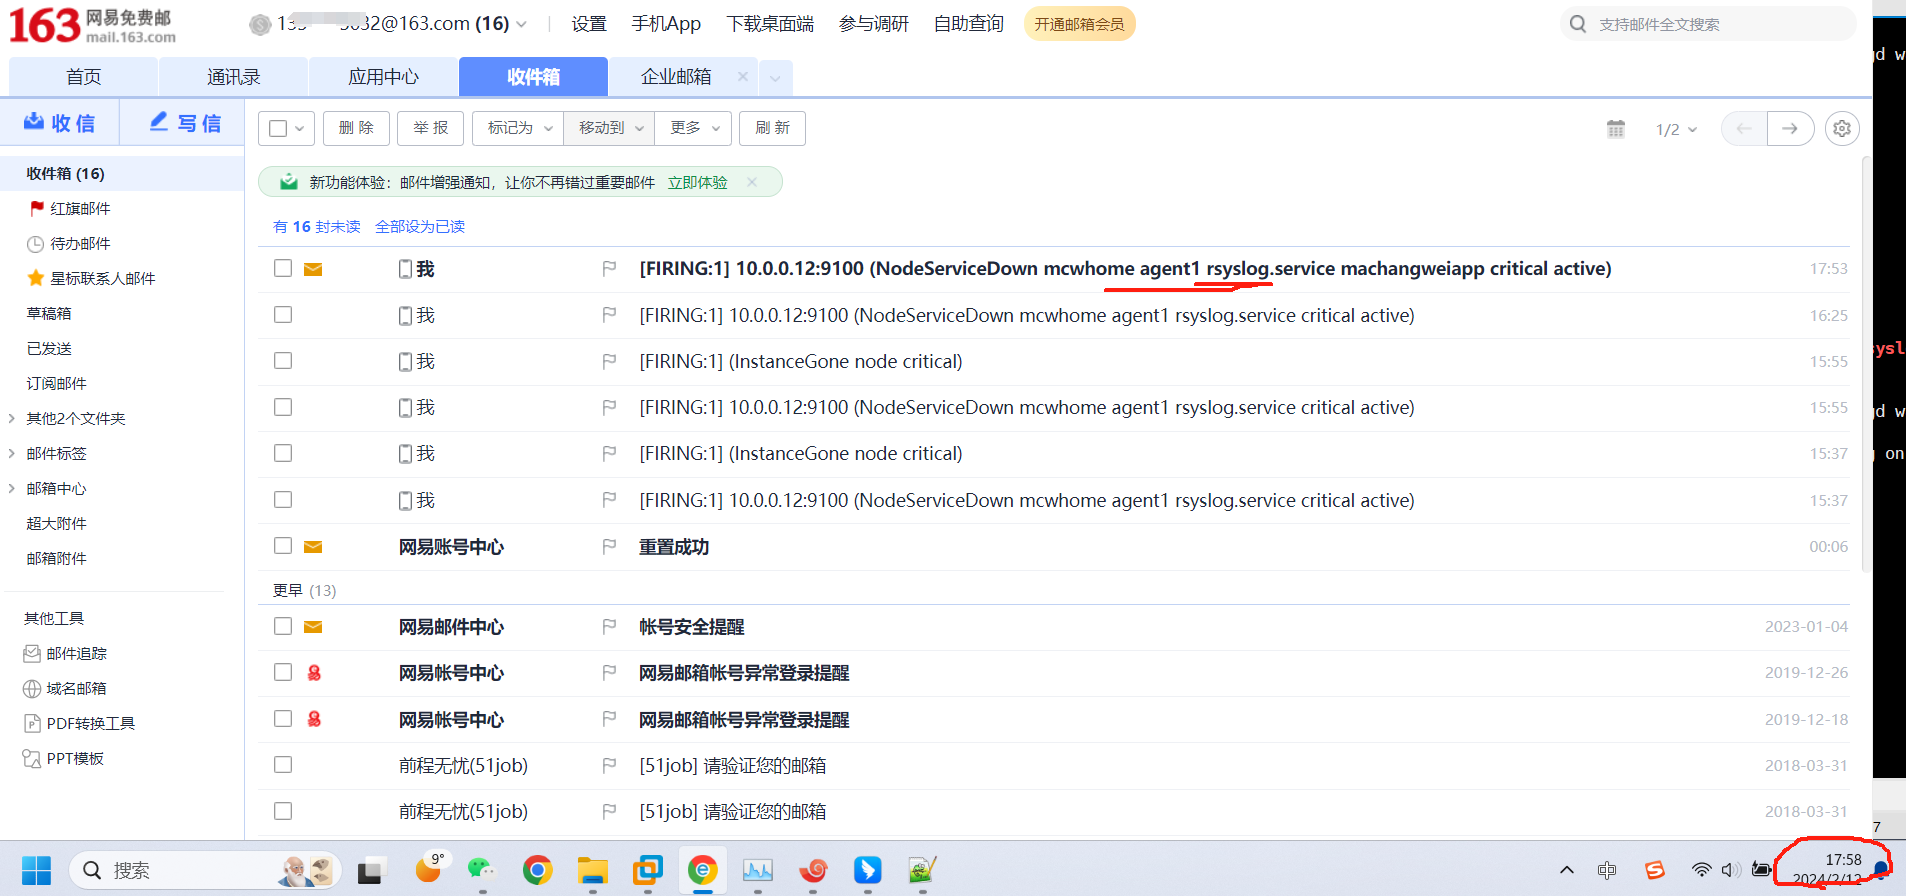
结果是这样的
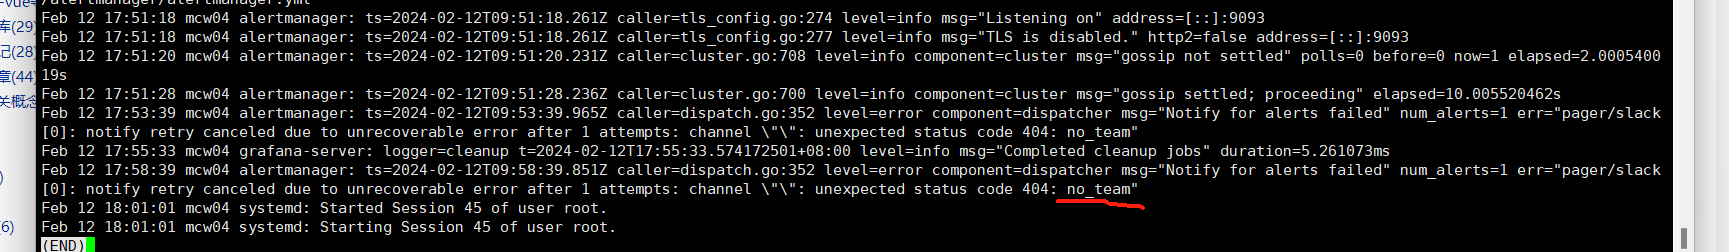
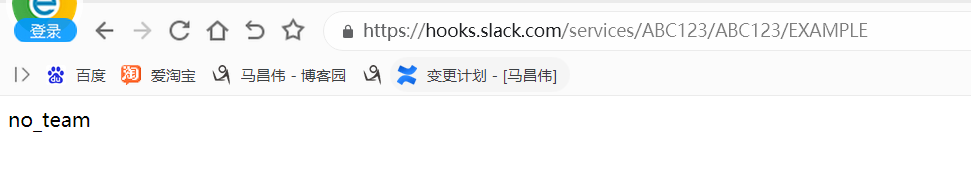
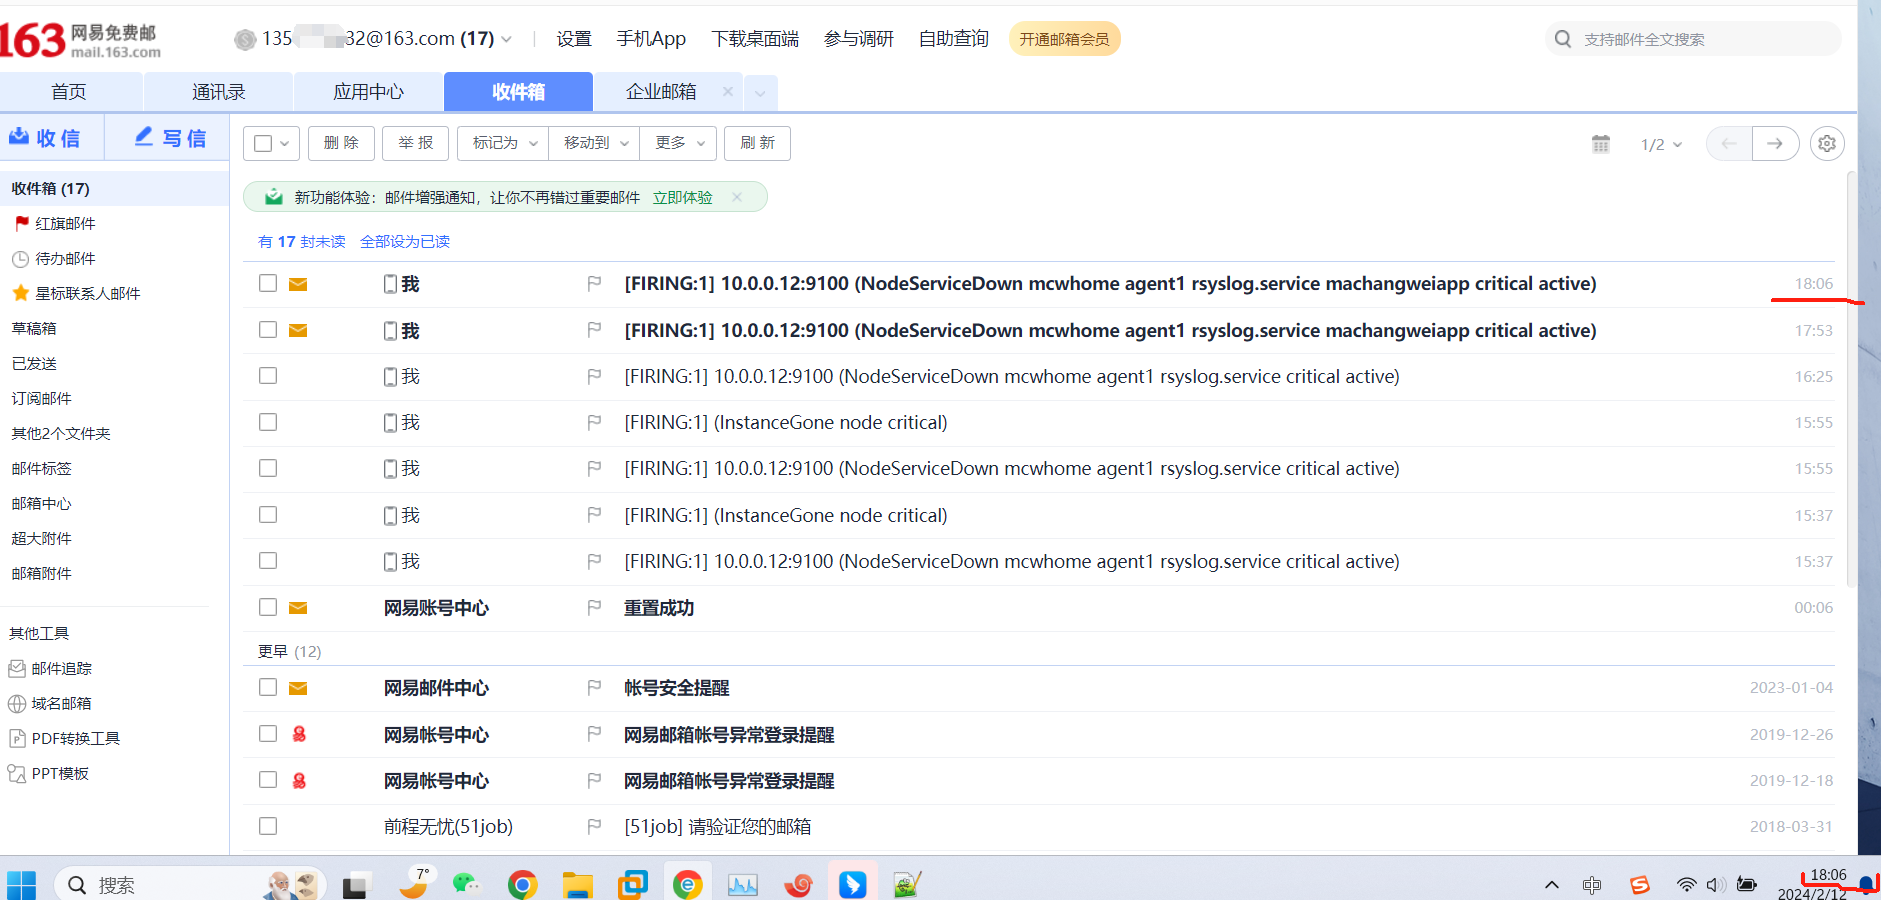
告警发送到钉钉群
钉钉机器人创建:
https://www.cnblogs.com/machangwei-8/p/18013311
- 下载地址:https://github.com/timonwong/prometheus-webhook-dingtalk/releases
- 本次安装版本为
2.1.0
- 根据服务器情况选择安装目录,上传安装包。
- 部署包下载完毕,开始安装
cd /prometheus
tar -xvzf prometheus-webhook-dingtalk-2.1.0.linux-amd64.tar.gz
mv prometheus-webhook-dingtalk-2.1.0.linux-amd64 webhook_dingtalk
cd webhook_dingtalk
- 编写配置文件(复制之后切记删除#的所有注释,否则启动服务时会报错),将上述获取的钉钉webhook地址填写到如下文件
vim dingtalk.yml
timeout: 5s

targets:
  webhook_robot:
  	# 钉钉机器人创建后的webhook地址
    url: https://oapi.dingtalk.com/robot/send?access_token=xxxxxxxxxxxx
  webhook_mention_all:
  	# 钉钉机器人创建后的webhook地址
    url: https://oapi.dingtalk.com/robot/send?access_token=xxxxxxxxxxxx
    # 提醒全员
    mention:
      all: true
- 进行系统service编写
创建webhook_dingtalk配置文件
cd /usr/lib/systemd/system
vim webhook_dingtalk.service
- webhook_dingtalk.service 文件填入如下内容后保存
:wq
[Unit]
Description=https://prometheus.io

[Service]
Restart=on-failure
ExecStart=/prometheus/webhook_dingtalk/prometheus-webhook-dingtalk --config.file=/prometheus/webhook_dingtalk/dingtalk.yml --web.listen-address=:8060

[Install]
WantedBy=multi-user.target- 查看配置文件
cat webhook_dingtalk.service
- 刷新服务配置并启动服务
systemctl daemon-reload
systemctl start webhook_dingtalk.service
- 查看服务运行状态
systemctl status webhook_dingtalk.service
- 设置开机自启动
systemctl enable webhook_dingtalk.service
- 我们记下
urls=http://localhost:8060/dingtalk/webhook_robot/send这一段值,接下来的配置会用上
配置Alertmanager
打开 /prometheus/alertmanager/alertmanager.yml,修改为如下内容
global:
  # 在没有报警的情况下声明为已解决的时间
  resolve_timeout: 5m

route:
  # 接收到告警后到自定义分组
  group_by: ["alertname"]
  # 分组创建后初始化等待时长
  group_wait: 10s
  # 告警信息发送之前的等待时长
  group_interval: 30s
  # 重复报警的间隔时长
  repeat_interval: 5m
  # 默认消息接收
  receiver: "dingtalk"

receivers:
  # 钉钉
  - name: 'dingtalk'
    webhook_configs:
    	# prometheus-webhook-dingtalk服务的地址
      - url: http://1xx.xx.xx.7:8060/dingtalk/webhook_robot/send
send_resolved: true在prometheus安装文件夹根目录增加alert_rules.yml配置文件,内容如下
groups:
  - name: alert_rules
    rules:
      - alert: CpuUsageAlertWarning
        expr: sum(avg(irate(node_cpu_seconds_total{mode!='idle'}[5m])) without (cpu)) by (instance) > 0.60
        for: 2m
        labels:
          level: warning
        annotations:
          summary: "Instance {{ $labels.instance }} CPU usage high"
          description: "{{ $labels.instance }} CPU usage above 60% (current value: {{ $value }})"
      - alert: CpuUsageAlertSerious
        #expr: sum(avg(irate(node_cpu_seconds_total{mode!='idle'}[5m])) without (cpu)) by (instance) > 0.85
        expr: (100 - (avg by (instance) (irate(node_cpu_seconds_total{job=~".*",mode="idle"}[5m])) * 100)) > 85
        for: 3m
        labels:
          level: serious
        annotations:
          summary: "Instance {{ $labels.instance }} CPU usage high"
          description: "{{ $labels.instance }} CPU usage above 85% (current value: {{ $value }})"
      - alert: MemUsageAlertWarning
        expr: avg by(instance) ((1 - (node_memory_MemFree_bytes + node_memory_Buffers_bytes + node_memory_Cached_bytes) / node_memory_MemTotal_bytes) * 100) > 70
        for: 2m
        labels:
          level: warning
        annotations:
          summary: "Instance {{ $labels.instance }} MEM usage high"
          description: "{{$labels.instance}}: MEM usage is above 70% (current value is: {{ $value }})"
      - alert: MemUsageAlertSerious
        expr: (node_memory_MemTotal_bytes - node_memory_MemAvailable_bytes)/node_memory_MemTotal_bytes > 0.90
        for: 3m
        labels:
          level: serious
        annotations:
          summary: "Instance {{ $labels.instance }} MEM usage high"
          description: "{{ $labels.instance }} MEM usage above 90% (current value: {{ $value }})"
      - alert: DiskUsageAlertWarning
        expr: (1 - node_filesystem_free_bytes{fstype!="rootfs",mountpoint!="",mountpoint!~"/(run|var|sys|dev).*"} / node_filesystem_size_bytes) * 100 > 80
        for: 2m
        labels:
          level: warning
        annotations:
          summary: "Instance {{ $labels.instance }} Disk usage high"
          description: "{{$labels.instance}}: Disk usage is above 80% (current value is: {{ $value }})"
      - alert: DiskUsageAlertSerious
        expr: (1 - node_filesystem_free_bytes{fstype!="rootfs",mountpoint!="",mountpoint!~"/(run|var|sys|dev).*"} / node_filesystem_size_bytes) * 100 > 90
        for: 3m
        labels:
          level: serious
        annotations:
          summary: "Instance {{ $labels.instance }} Disk usage high"
          description: "{{$labels.instance}}: Disk usage is above 90% (current value is: {{ $value }})"
      - alert: NodeFileDescriptorUsage
        expr: avg by (instance) (node_filefd_allocated{} / node_filefd_maximum{}) * 100 > 60
        for: 2m
        labels:
          level: warning
        annotations:
          summary: "Instance {{ $labels.instance }} File Descriptor usage high"
          description: "{{$labels.instance}}: File Descriptor usage is above 60% (current value is: {{ $value }})"
      - alert: NodeLoad15
        expr: avg by (instance) (node_load15{}) > 80
        for: 2m
        labels:
          level: warning
        annotations:
          summary: "Instance {{ $labels.instance }} Load15 usage high"
          description: "{{$labels.instance}}: Load15 is above 80 (current value is: {{ $value }})"
      - alert: NodeAgentStatus
        expr: avg by (instance) (up{}) == 0
        for: 2m
        labels:
          level: warning
        annotations:
          summary: "{{$labels.instance}}: has been down"
          description: "{{$labels.instance}}: Node_Exporter Agent is down (current value is: {{ $value }})"
      - alert: NodeProcsBlocked
        expr: avg by (instance) (node_procs_blocked{}) > 10
        for: 2m
        labels:
          level: warning
        annotations:
          summary: "Instance {{ $labels.instance }}  Process Blocked usage high"
          description: "{{$labels.instance}}: Node Blocked Procs detected! above 10 (current value is: {{ $value }})"
      - alert: NetworkTransmitRate
        #expr:  avg by (instance) (floor(irate(node_network_transmit_bytes_total{device="ens192"}[2m]) / 1024 / 1024)) > 50
        expr:  avg by (instance) (floor(irate(node_network_transmit_bytes_total{}[2m]) / 1024 / 1024 * 8 )) > 40
        for: 1m
        labels:
          level: warning
        annotations:
          summary: "Instance {{ $labels.instance }} Network Transmit Rate usage high"
          description: "{{$labels.instance}}: Node Transmit Rate (Upload) is above 40Mbps/s (current value is: {{ $value }}Mbps/s)"
      - alert: NetworkReceiveRate
        #expr:  avg by (instance) (floor(irate(node_network_receive_bytes_total{device="ens192"}[2m]) / 1024 / 1024)) > 50
        expr:  avg by (instance) (floor(irate(node_network_receive_bytes_total{}[2m]) / 1024 / 1024 * 8 )) > 40
        for: 1m
        labels:
          level: warning
        annotations:
          summary: "Instance {{ $labels.instance }} Network Receive Rate usage high"
          description: "{{$labels.instance}}: Node Receive Rate (Download) is above 40Mbps/s (current value is: {{ $value }}Mbps/s)"
      - alert: DiskReadRate
        expr: avg by (instance) (floor(irate(node_disk_read_bytes_total{}[2m]) / 1024 )) > 200
        for: 2m
        labels:
          level: warning
        annotations:
          summary: "Instance {{ $labels.instance }} Disk Read Rate usage high"
          description: "{{$labels.instance}}: Node Disk Read Rate is above 200KB/s (current value is: {{ $value }}KB/s)"
      - alert: DiskWriteRate
        expr: avg by (instance) (floor(irate(node_disk_written_bytes_total{}[2m]) / 1024 / 1024 )) > 20
        for: 2m
        labels:
          level: warning
        annotations:
          summary: "Instance {{ $labels.instance }} Disk Write Rate usage high"
description: "{{$labels.instance}}: Node Disk Write Rate is above 20MB/s (current value is: {{ $value }}MB/s)"-
修改
prometheys.yml,最上方三个节点改为如下配置global: scrape_interval: 15s evaluation_interval: 15s alerting: alertmanagers: - static_configs: # alertmanager服务地址 - targets: ['11x.xx.x.7:9093'] rule_files: - "alert_rules.yml" -
执行
curl -XPOST localhost:9090/-/reload刷新prometheus配置 -
执行
systemctl restart alertmanger.service或docker restart alertmanager刷新alertmanger服务
验证配置
@@@自己操作
下载解压包
[root@mcw04 ~]# mv prometheus-webhook-dingtalk-2.1.0.linux-amd64.tar.gz /prometheus/
[root@mcw04 ~]# cd /prometheus/
[root@mcw04 prometheus]# ls
prometheus-webhook-dingtalk-2.1.0.linux-amd64.tar.gz
[root@mcw04 prometheus]# tar xf prometheus-webhook-dingtalk-2.1.0.linux-amd64.tar.gz
[root@mcw04 prometheus]# ls
prometheus-webhook-dingtalk-2.1.0.linux-amd64  prometheus-webhook-dingtalk-2.1.0.linux-amd64.tar.gz
[root@mcw04 prometheus]# cd prometheus-webhook-dingtalk-2.1.0.linux-amd64/
[root@mcw04 prometheus-webhook-dingtalk-2.1.0.linux-amd64]# ls
config.example.yml  contrib  LICENSE  prometheus-webhook-dingtalk
[root@mcw04 prometheus-webhook-dingtalk-2.1.0.linux-amd64]# cd ..
[root@mcw04 prometheus]# ls
prometheus-webhook-dingtalk-2.1.0.linux-amd64  prometheus-webhook-dingtalk-2.1.0.linux-amd64.tar.gz
[root@mcw04 prometheus]# mv prometheus-webhook-dingtalk-2.1.0.linux-amd64 webhook_dingtalk
[root@mcw04 prometheus]# cd webhook_dingtalk
[root@mcw04 webhook_dingtalk]# ls
config.example.yml  contrib  LICENSE  prometheus-webhook-dingtalk
[root@mcw04 webhook_dingtalk]#
配置 启动
需要提前新增钉钉群的机器人,所以我们需要参考下面链接,申请机器人
我们下面。alertmanager配置里接收者用的是webhook1,dingtalk程序的配置里,需要配置secret,所以我们将机器人改下。
取消之前的关键字,使用加签,这个secret就是用的这个加签。
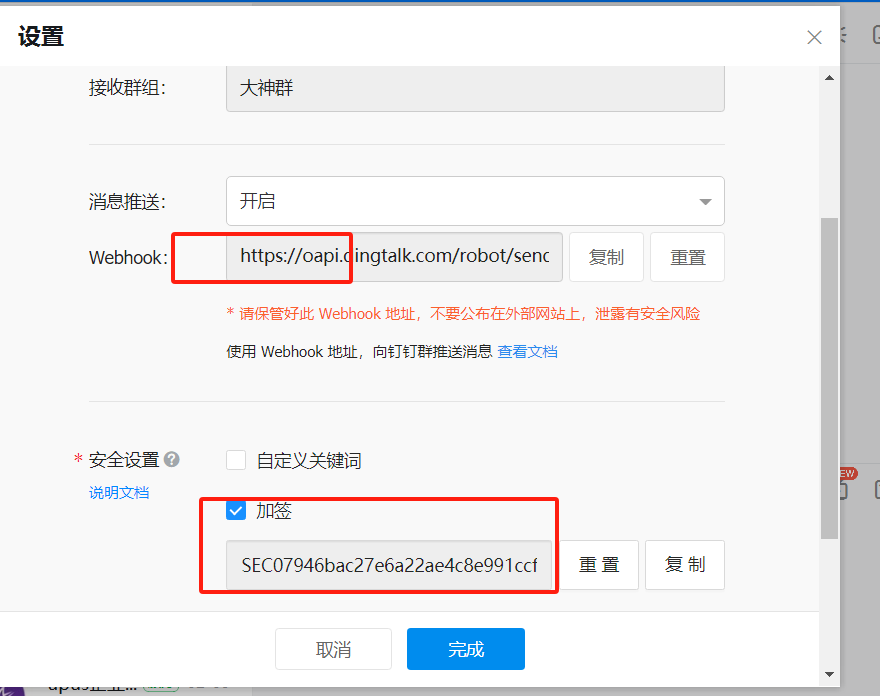
[root@mcw04 webhook_dingtalk]# ls
config.example.yml  contrib  LICENSE  prometheus-webhook-dingtalk
[root@mcw04 webhook_dingtalk]# cp config.example.yml dingtalk.yml
[root@mcw04 webhook_dingtalk]# vim dingtalk.yml
[root@mcw04 webhook_dingtalk]# cat dingtalk.yml
## Request timeout
# timeout: 5s

## Uncomment following line in order to write template from scratch (be careful!)
#no_builtin_template: true

## Customizable templates path
#templates:
#  - contrib/templates/legacy/template.tmpl

## You can also override default template using `default_message`
## The following example to use the 'legacy' template from v0.3.0
#default_message:
#  title: '{{ template "legacy.title" . }}'
#  text: '{{ template "legacy.content" . }}'

## Targets, previously was known as "profiles"
targets:
  webhook1:
    url: https://oapi.dingtalk.com/robot/send?access_token=2f15xxxxa0c
    # secret for signature
    secret: SEC07946bssxxxxx7ac1e3
  webhook2:
    url: https://oapi.dingtalk.com/robot/send?access_token=xxxxxxxxxxxx
  webhook_legacy:
    url: https://oapi.dingtalk.com/robot/send?access_token=xxxxxxxxxxxx
    # Customize template content
    message:
      # Use legacy template
      title: '{{ template "legacy.title" . }}'
      text: '{{ template "legacy.content" . }}'
  webhook_mention_all:
    url: https://oapi.dingtalk.com/robot/send?access_token=xxxxxxxxxxxx
    mention:
      all: true
  webhook_mention_users:
    url: https://oapi.dingtalk.com/robot/send?access_token=xxxxxxxxxxxx
    mention:
      mobiles: ['156xxxx8827', '189xxxx8325']
[root@mcw04 webhook_dingtalk]# cd /usr/lib/systemd/system
[root@mcw04 system]# vim webhook_dingtalk.service
[root@mcw04 system]# cat webhook_dingtalk.service
[Unit]
Description=https://prometheus.io

[Service]
Restart=on-failure
ExecStart=/prometheus/webhook_dingtalk/prometheus-webhook-dingtalk --config.file=/prometheus/webhook_dingtalk/dingtalk.yml --web.listen-address=:8060

[Install]
WantedBy=multi-user.target
[root@mcw04 system]# systemctl daemon-reload
[root@mcw04 system]# systemctl start webhook_dingtalk.service
[root@mcw04 system]# systemctl status webhook_dingtalk.service
● webhook_dingtalk.service - https://prometheus.io
   Loaded: loaded (/usr/lib/systemd/system/webhook_dingtalk.service; disabled; vendor preset: disabled)
   Active: active (running) since Mon 2024-02-12 22:27:00 CST; 7s ago
 Main PID: 32796 (prometheus-webh)
   CGroup: /system.slice/webhook_dingtalk.service
           └─32796 /prometheus/webhook_dingtalk/prometheus-webhook-dingtalk --config.file=/prometheus/webhook_dingtalk/dingtalk.yml --web.listen-address=:8060

Feb 12 22:27:00 mcw04 systemd[1]: Started https://prometheus.io.
Feb 12 22:27:00 mcw04 systemd[1]: Starting https://prometheus.io...
Feb 12 22:27:00 mcw04 prometheus-webhook-dingtalk[32796]: ts=2024-02-12T14:27:00.264Z caller=main.go:59 level=info msg="Starting prometheus-webhook-dingtalk" version="...b3005ab4)"
Feb 12 22:27:00 mcw04 prometheus-webhook-dingtalk[32796]: ts=2024-02-12T14:27:00.264Z caller=main.go:60 level=info msg="Build context" (gogo1.18.1,userroot@177bd003ba4...=(MISSING)
Feb 12 22:27:00 mcw04 prometheus-webhook-dingtalk[32796]: ts=2024-02-12T14:27:00.264Z caller=coordinator.go:83 level=info component=configuration file=/prometheus/webh...tion file"
Feb 12 22:27:00 mcw04 prometheus-webhook-dingtalk[32796]: ts=2024-02-12T14:27:00.265Z caller=coordinator.go:91 level=info component=configuration file=/prometheus/webh...tion file"
Feb 12 22:27:00 mcw04 prometheus-webhook-dingtalk[32796]: ts=2024-02-12T14:27:00.265Z caller=main.go:97 level=info component=configuration msg="Loading templates" templates=
Feb 12 22:27:00 mcw04 prometheus-webhook-dingtalk[32796]: ts=2024-02-12T14:27:00.266Z caller=main.go:113 component=configuration msg="Webhook urls for prometheus alertmanager" u...
Feb 12 22:27:00 mcw04 prometheus-webhook-dingtalk[32796]: ts=2024-02-12T14:27:00.267Z caller=web.go:208 level=info component=web msg="Start listening for connections" address=:8060
Hint: Some lines were ellipsized, use -l to show in full.
[root@mcw04 system]# systemctl enable webhook_dingtalk.service
Created symlink from /etc/systemd/system/multi-user.target.wants/webhook_dingtalk.service to /usr/lib/systemd/system/webhook_dingtalk.service.
[root@mcw04 system]#
记下 urls=http://localhost:8060/dingtalk/webhook_robot/send 这一段值
http://10.0.0.14:8060/dingtalk/webhook1/send
修改之前配置
[root@mcw04 system]# ls /etc/alertmanager/alertmanager.yml
/etc/alertmanager/alertmanager.yml
[root@mcw04 system]# cat /etc/alertmanager/alertmanager.yml
global:
  smtp_smarthost: 'smtp.163.com:465'
  smtp_from: '13xx2@163.com'
  smtp_auth_username: '13xx2@163.com'
  smtp_auth_password: 'EHxxNW'
  smtp_require_tls: false

templates:
  - '/etc/alertmanager/template/*.tmpl'

route:
  group_by: ['instance','cluster']
  group_wait: 30s
  group_interval: 5m
  repeat_interval: 3h
  receiver: email
  routes:
  - match:
      severity: critical
    receiver: pager
    #routes:
    #- match:
    #    service: machangweiapp
    #  receiver: support_team
  - match_re:
      serverity: ^(warning|critical)$
    receiver: support_team

receivers:
  - name: 'email'
    email_configs:
      - to: '8xx5@qq.com'
  - name: 'support_team'
    email_configs:
      - to: '8xx5@qq.com'
  - name: 'pager'
    email_configs:
      - to: '13xx2@163.com'
    slack_configs:
      - api_url: https://oapi.dingtalk.com/robot/send?access_token=2f153x1a0c
        #channel: #monitoring
        text: 'mcw {{ .CommonAnnotations.summary }}'
[root@mcw04 system]#
修改之后:
修改的地方是:
路由添加了下面标签匹配到的就发往dingtalk接收者
  - match:
      severity: critical
    receiver: dingtalk
接收者下面新增了dingtalk配置。访问地址,就是dingtalk运行的机器和端口,需要修改的地方就是指定用dingtalk下的定义的那个webhook名称,我们这里用的是webhook1
  - name: 'dingtalk'
    webhook_configs:
      - url: http://10.0.0.14:8060/dingtalk/webhook1/send
        send_resolved: true
[root@mcw04 system]# cat /etc/alertmanager/alertmanager.yml
global:
  smtp_smarthost: 'smtp.163.com:465'
  smtp_from: '13xx2@163.com'
  smtp_auth_username: '13xx2@163.com'
  smtp_auth_password: 'ExxNW'
  smtp_require_tls: false

templates:
  - '/etc/alertmanager/template/*.tmpl'

route:
  group_by: ['instance','cluster']
  group_wait: 30s
  group_interval: 5m
  repeat_interval: 3h
  receiver: email
  routes:
  - match:
      severity: critical
    receiver: dingtalk
  - match:
      severity: critical
    receiver: pager
    #routes:
    #- match:
    #    service: machangweiapp
    #  receiver: support_team
  - match_re:
      serverity: ^(warning|critical)$
    receiver: support_team

receivers:
  - name: 'email'
    email_configs:
      - to: '8xx5@qq.com'
  - name: 'support_team'
    email_configs:
      - to: '8xx5@qq.com'
  - name: 'pager'
    email_configs:
      - to: '13xxx32@163.com'
  - name: 'dingtalk'
    webhook_configs:
      - url: http://10.0.0.14:8060/dingtalk/webhook1/send
        send_resolved: true
[root@mcw04 system]# systemctl restart alertmanager.service
[root@mcw04 system]#
重启一下,这个带有标签是critiacal的服务。这样就能触发告警
[root@mcw02 ~]# systemctl start rsyslog.service
[root@mcw02 ~]# systemctl stop rsyslog.service
[root@mcw02 ~]#
触发的是这条告警规则
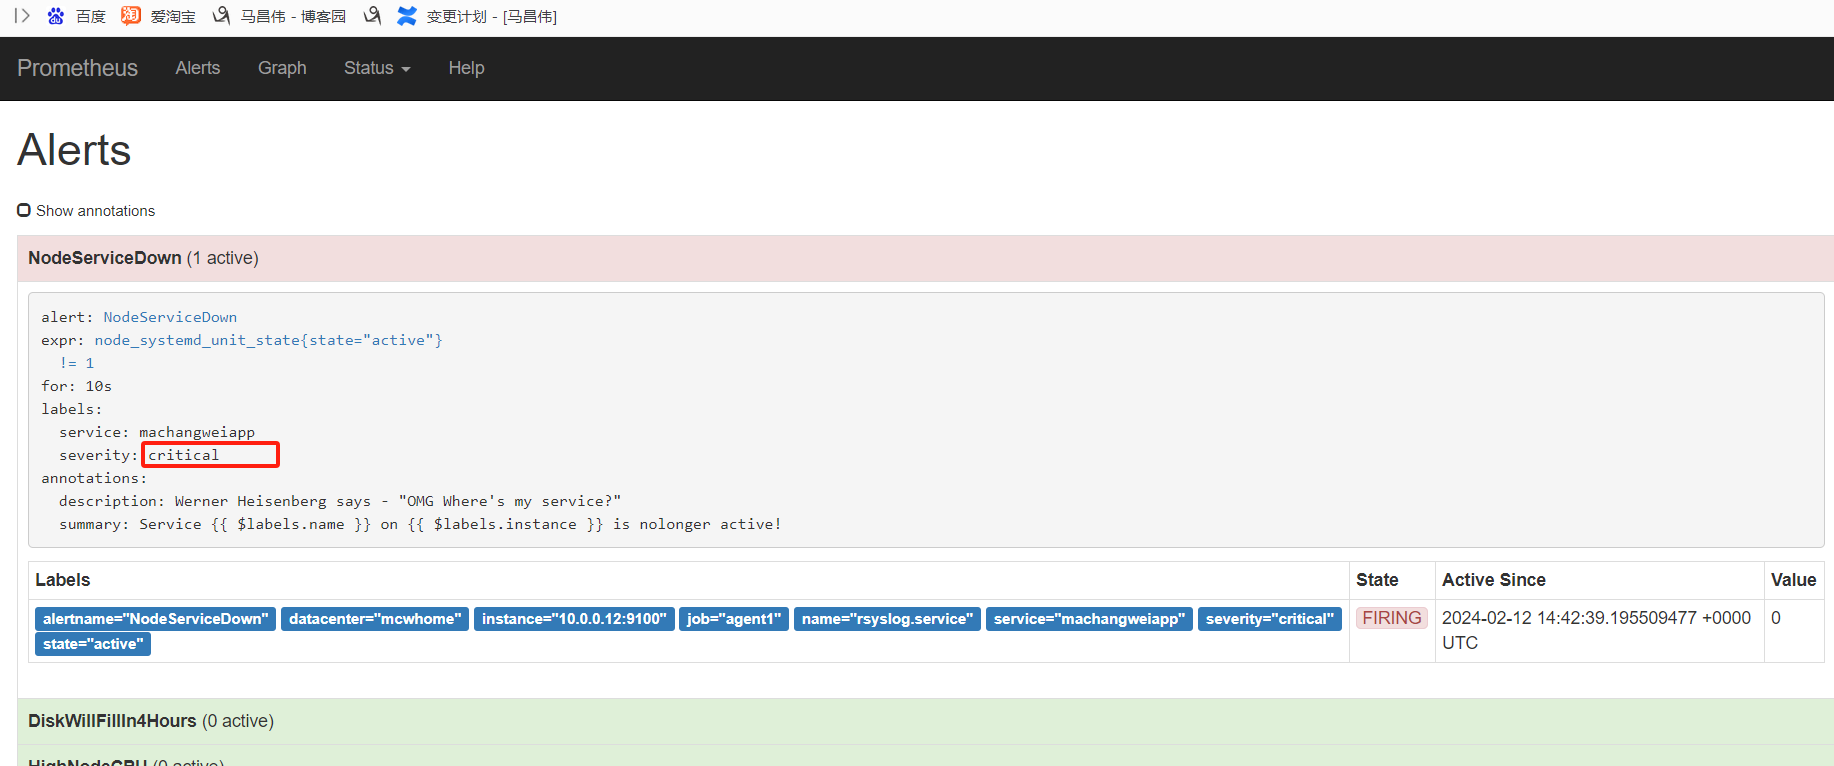
这里显示,是dingtalk
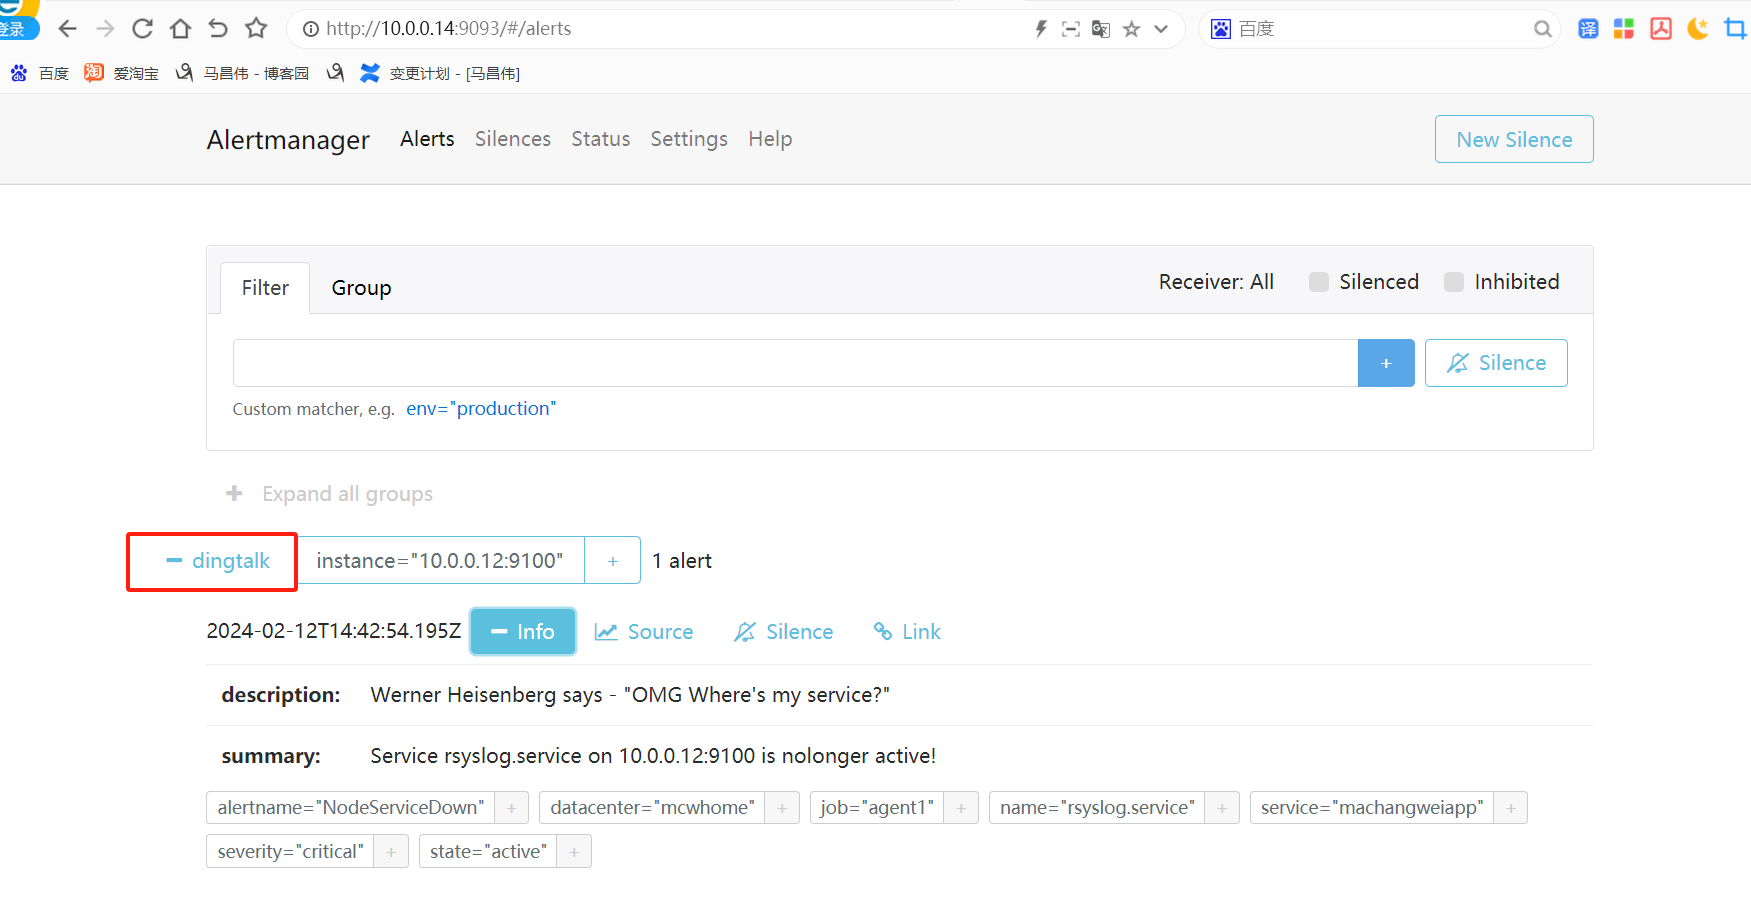
我们可以看到,我们的机器人已经发送了告警信息,在钉钉群里面
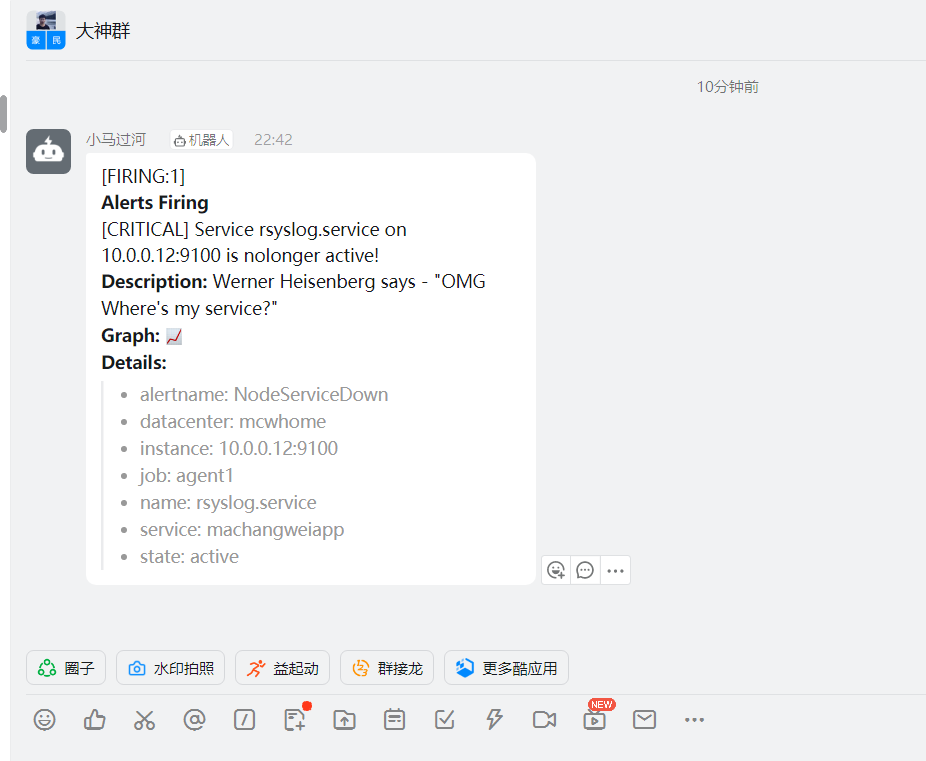
邮件通知模板
5.1.1、案例需求
默认的告警信息有些太简单,我们可以借助于告警的模板信息,对告警的信息进行丰富增加。我们需要借助于alertmanager的模板功能来实现。
5.1.2、使用流程
1、分析关键信息
2、定制模板内容
3、prometheus加载模板文件
4、告警信息使用模板内容属性
5.2、定制邮件模板
5.2.1、编写邮件模板

mkdir /data/server/alertmanager/email_template && cd /data/server/alertmanager/email_template
cat >email.tmpl<<'EOF'
{{ define "test.html" }}
<table border="1">
<thead>
        <th>告警级别</th>
        <th>告警类型</th>
        <th>故障主机</th>
        <th>告警主题</th>
        <th>告警详情</th>
        <th>触发时间</th>
</thead>
<tbody>
{{ range $i, $alert := .Alerts }}
        <tr>
                <td>{{ index $alert.Labels.severity }}</td>
                <td>{{ index $alert.Labels.alertname }}</td>
                <td>{{ index $alert.Labels.instance }}</td>
                <td>{{ index $alert.Annotations.summary }}</td>
                <td>{{ index $alert.Annotations.description }}</td>
                <td>{{ $alert.StartsAt }}</td>
        </tr>
{{ end }}
</tbody>
</table>
{{ end }}
EOF

属性解析:
{{ define "test.html" }} 表示定义了一个 test.html 模板文件,通过该名称在配置文件中应用。
此模板文件就是使用了大量的ajax模板语言。
$alert.xxx 其实是从默认的告警信息中提取出来的重要信息。
@@@
[root@mcw04 system]# cat /etc/alertmanager/alertmanager.yml
global:
  smtp_smarthost: 'smtp.163.com:465'
  smtp_from: '13582215632@163.com'
  smtp_auth_username: '13582215632@163.com'
  smtp_auth_password: 'EHUKIEHDQJCSSRNW'
  smtp_require_tls: false

templates:
  - '/etc/alertmanager/template/*.tmpl'

route:
  group_by: ['instance','cluster']
[root@mcw04 system]# ls /etc/alertmanager/template/
[root@mcw04 system]# cd /etc/alertmanager/template/
[root@mcw04 template]# cat >email.tmpl<<'EOF'
> {{ define "test.html" }}
> <table border="1">
> <thead>
>         <th>告警级别</th>
>         <th>告警类型</th>
>         <th>故障主机</th>
>         <th>告警主题</th>
>         <th>告警详情</th>
>         <th>触发时间</th>
> </thead>
> <tbody>
> {{ range $i, $alert := .Alerts }}
>         <tr>
>                 <td>{{ index $alert.Labels.severity }}</td>
>                 <td>{{ index $alert.Labels.alertname }}</td>
>                 <td>{{ index $alert.Labels.instance }}</td>
>                 <td>{{ index $alert.Annotations.summary }}</td>
>                 <td>{{ index $alert.Annotations.description }}</td>
>                 <td>{{ $alert.StartsAt }}</td>
>         </tr>
> {{ end }}
> </tbody>
> </table>
> {{ end }}
> EOF
[root@mcw04 template]# ls
email.tmpl
[root@mcw04 template]# cat email.tmpl
{{ define "test.html" }}
<table border="1">
<thead>
        <th>告警级别</th>
        <th>告警类型</th>
        <th>故障主机</th>
        <th>告警主题</th>
        <th>告警详情</th>
        <th>触发时间</th>
</thead>
<tbody>
{{ range $i, $alert := .Alerts }}
        <tr>
                <td>{{ index $alert.Labels.severity }}</td>
                <td>{{ index $alert.Labels.alertname }}</td>
                <td>{{ index $alert.Labels.instance }}</td>
                <td>{{ index $alert.Annotations.summary }}</td>
                <td>{{ index $alert.Annotations.description }}</td>
                <td>{{ $alert.StartsAt }}</td>
        </tr>
{{ end }}
</tbody>
</table>
{{ end }}
[root@mcw04 template]#
5.2.2、修改alertmanager.yml【即应用邮件模板】
]# vi /data/server/alertmanager/etc/alertmanager.yml
# 全局配置【配置告警邮件地址】
global:
  resolve_timeout: 5m
  smtp_smarthost: 'smtp.126.com:25'
  smtp_from: '**ygbh@126.com'
  smtp_auth_username: 'pyygbh@126.com'
  smtp_auth_password: 'BXDVLEAJEH******'
  smtp_hello: '126.com'
  smtp_require_tls: false

# 模板配置
templates:
  - '../email_template/*.tmpl'

# 路由配置
route:
  group_by: ['alertname', 'cluster']
  group_wait: 10s
  group_interval: 10s
  repeat_interval: 120s
  receiver: 'email'

# 收信人员
receivers:
- name: 'email'
  email_configs:
  - to: '277667028@qq.com'
    send_resolved: true
    html: '{{ template "test.html" . }}'
    headers: { Subject: "[WARN] 报警邮件" }

# 规则主动失效措施,如果不想用的话可以取消掉
inhibit_rules:
  - source_match:
      severity: 'critical'
    target_match:
      severity: 'warning'
    equal: ['alertname', 'dev', 'instance']


属性解析:
{{}} 属性用于加载其它信息,所以应该使用单引号括住
{} 不需要使用单引号,否则服务启动不成功
@@@
把标签包含critical 的告警,路由到钉钉的注释掉,让它路由到pager,pager发送到163邮箱,添加下面三个配置,让它用这个我们创建的配置。我们上面是定义了
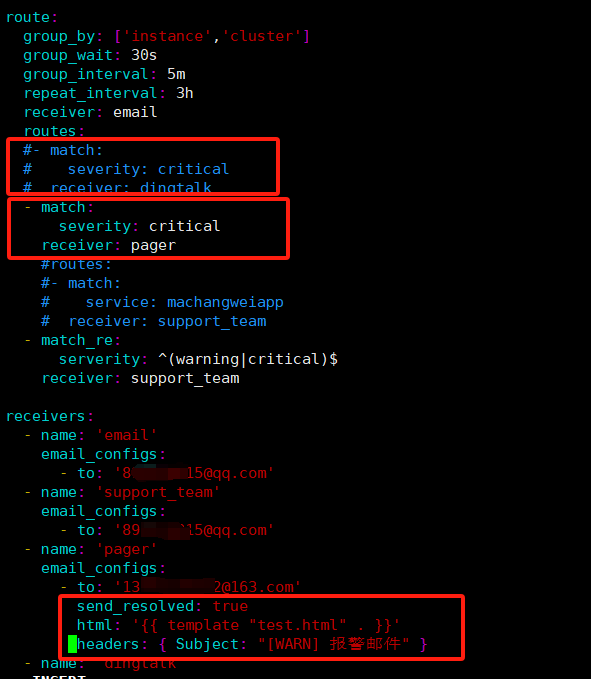
如何找到test.html。因为这个配置文件里面定义了模板的路径。那么新增这个模板是匹配到的,是可以作为模板识别出来的,里面又定义了这个模板的名称是test.html。所以发送消息的时候用这个模板渲染生成页面
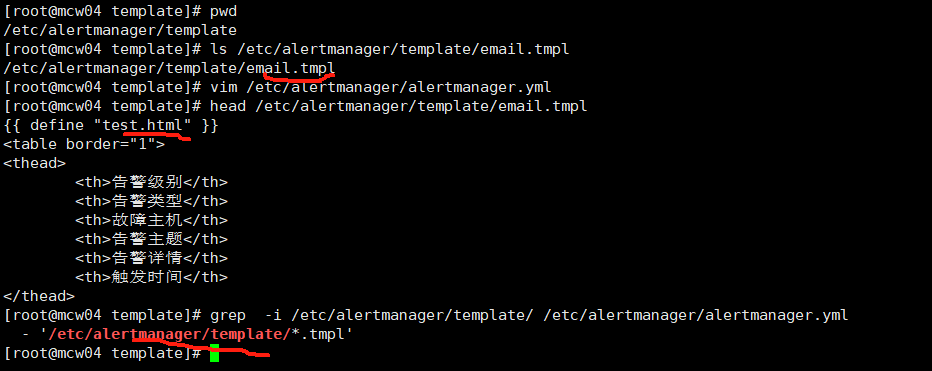
5.2.3、检查语法是否正常
命令在alertmanager的tar解压包里
]# amtool check-config /data/server/alertmanager/etc/alertmanager.yml
Checking '/data/server/alertmanager/etc/alertmanager.yml'  SUCCESS
Found:
 - global config
 - route
 - 1 inhibit rules
 - 1 receivers
 - 1 templates
  SUCCESS
[root@mcw04 template]#  /tmp/alertmanager-0.26.0.linux-amd64/amtool check-config /etc/alertmanager/alertmanager.yml
Checking '/etc/alertmanager/alertmanager.yml'  SUCCESS
Found:
 - global config
 - route
 - 0 inhibit rules
 - 4 receivers
 - 1 templates
  SUCCESS

[root@mcw04 template]#
5.2.4、重启alertmanager服务
systemctl restart alertmanager
重启完之后,已经触发并发送了告警通知
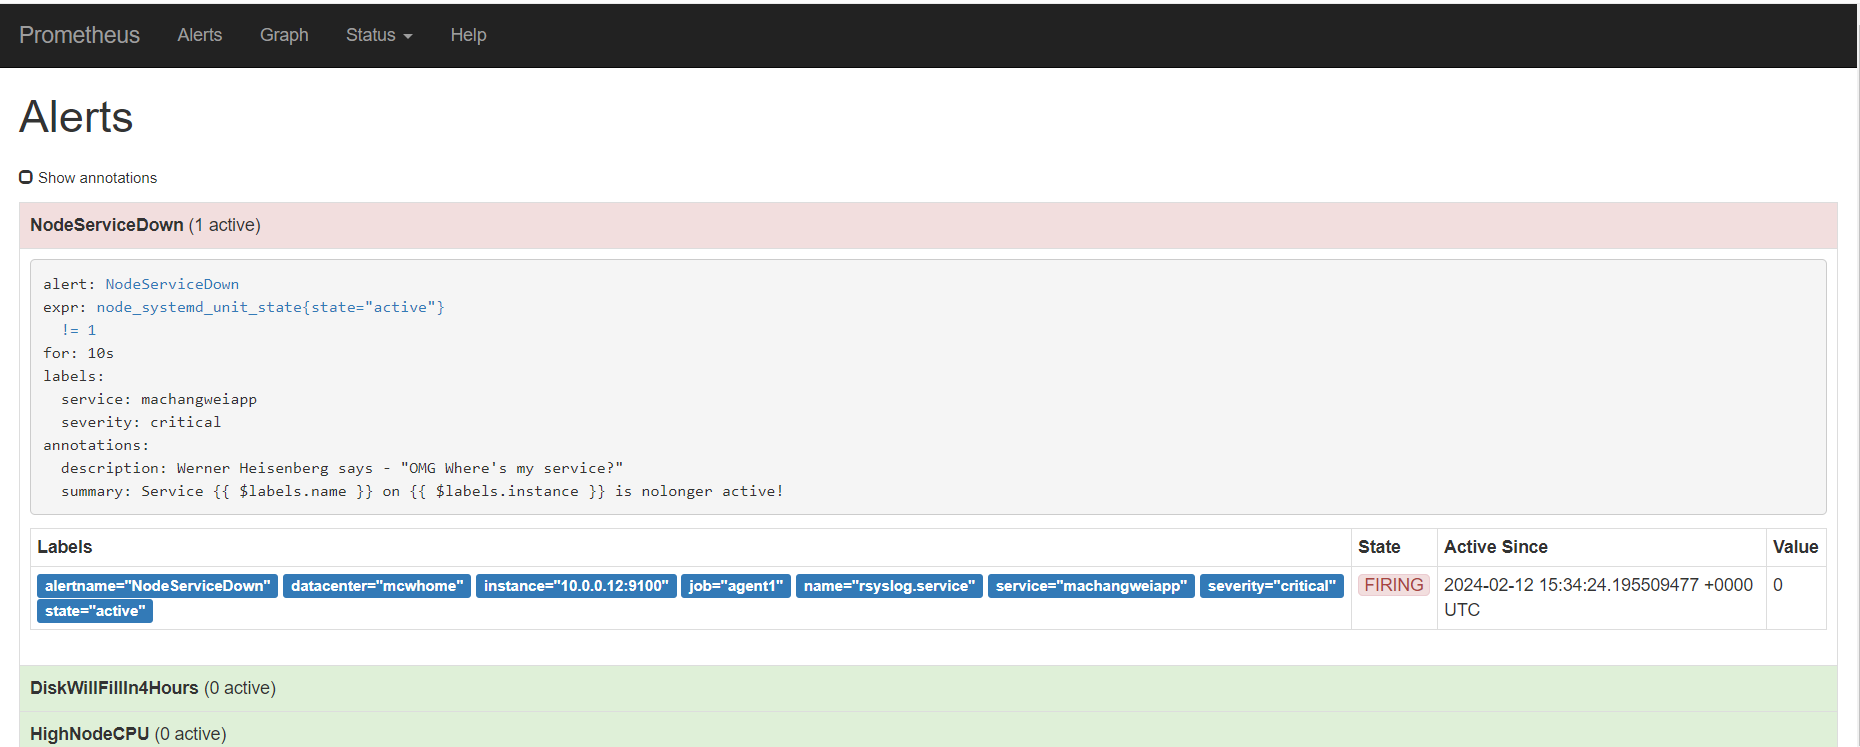
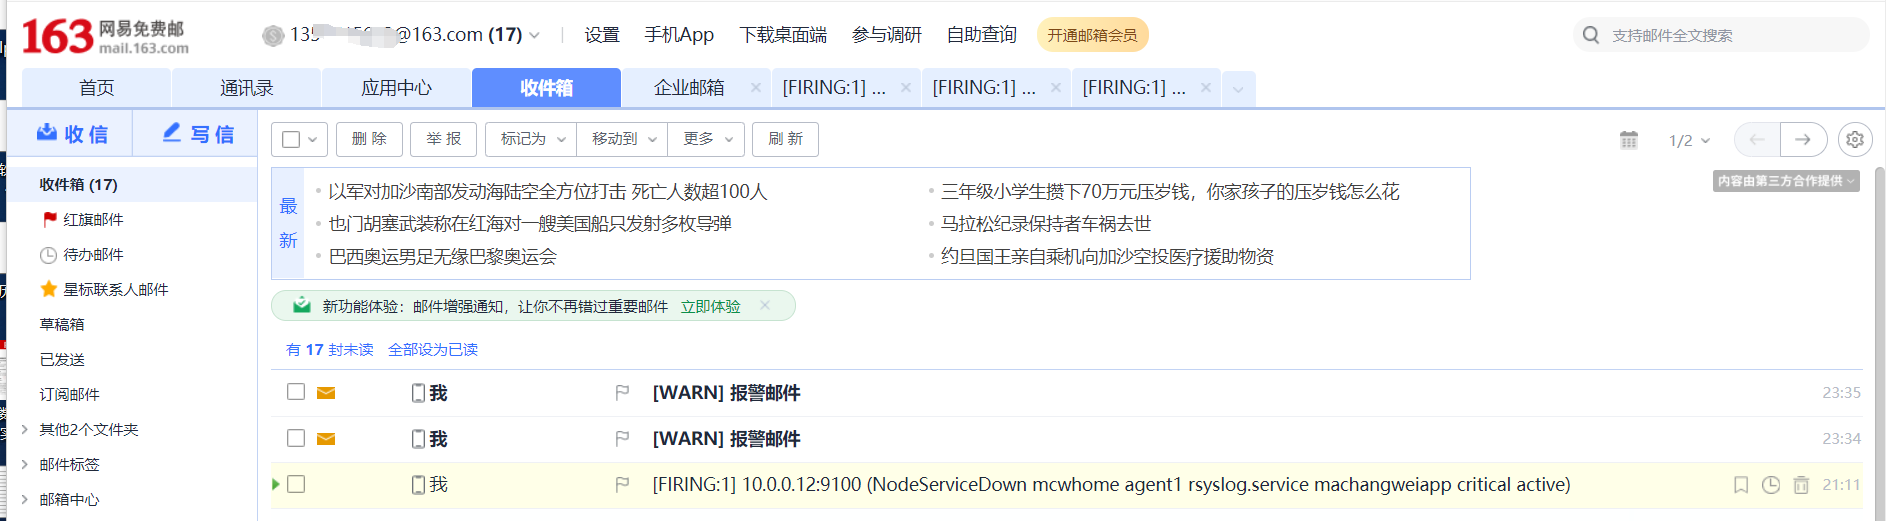
可以看到告警信息
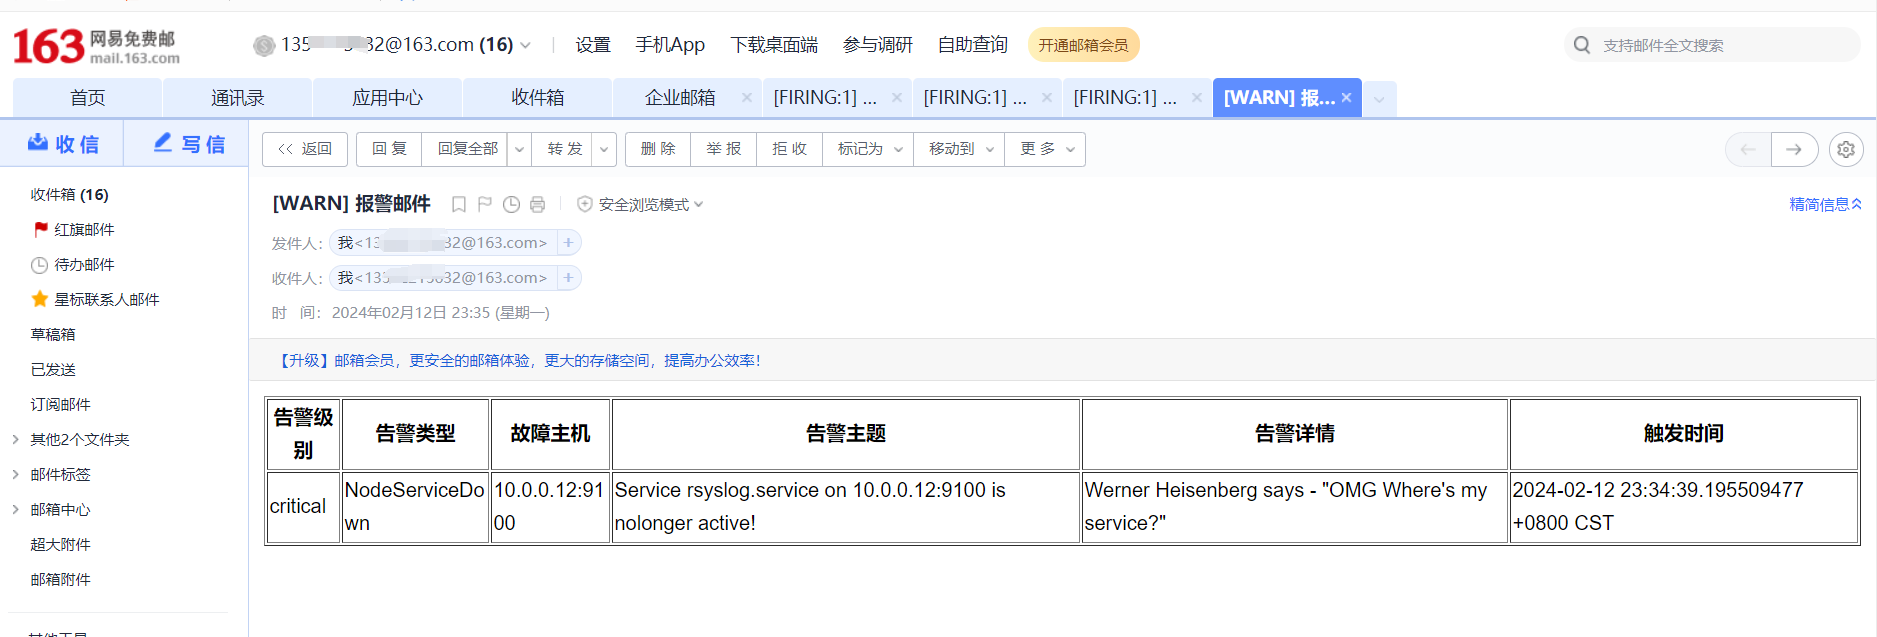
从alert变量里面获取的生成的数据,从alfert下的标签注解里面获取对应的内容
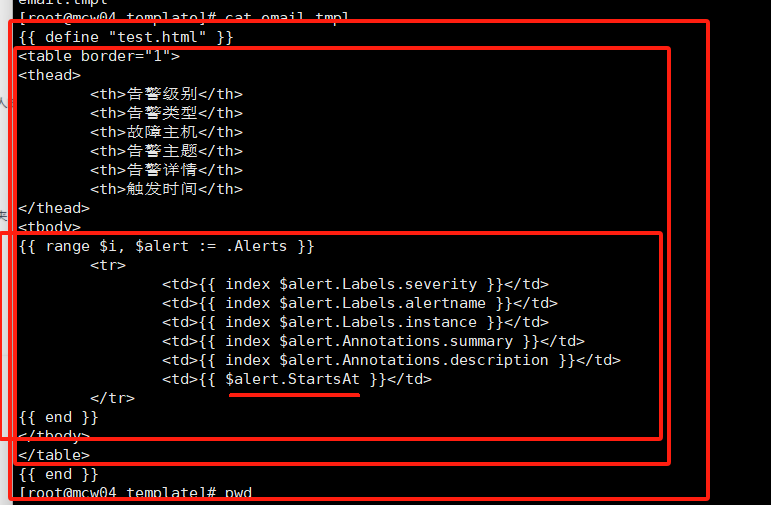
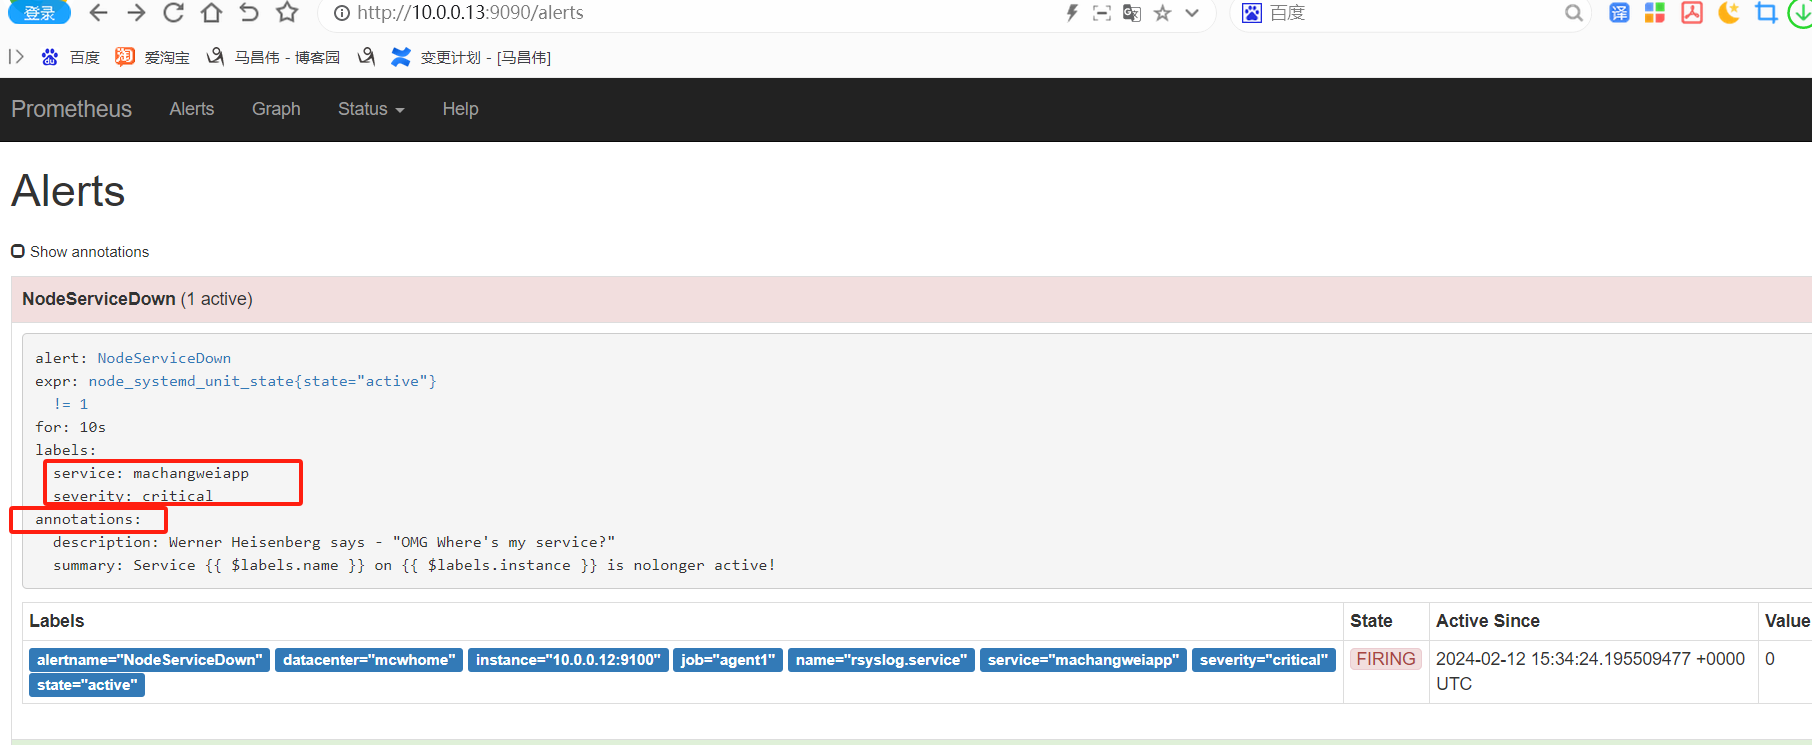
钉钉通知模板
创建模板文件
[root@mcw04 template]# cat /etc/alertmanager/template/default.tmpl
{{ define "default.tmpl" }}

{{- if gt (len .Alerts.Firing) 0 -}}
{{- range $index, $alert := .Alerts -}}

============ = **<font color='#FF0000'>告警</font>** = =============  #红色字体

**告警名称:**    {{ $alert.Labels.alertname }}
**告警级别:**    {{ $alert.Labels.severity }} 级
**告警状态:**    {{ .Status }}
**告警实例:**    {{ $alert.Labels.instance }} {{ $alert.Labels.device }}
**告警概要:**    {{ .Annotations.summary }}
**告警详情:**    {{ $alert.Annotations.message }}{{ $alert.Annotations.description}}
**故障时间:**    {{ ($alert.StartsAt.Add 28800e9).Format "2006-01-02 15:04:05" }}
============ = end = =============
{{- end }}
{{- end }}

{{- if gt (len .Alerts.Resolved) 0 -}}
{{- range $index, $alert := .Alerts -}}

============ = <font color='#00FF00'>恢复</font> = =============   #绿色字体

**告警实例:**    {{ .Labels.instance }}
**告警名称:**    {{ .Labels.alertname }}
**告警级别:**    {{ $alert.Labels.severity }} 级
**告警状态:**    {{   .Status }}
**告警概要:**    {{ $alert.Annotations.summary }}
**告警详情:**    {{ $alert.Annotations.message }}{{ $alert.Annotations.description}}
**故障时间:**    {{ ($alert.StartsAt.Add 28800e9).Format "2006-01-02 15:04:05" }}
**恢复时间:**    {{ ($alert.EndsAt.Add 28800e9).Format "2006-01-02 15:04:05" }}

============ = **end** = =============
{{- end }}
{{- end }}
{{- end }}
[root@mcw04 template]#
新增配置指定模板,并且webhook中使用模板
[root@mcw04 template]# ps -ef|grep ding
root      34609      1  0 00:26 ?        00:00:00 /prometheus/webhook_dingtalk/prometheus-webhook-dingtalk --config.file=/prometheus/webhook_dingtalk/dingtalk.yml --web.listen-address=:8060
root      34747   2038  0 00:34 pts/0    00:00:00 grep --color=auto ding
[root@mcw04 template]# cat /prometheus/webhook_dingtalk/dingtalk.yml
## Request timeout
# timeout: 5s

## Uncomment following line in order to write template from scratch (be careful!)
#no_builtin_template: true

## Customizable templates path
#templates:
#  - contrib/templates/legacy/template.tmpl

## You can also override default template using `default_message`
## The following example to use the 'legacy' template from v0.3.0
#default_message:
#  title: '{{ template "legacy.title" . }}'
#  text: '{{ template "legacy.content" . }}'

## Targets, previously was known as "profiles"
templates:
  - /etc/alertmanager/template/default.tmpl

targets:
  webhook1:
    url: https://oapi.dingtalk.com/robot/send?access_token=2f1532xx1a0c
    # secret for signature
    secret: SEC079xxac1e3
    message:
      text: '{{ template "default.tmpl" . }}'
重启服务
[root@mcw04 template]# systemctl restart webhook_dingtalk.service
恢复alertmanager配置
  routes:
  - match:
      severity: critical
    receiver: dingtalk


  - name: 'dingtalk'
    webhook_configs:
      - url: http://10.0.0.14:8060/dingtalk/webhook1/send
        send_resolved: true
完整配置如下
[root@mcw04 template]# cat /etc/alertmanager/alertmanager.yml
global:
  smtp_smarthost: 'smtp.163.com:465'
  smtp_from: '135xx32@163.com'
  smtp_auth_username: '13xx2@163.com'
  smtp_auth_password: 'EHUKxxSRNW'
  smtp_require_tls: false

templates:
  - '/etc/alertmanager/template/*.tmpl'

route:
  group_by: ['instance','cluster']
  group_wait: 30s
  group_interval: 5m
  repeat_interval: 3h
  receiver: email
  routes:
  - match:
      severity: critical
    receiver: dingtalk
  - match:
      severity: critical
    receiver: pager
    #routes:
    #- match:
    #    service: machangweiapp
    #  receiver: support_team
  - match_re:
      serverity: ^(warning|critical)$
    receiver: support_team

receivers:
  - name: 'email'
    email_configs:
      - to: '8xx5@qq.com'
  - name: 'support_team'
    email_configs:
      - to: '8xxx5@qq.com'
  - name: 'pager'
    email_configs:
      - to: '1xx2@163.com'
        send_resolved: true
        html: '{{ template "test.html" . }}'
        headers: { Subject: "[WARN] 报警邮件" }
  - name: 'dingtalk'
    webhook_configs:
      - url: http://10.0.0.14:8060/dingtalk/webhook1/send
        send_resolved: true
[root@mcw04 template]#
停止以及开启这个服务,触发这个告警规则
[root@mcw02 ~]# systemctl start rsyslog.service
[root@mcw02 ~]# systemctl stop rsyslog.service
[root@mcw02 ~]#
触发的告警规则如下
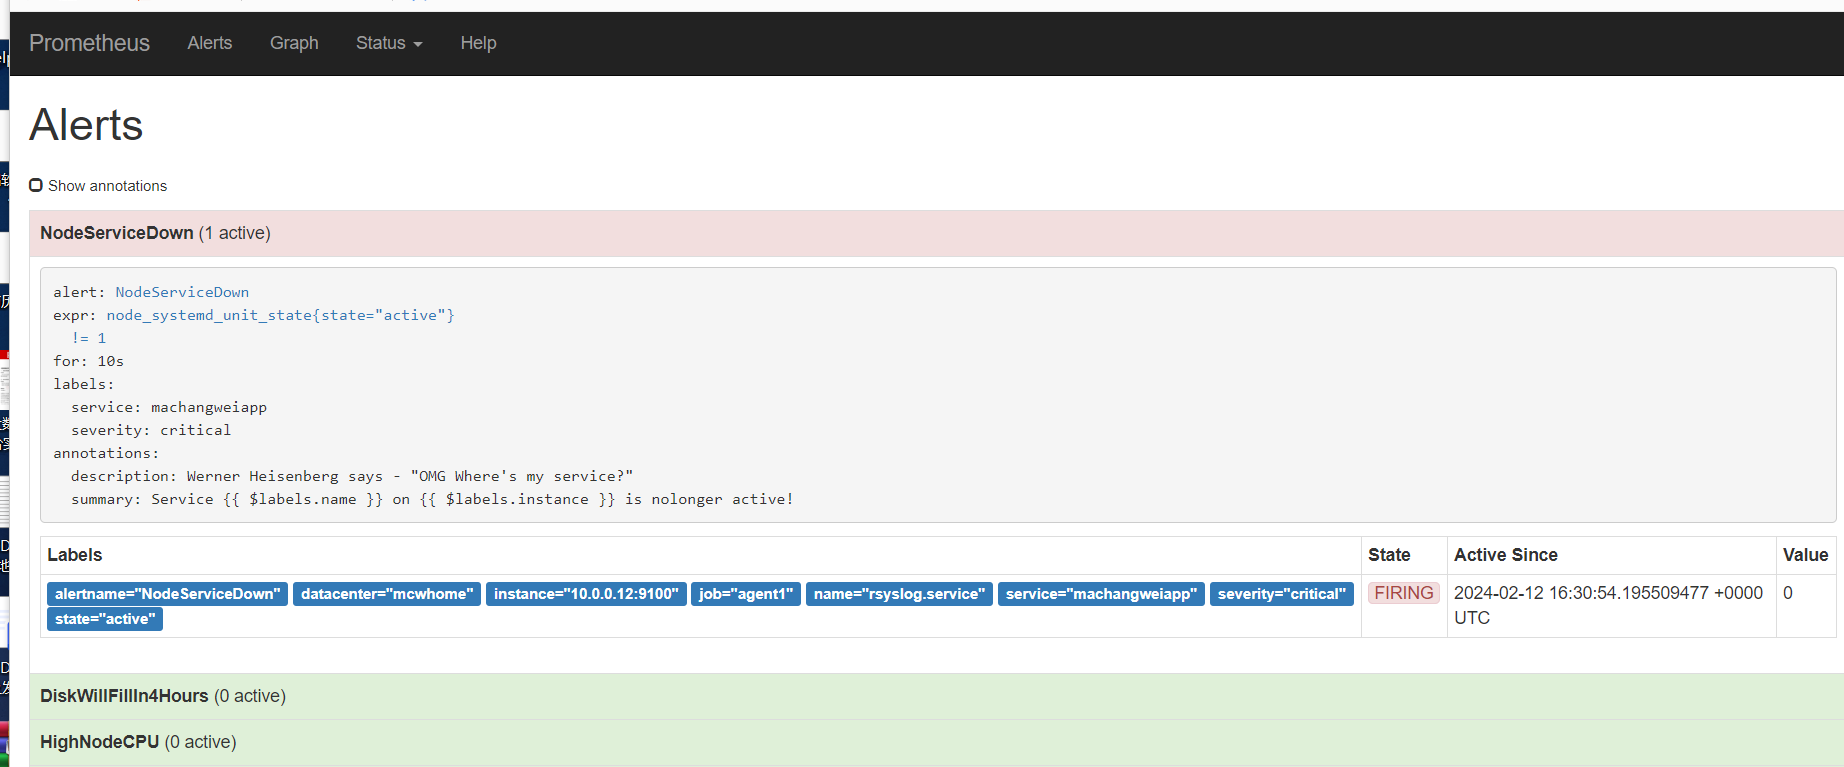
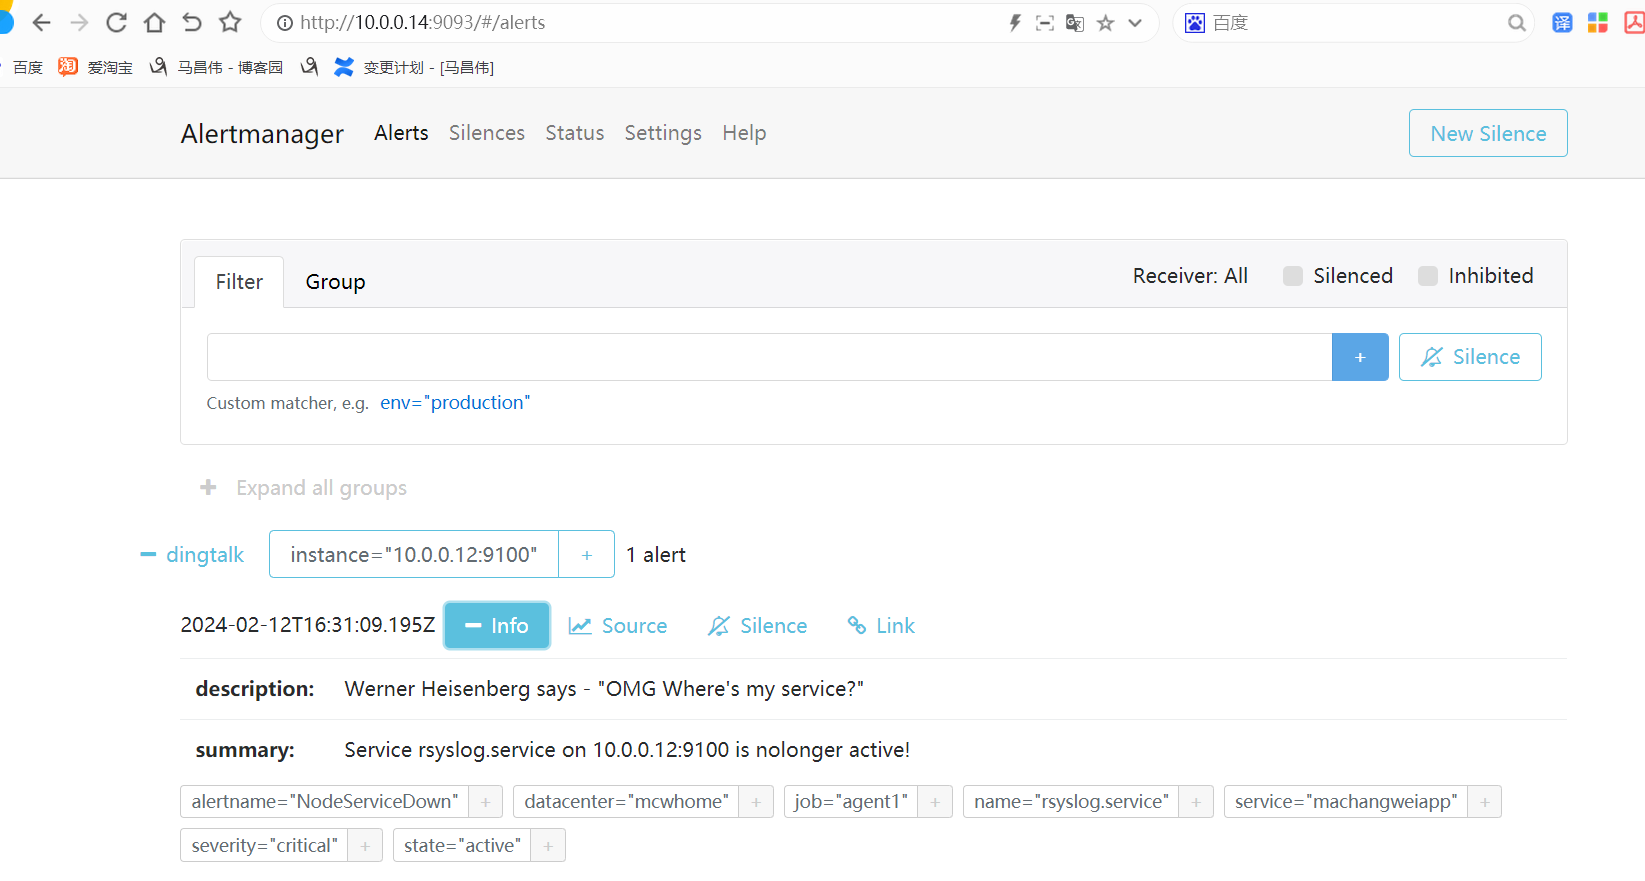
告警效果如下,当产生告警时,用这个模板发送了告警,当告警恢复时,也发送了告警消息。就是消息有很大的延迟,感觉。告警消息很久才能显示在群里,恢复通知也很久才发出来,不知道是不是哪里时间设置有延迟问题还是就是这样慢
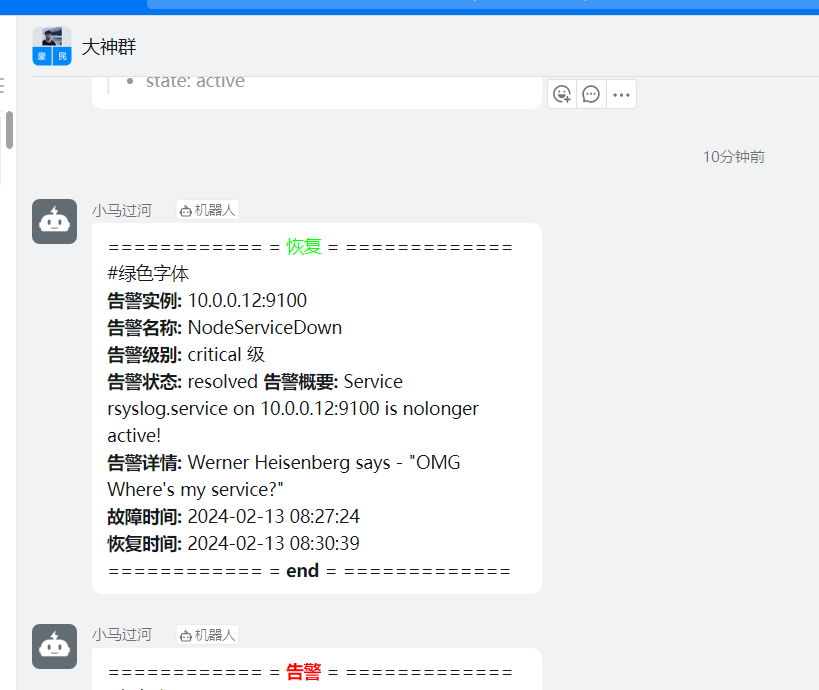
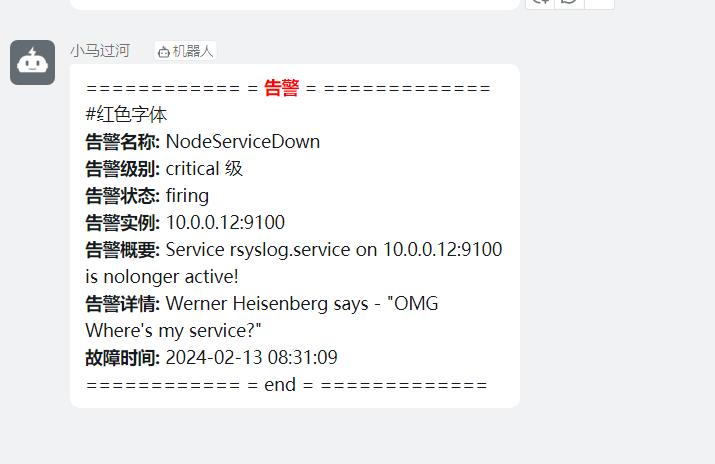
silence和维护
通过alertmanager控制silence
把匹配critical发给钉钉的注释掉,让它走下面的pager,也就是163邮箱
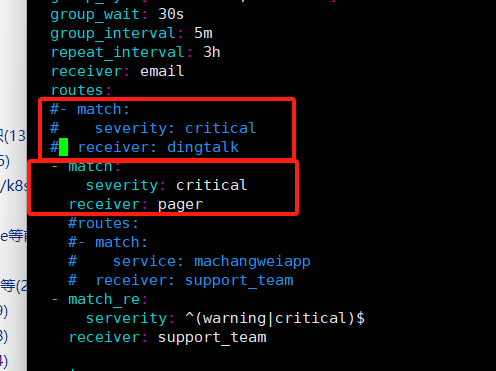
重启服务
[root@mcw04 template]# systemctl restart alertmanager.service
停止服务,触发下面的警报规则
[root@mcw02 ~]# systemctl stop rsyslog.service
[root@mcw02 ~]#
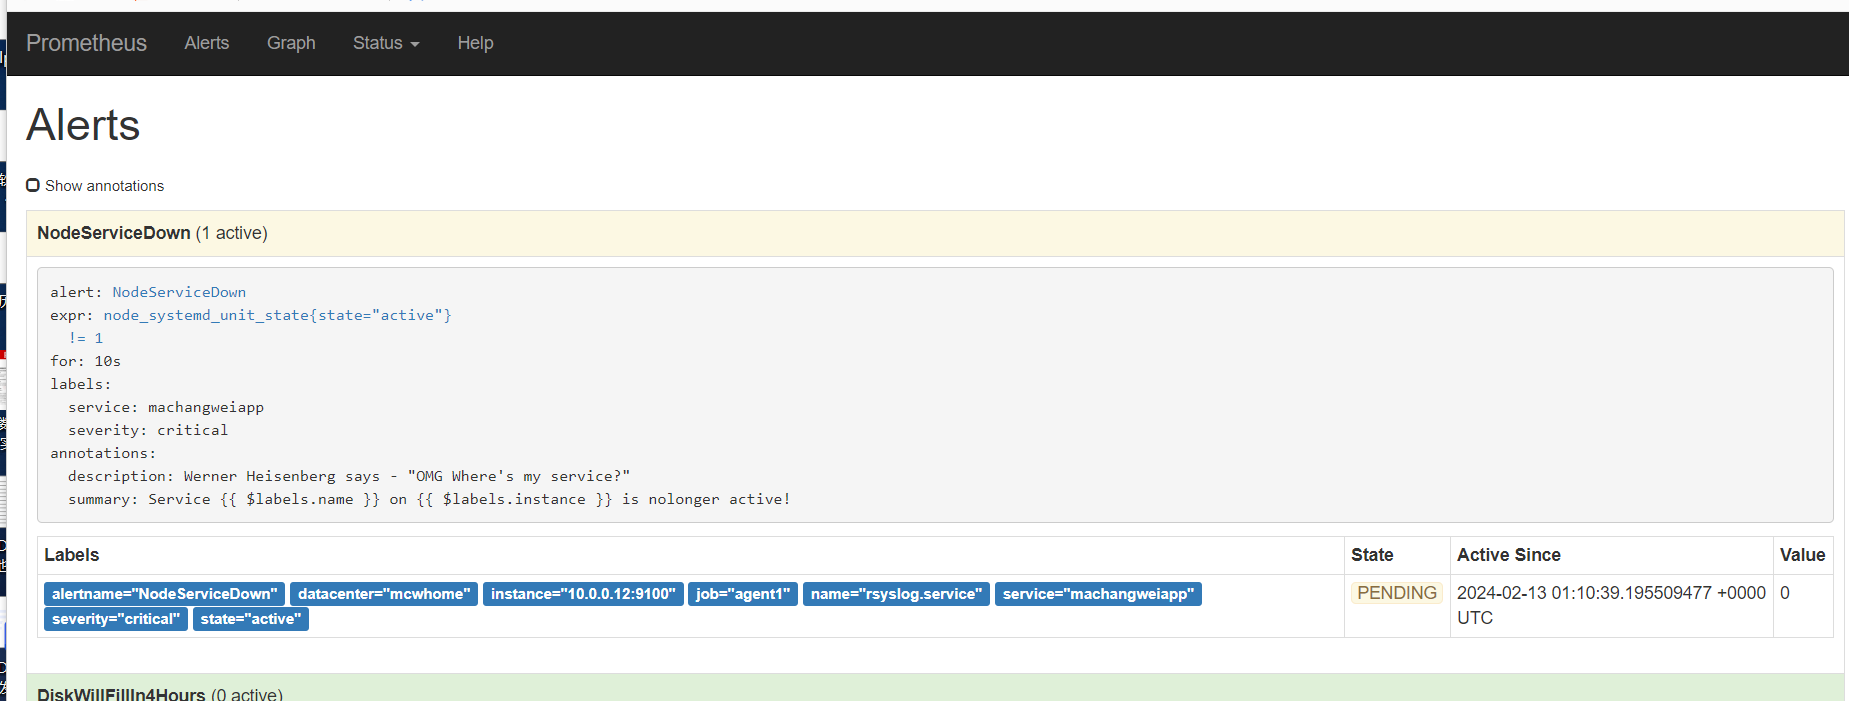
通知已经发送
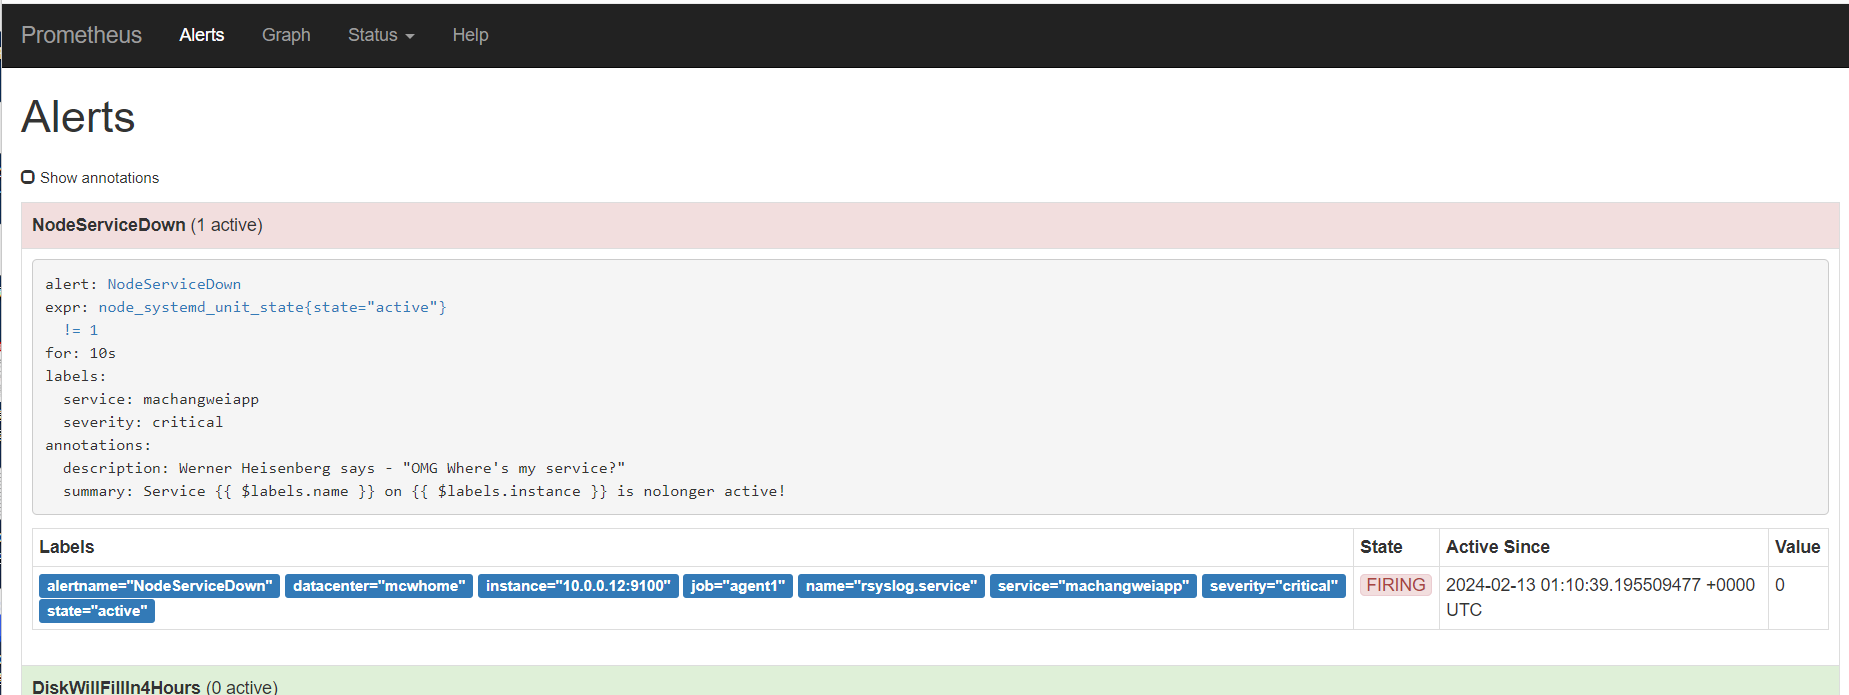
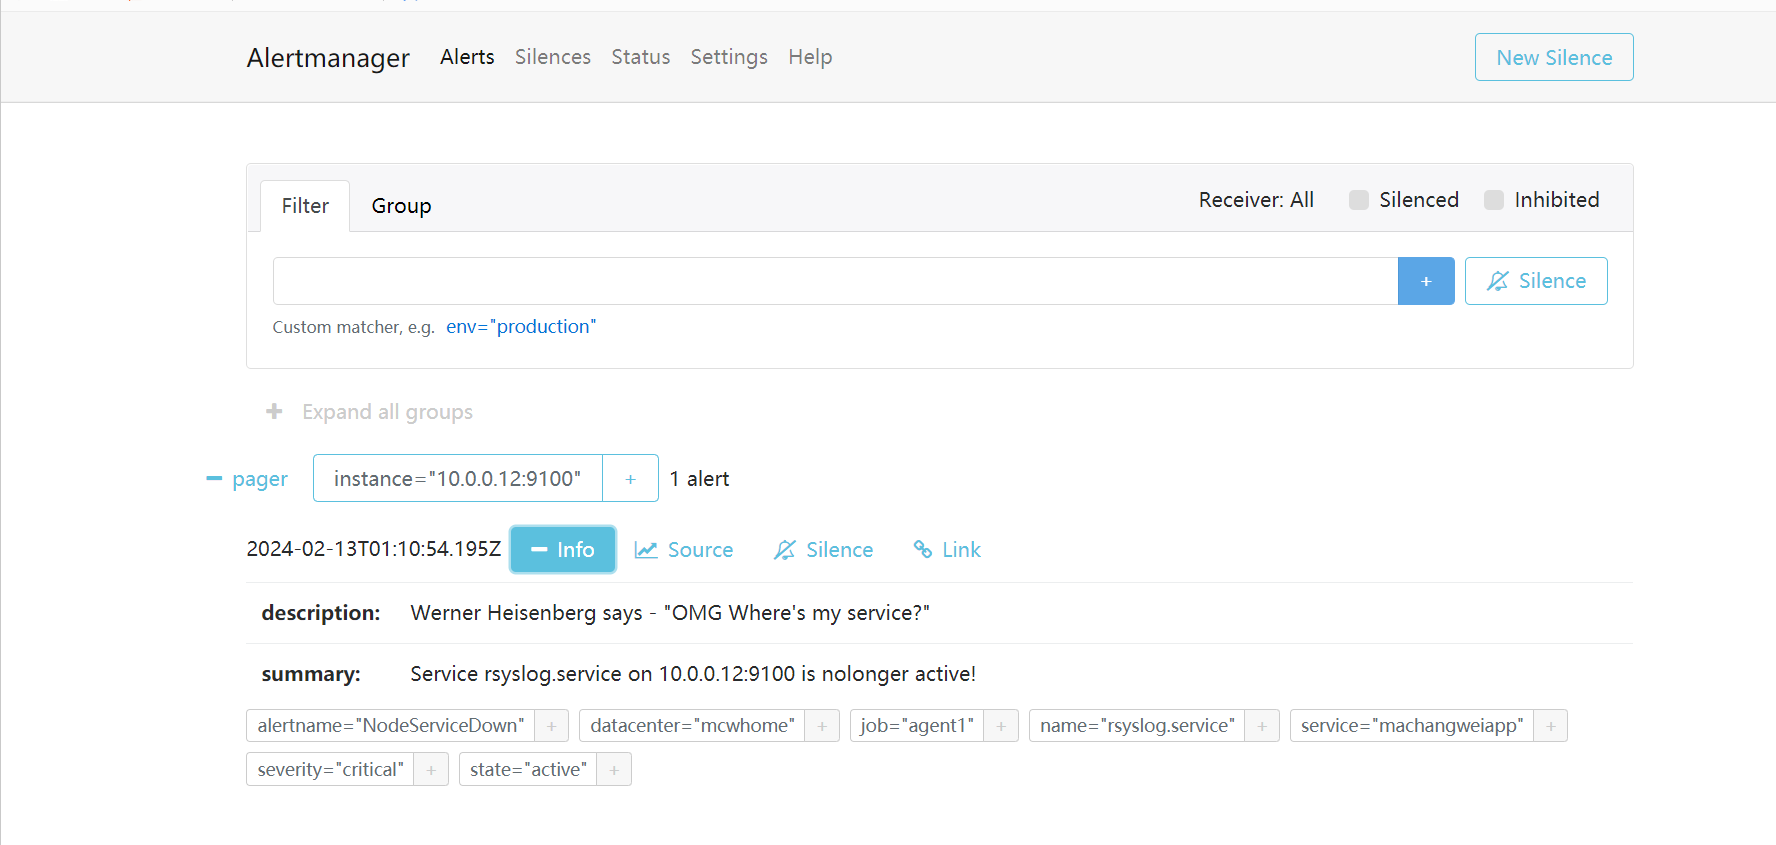
可以看到这个,已经发送告警通知了
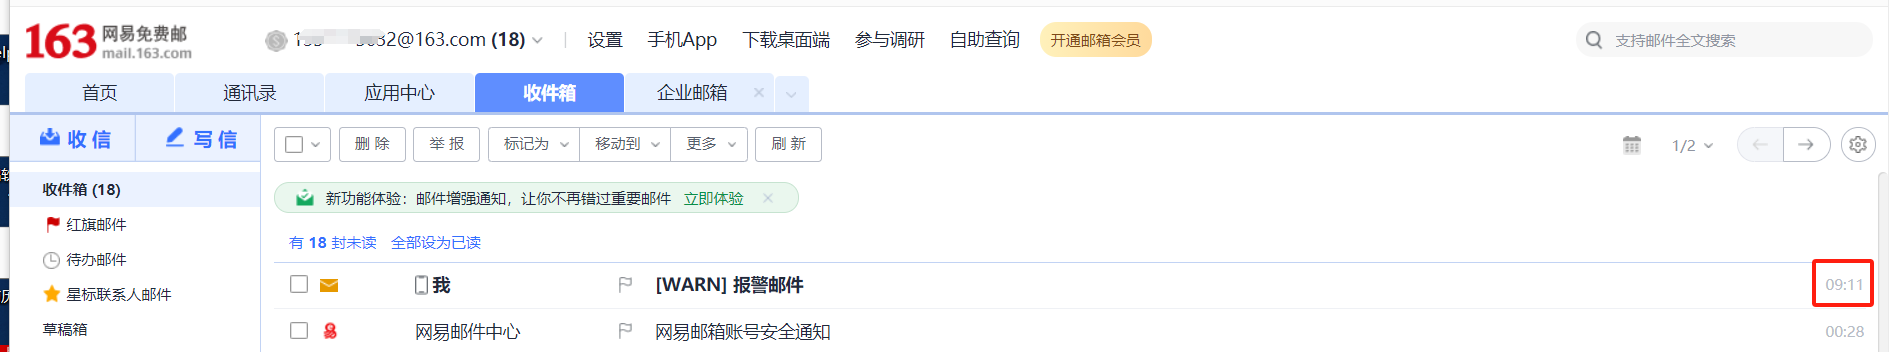
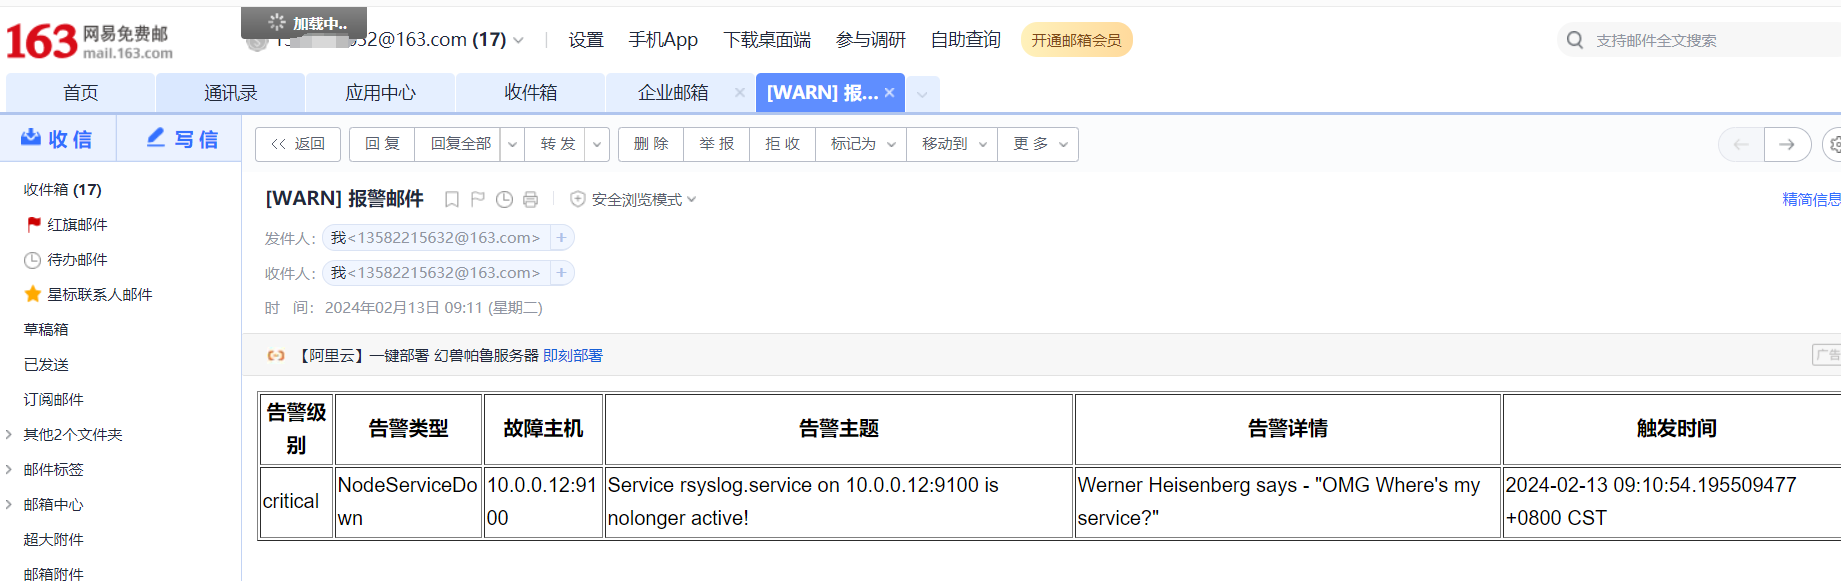
现在我添加silence
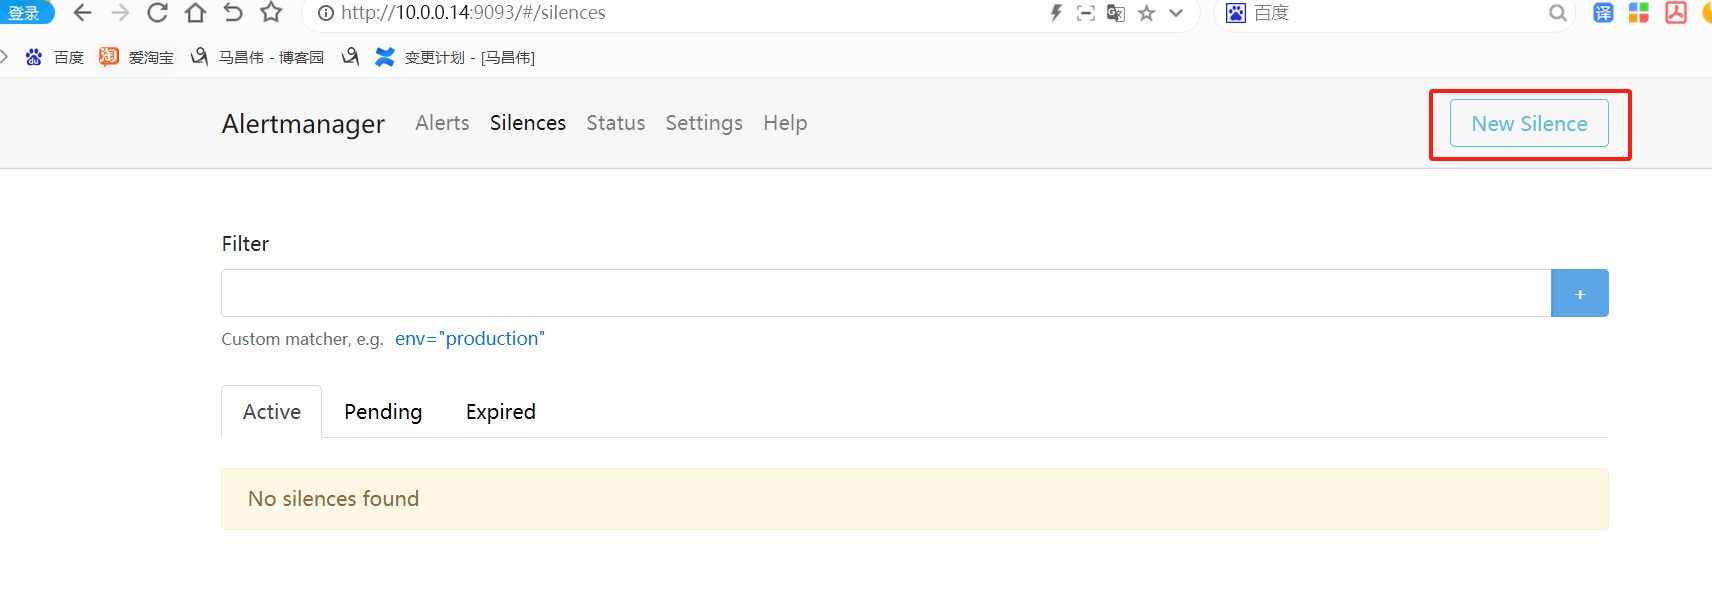
添加匹配标签
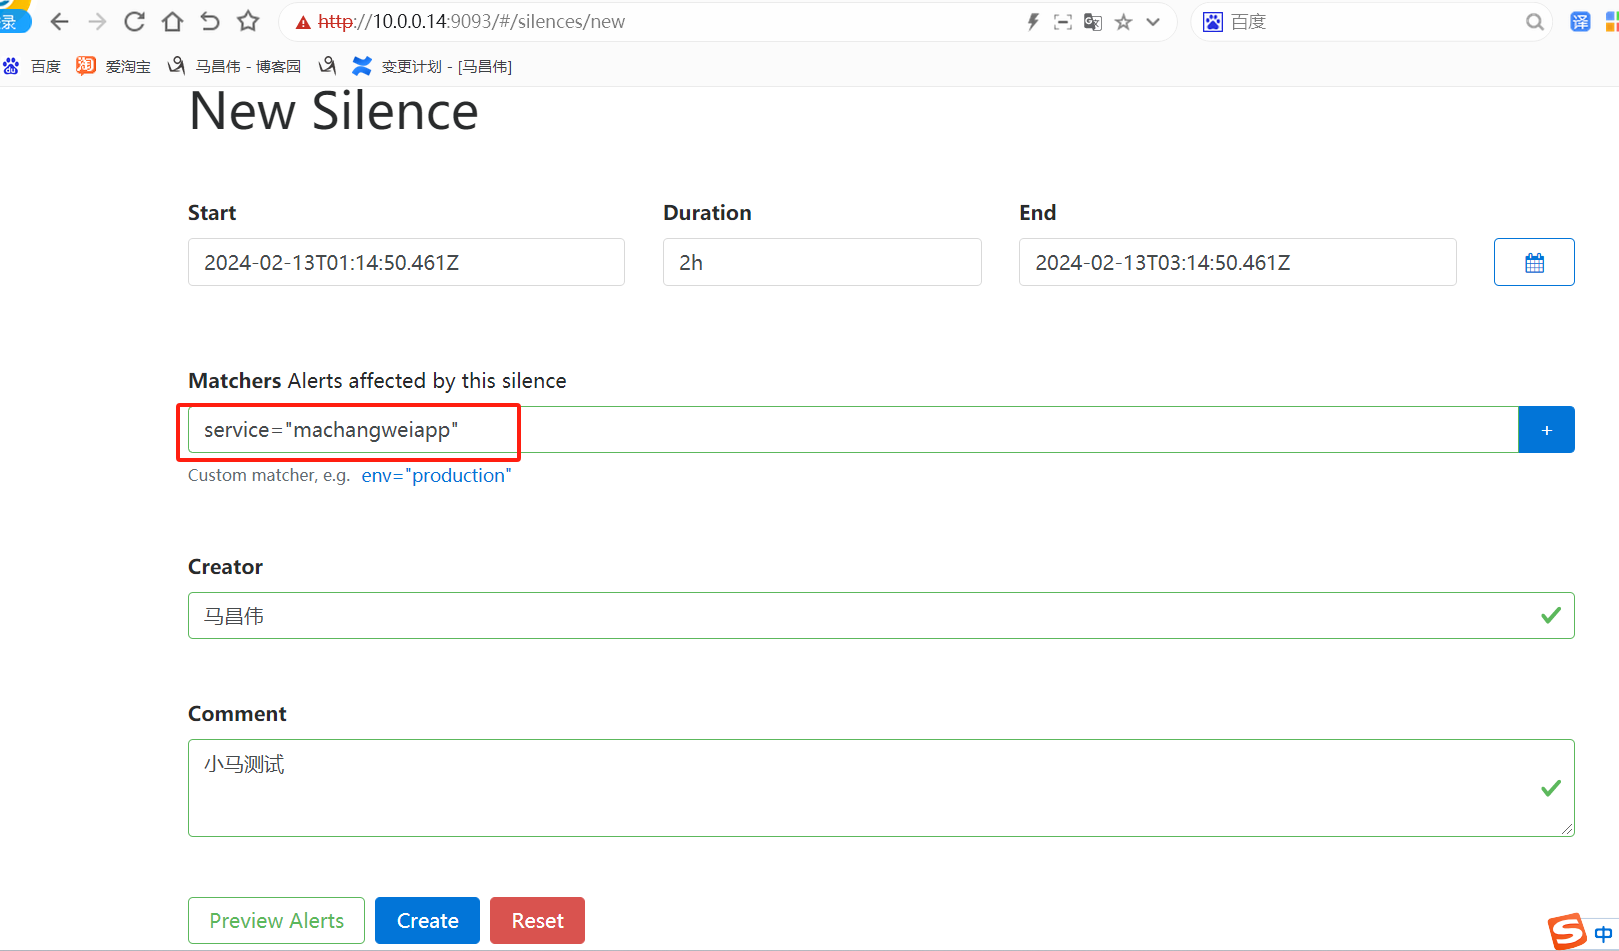
点击这里报错了
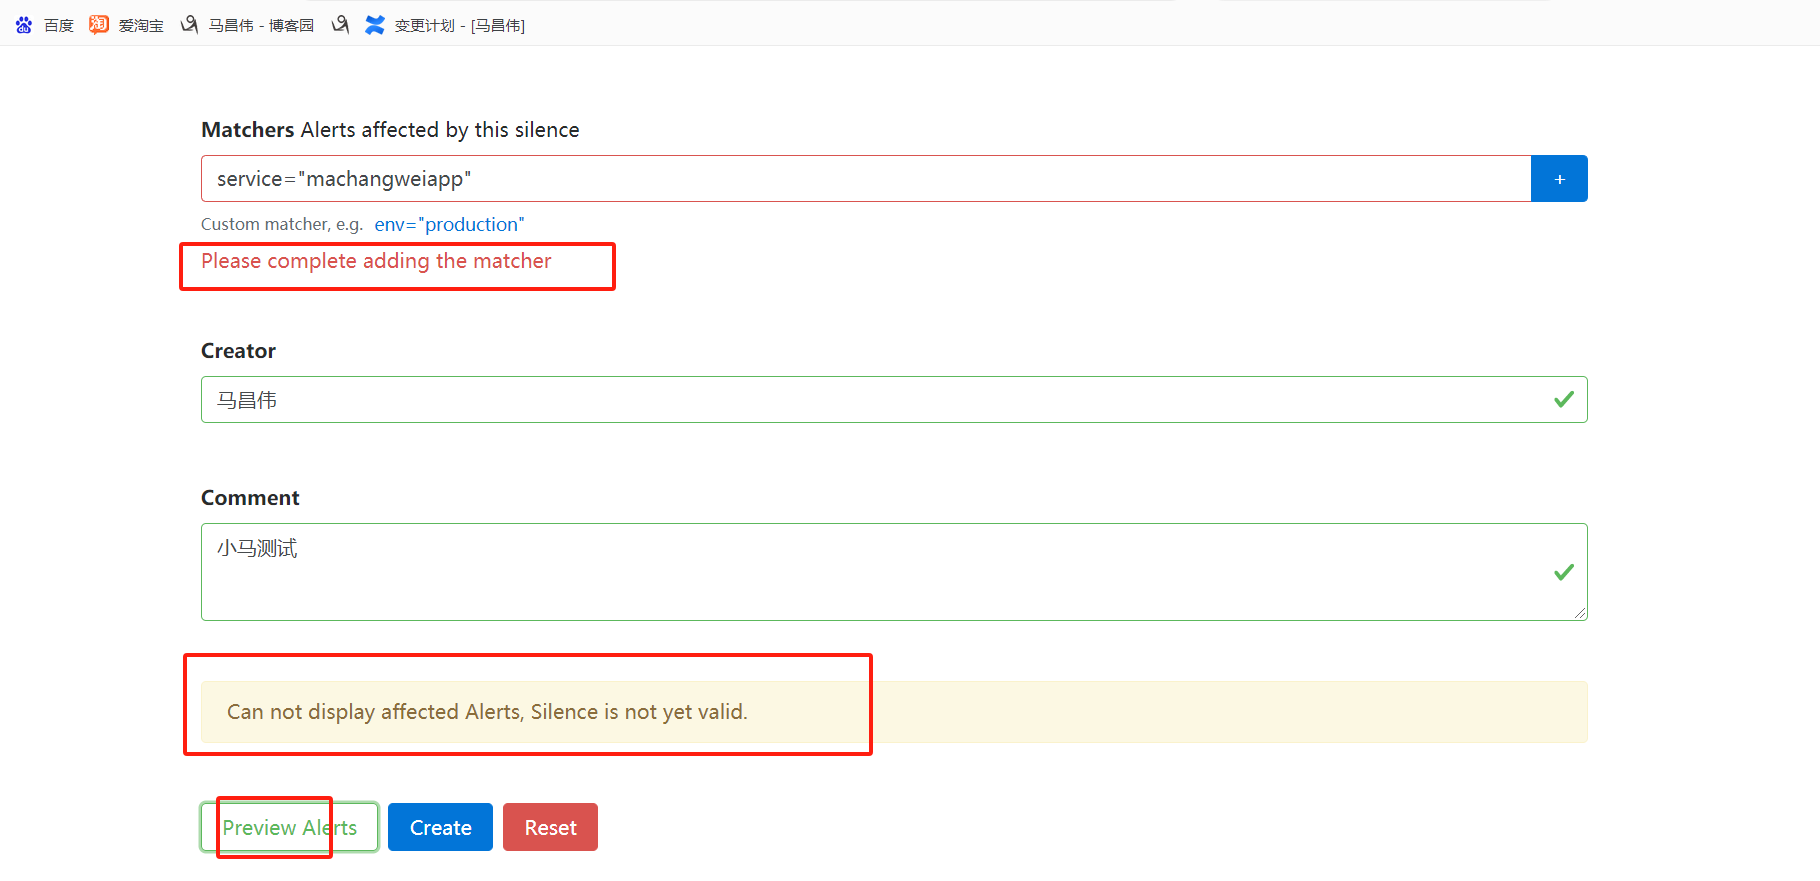
按enter键把它加进去
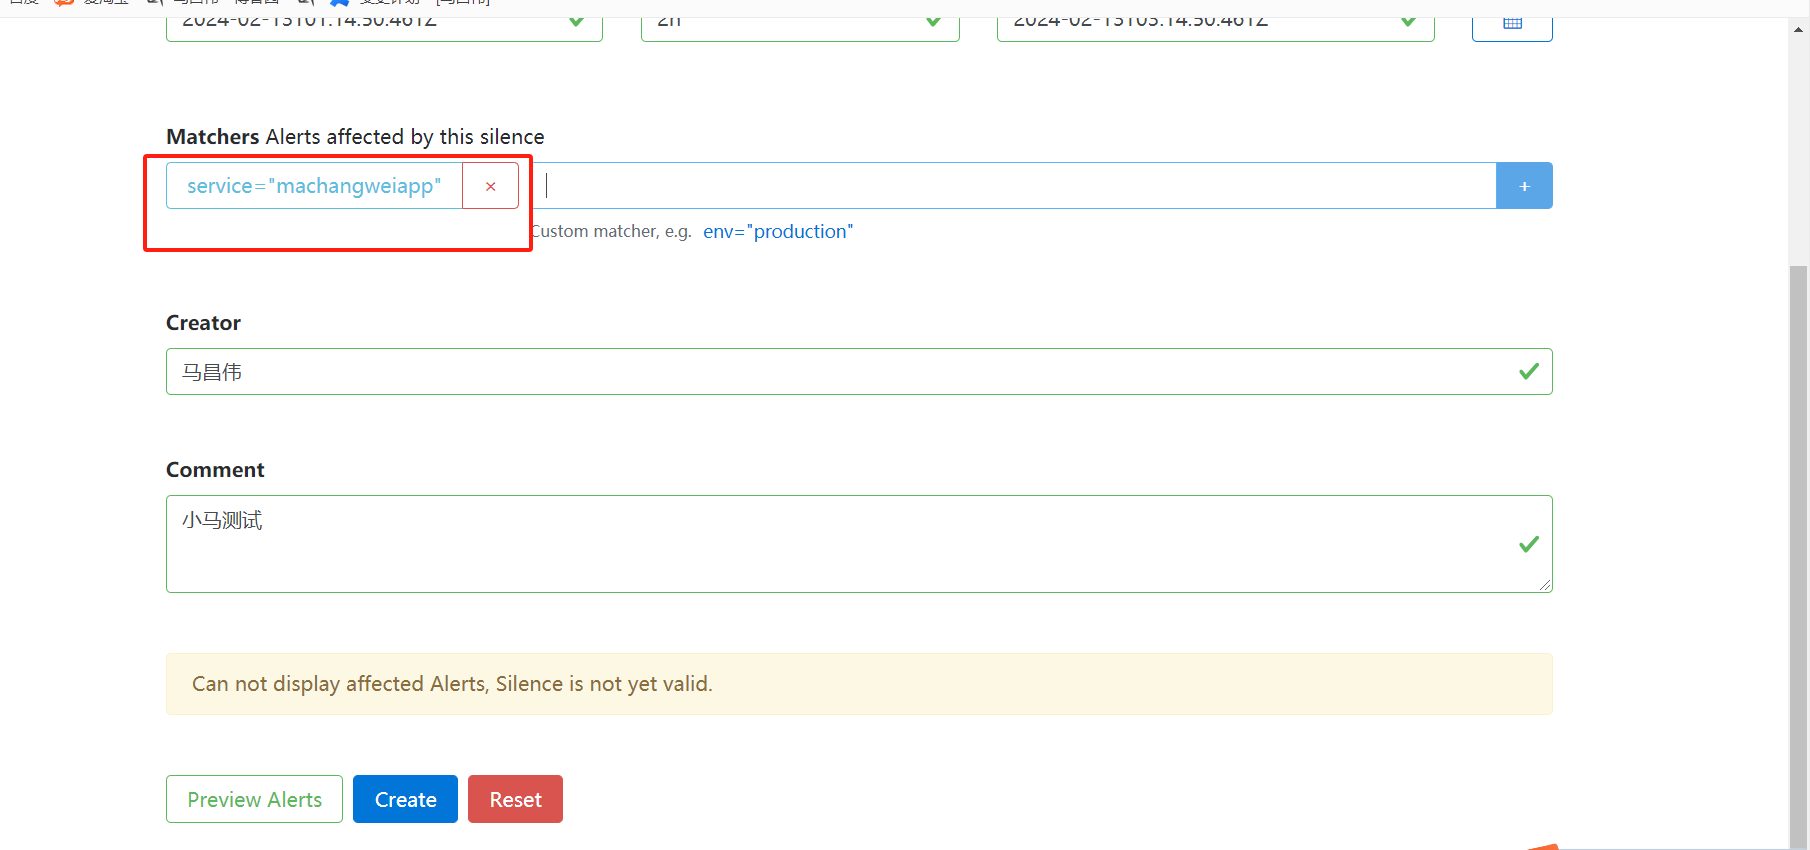
点击创建
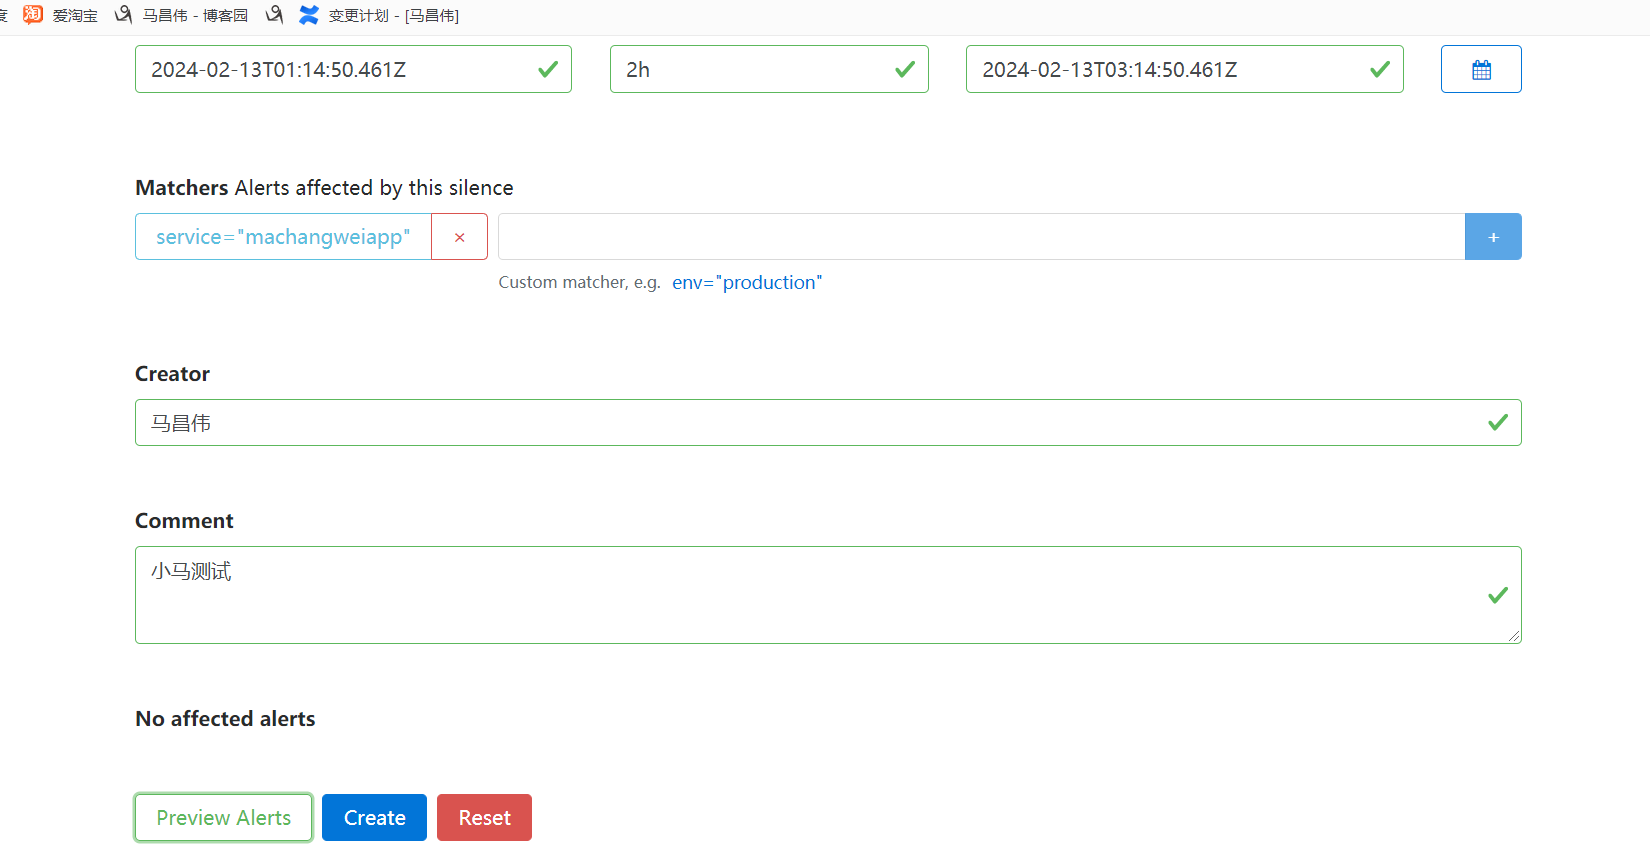
创建成功
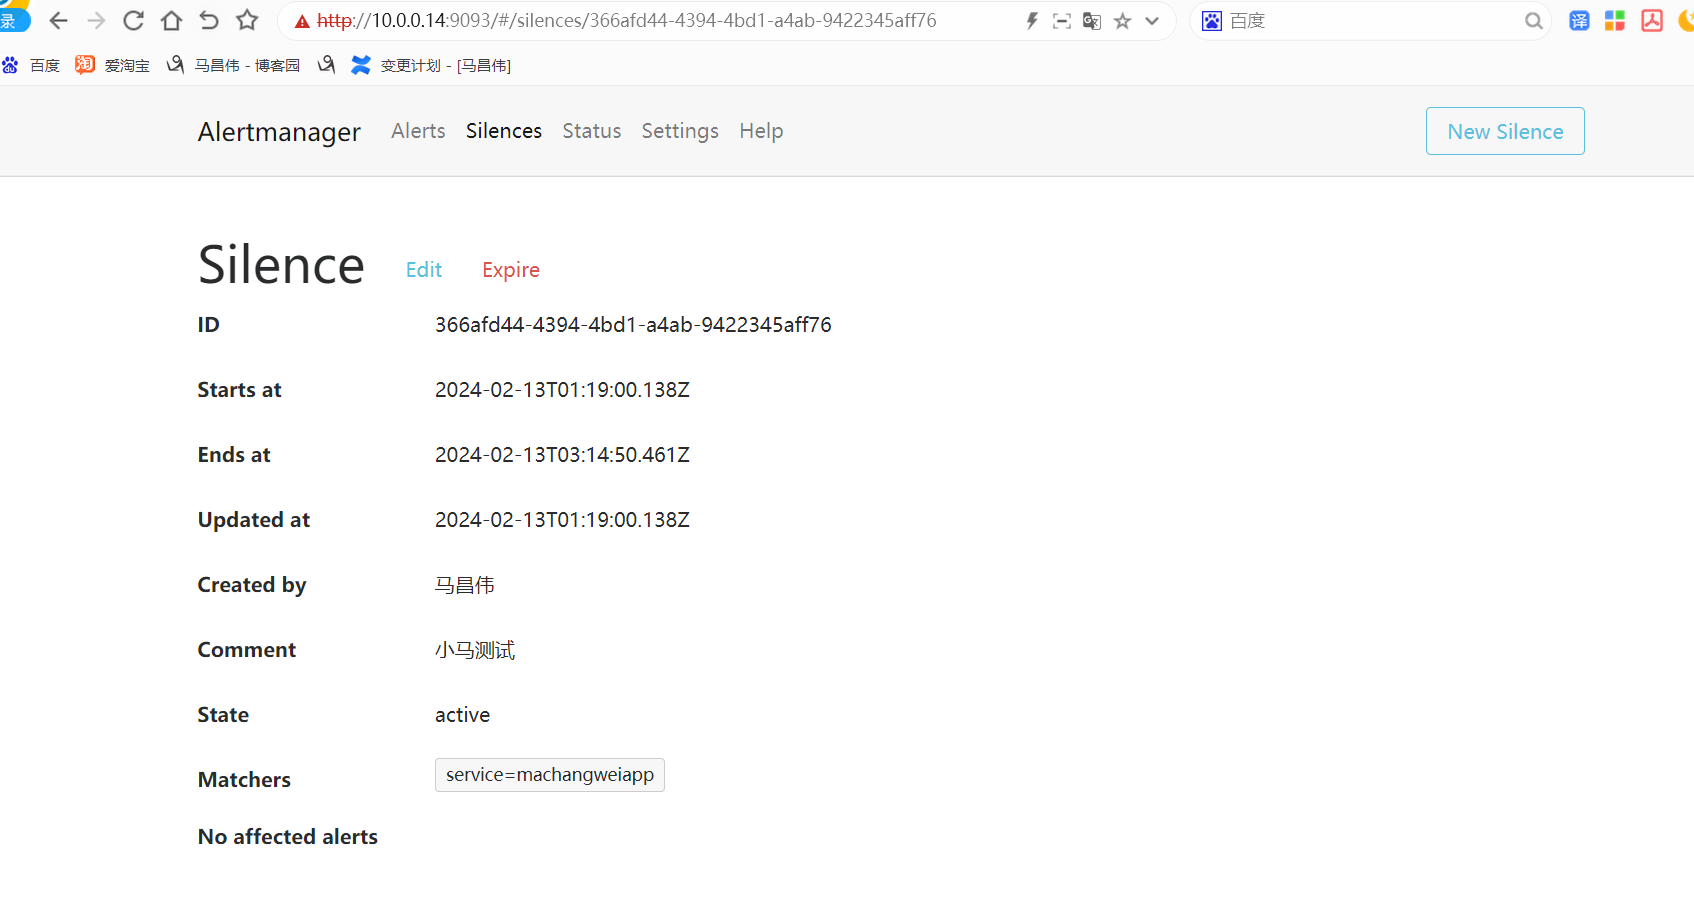
可以查看
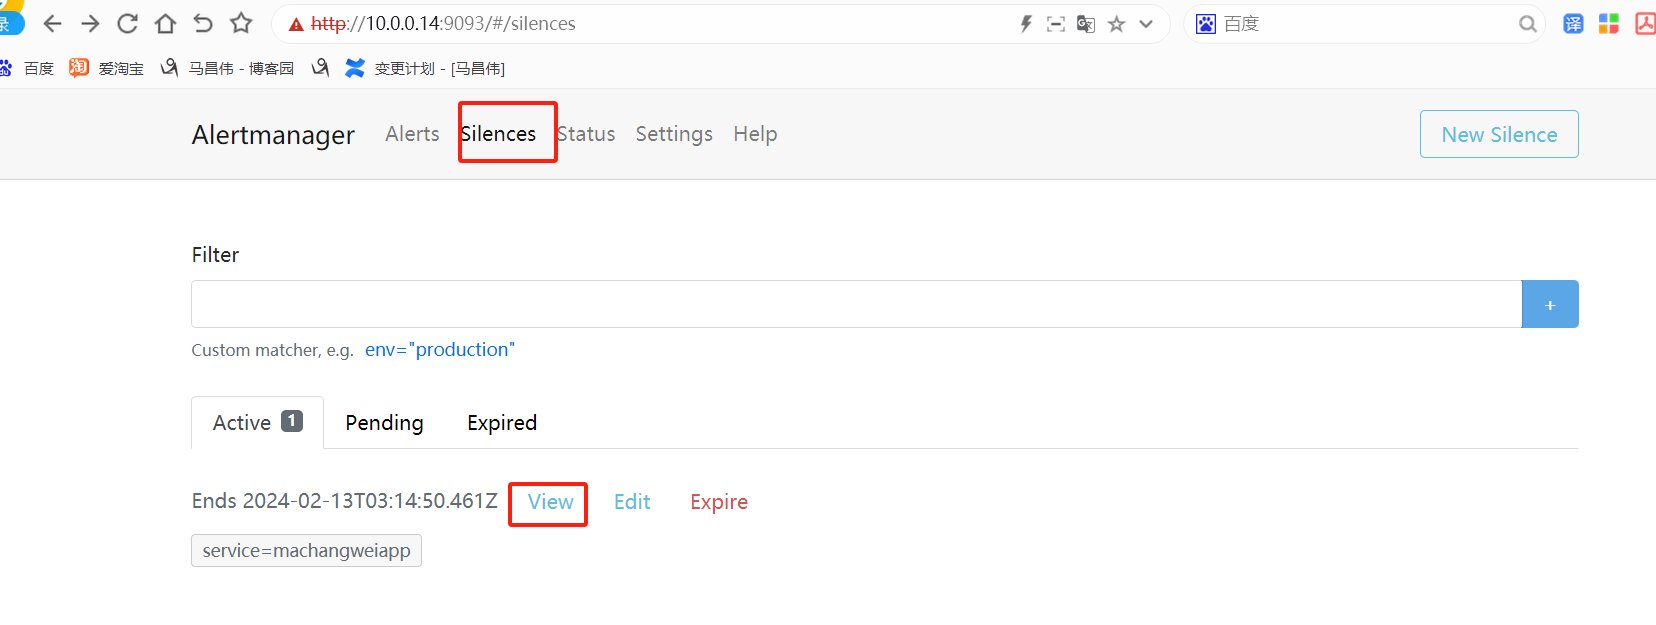
可以编辑和使之过期
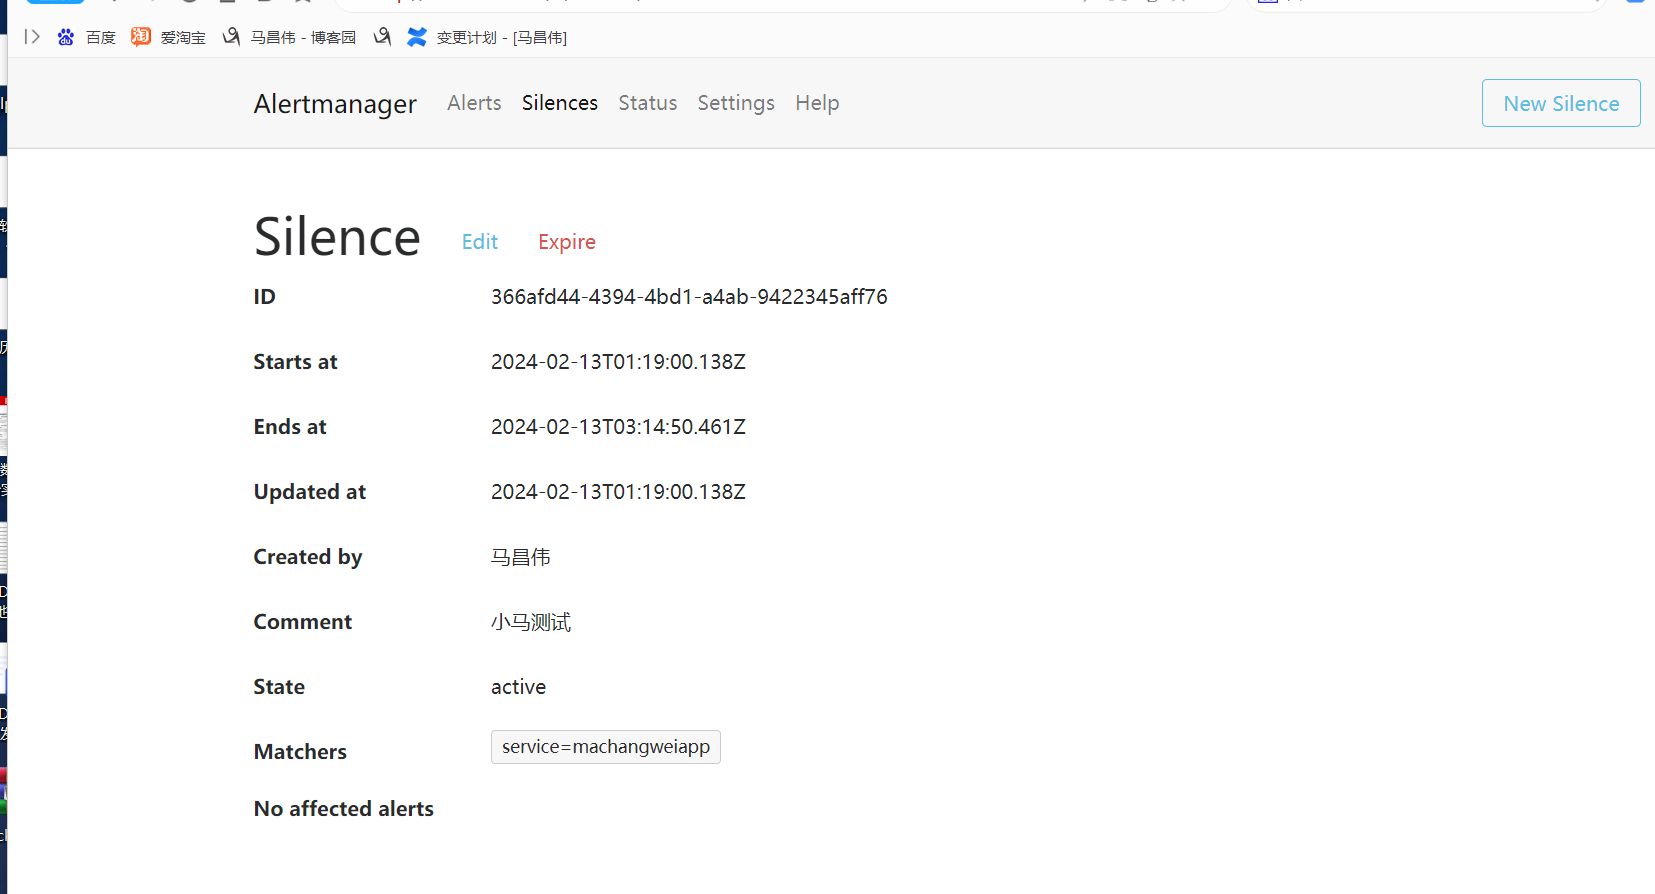
停止服务触发告警
[root@mcw02 ~]# systemctl stop rsyslog.service
[root@mcw02 ~]#
告警显示时间是utc时间,差了8个小时,
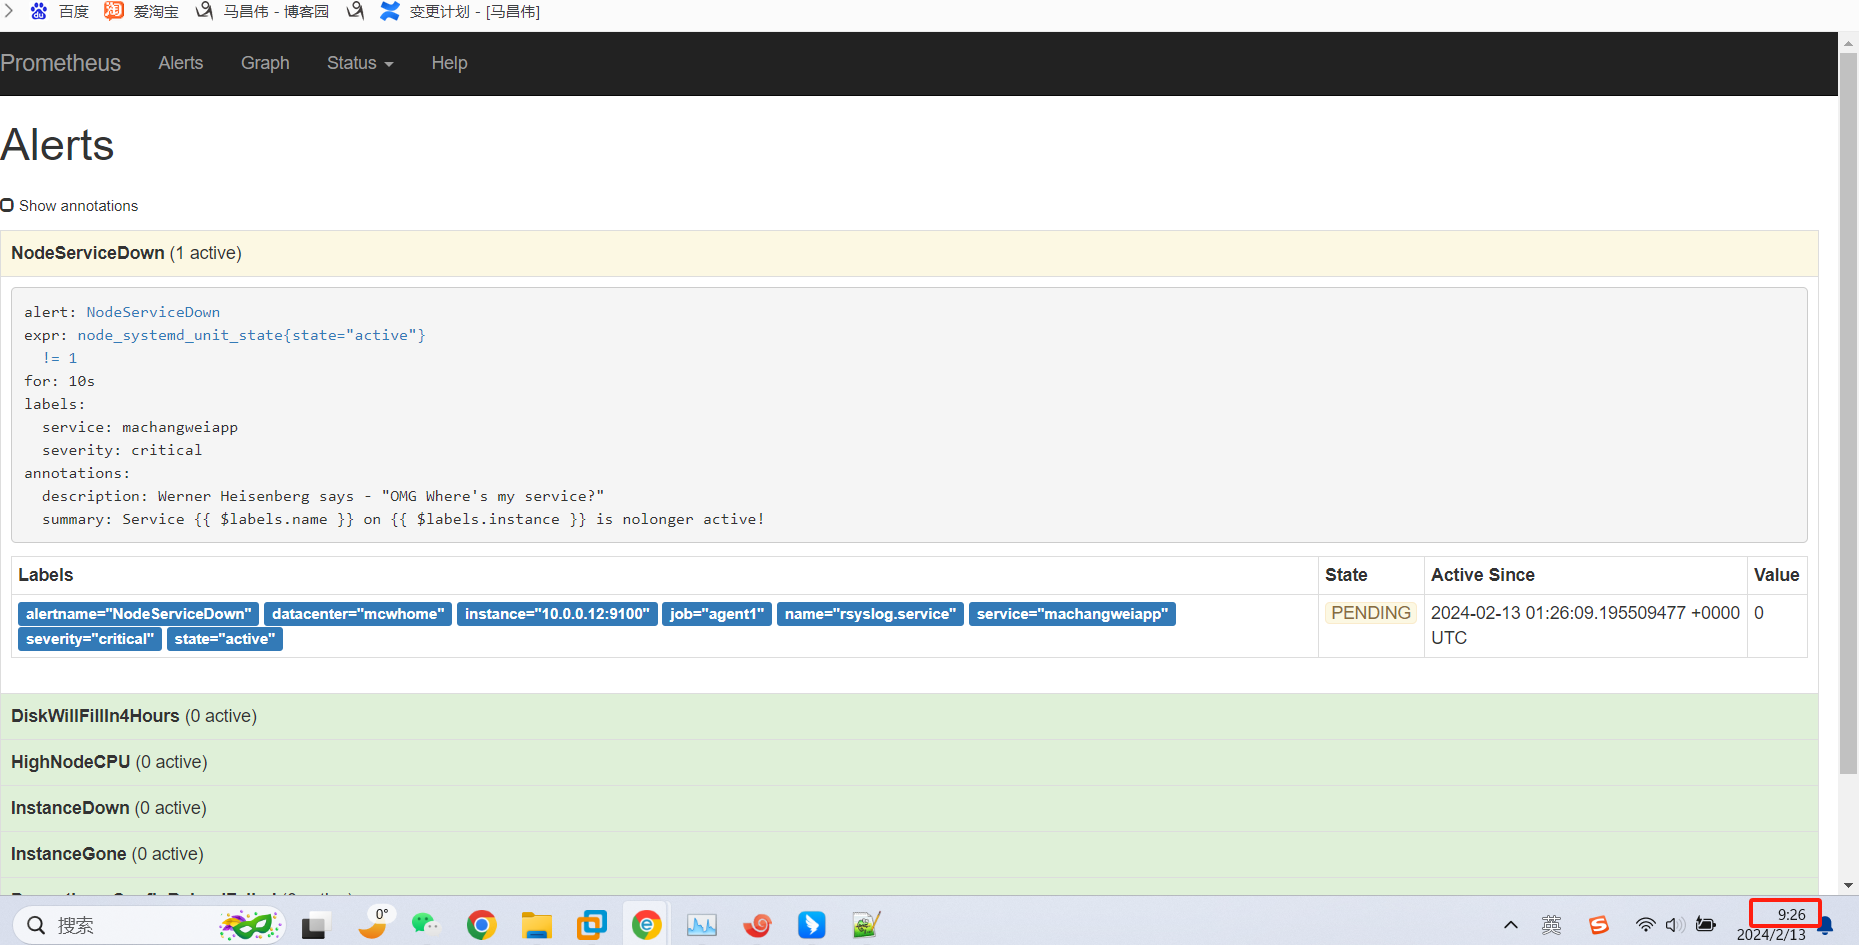
状态变红了e
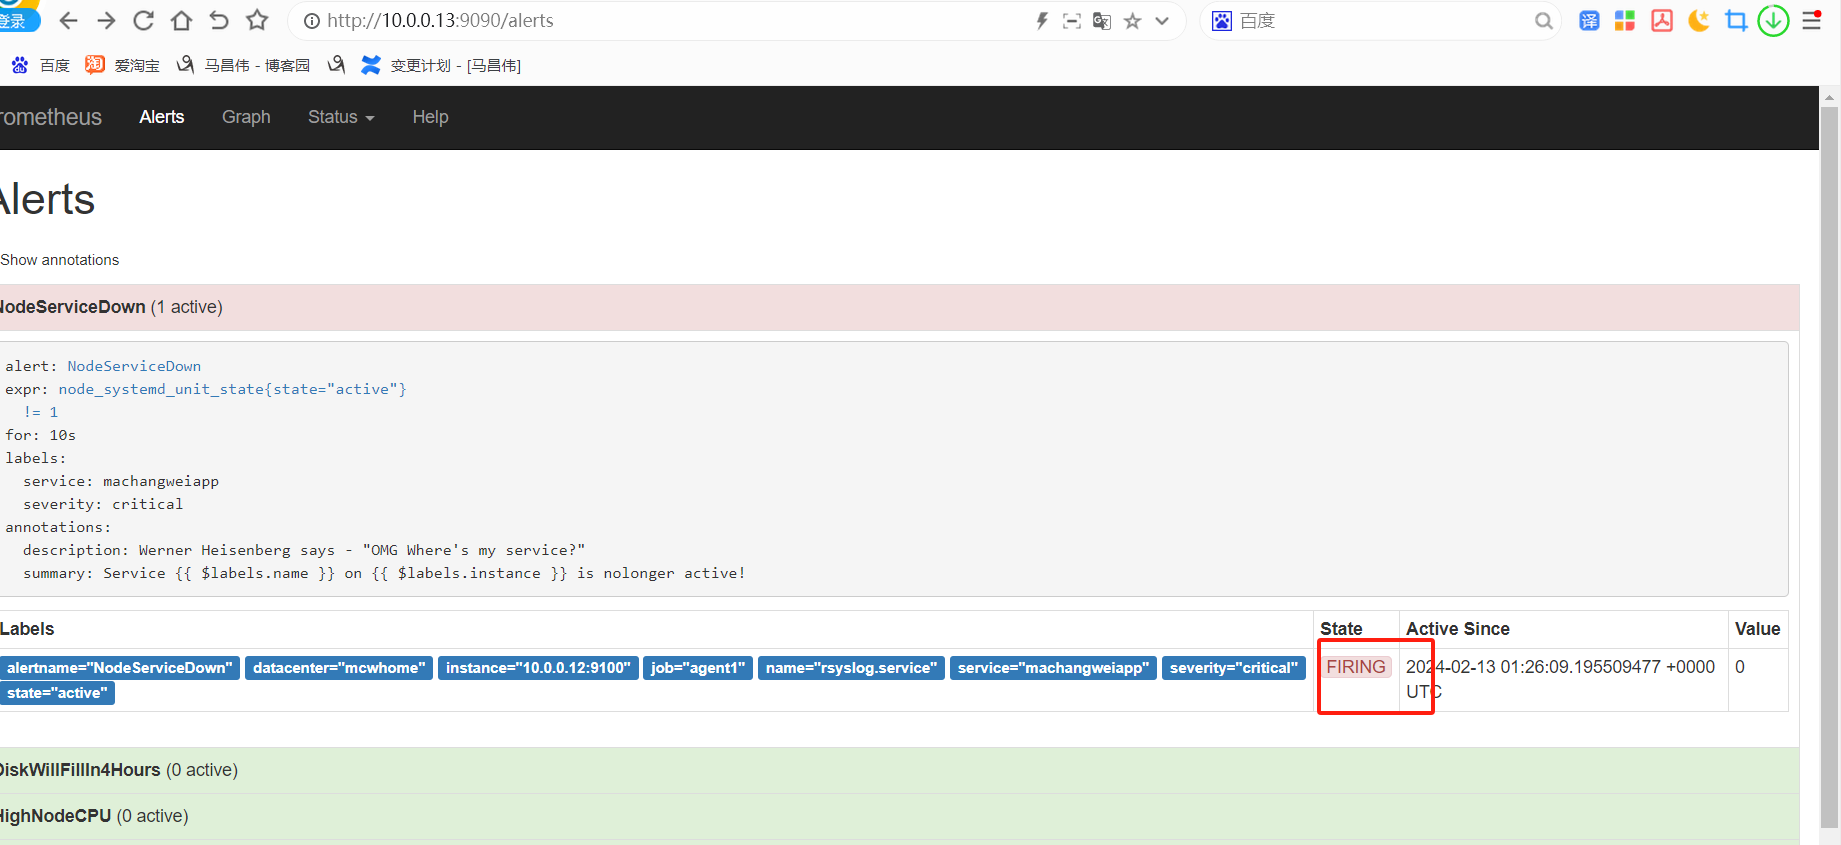
并没有新的告警通知
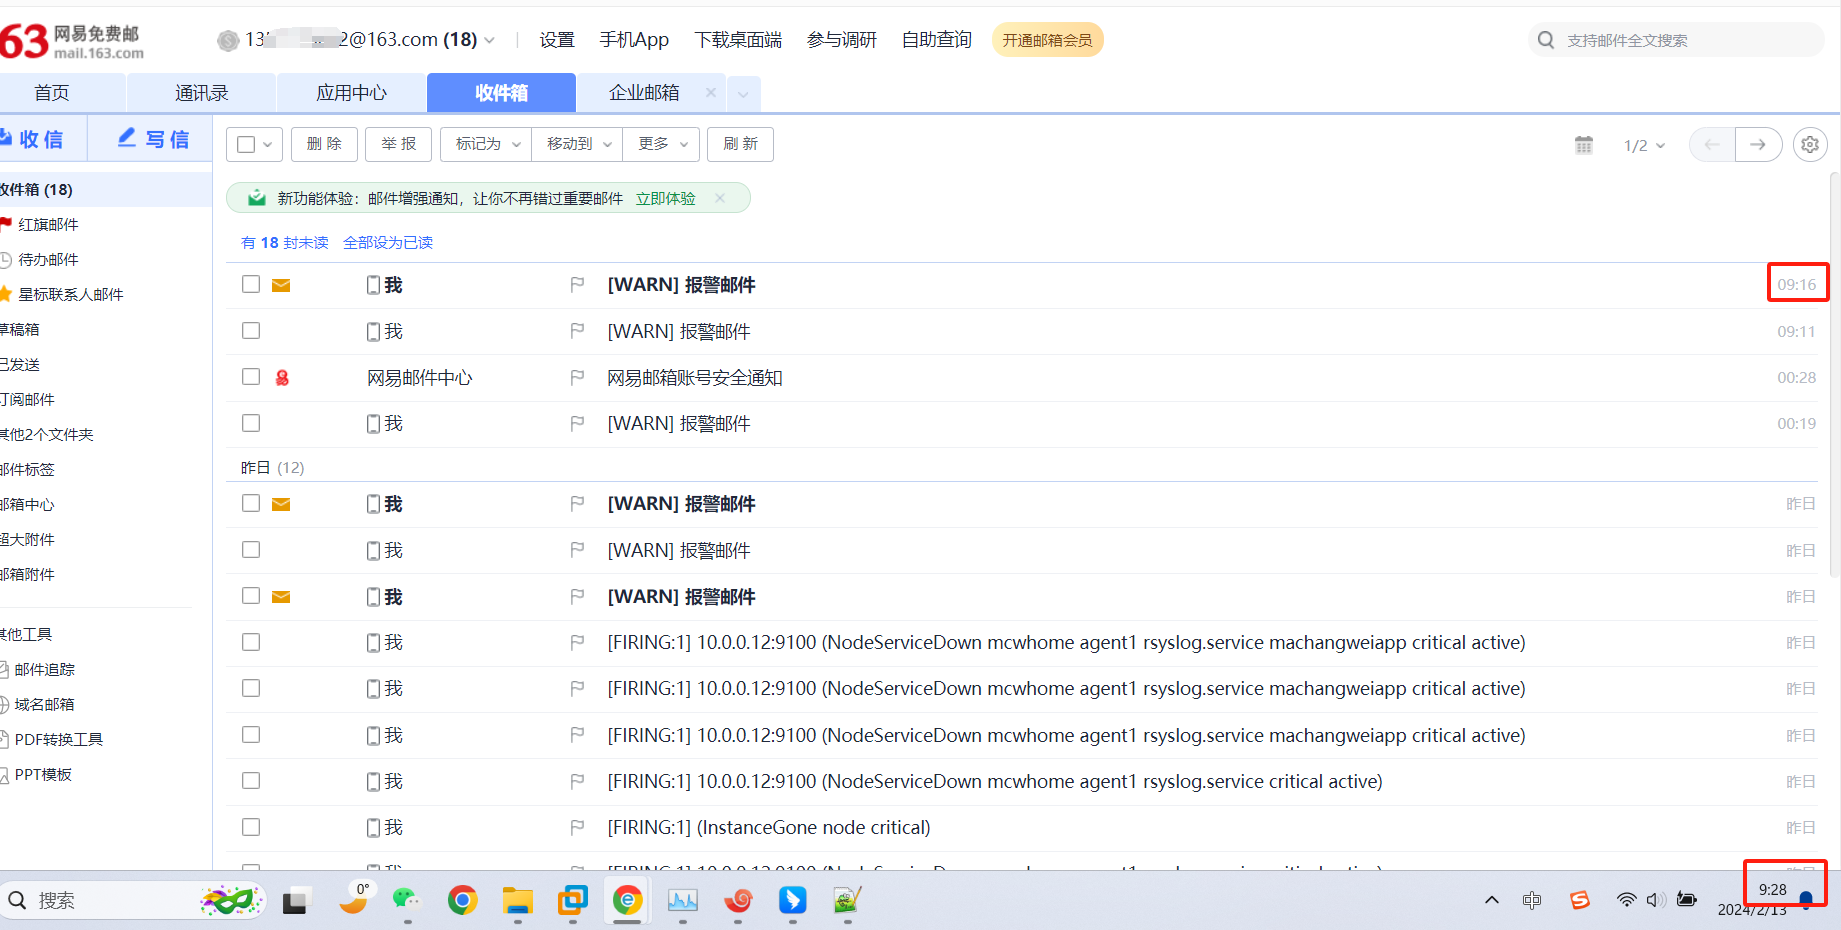
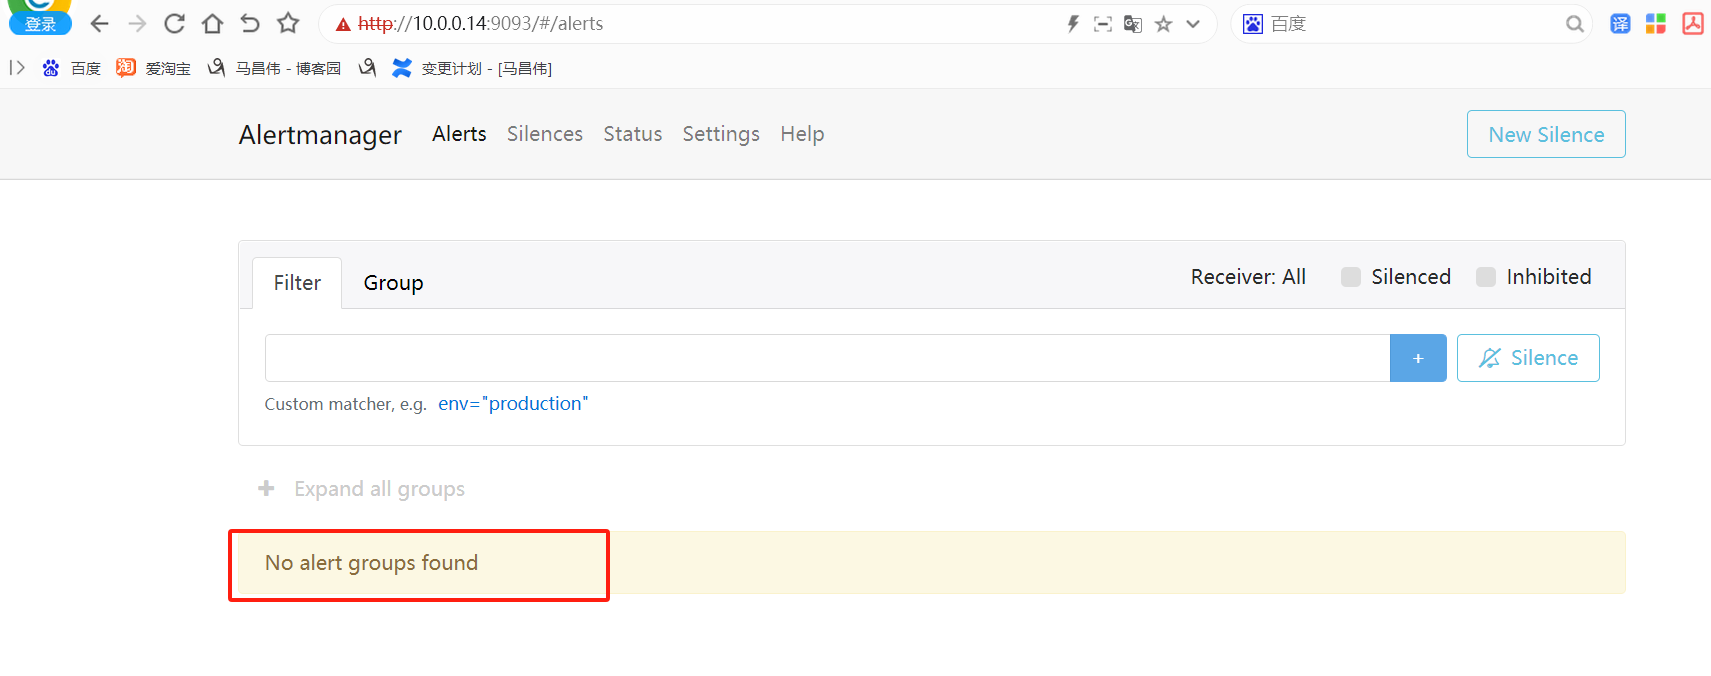
并没有告警通知产生
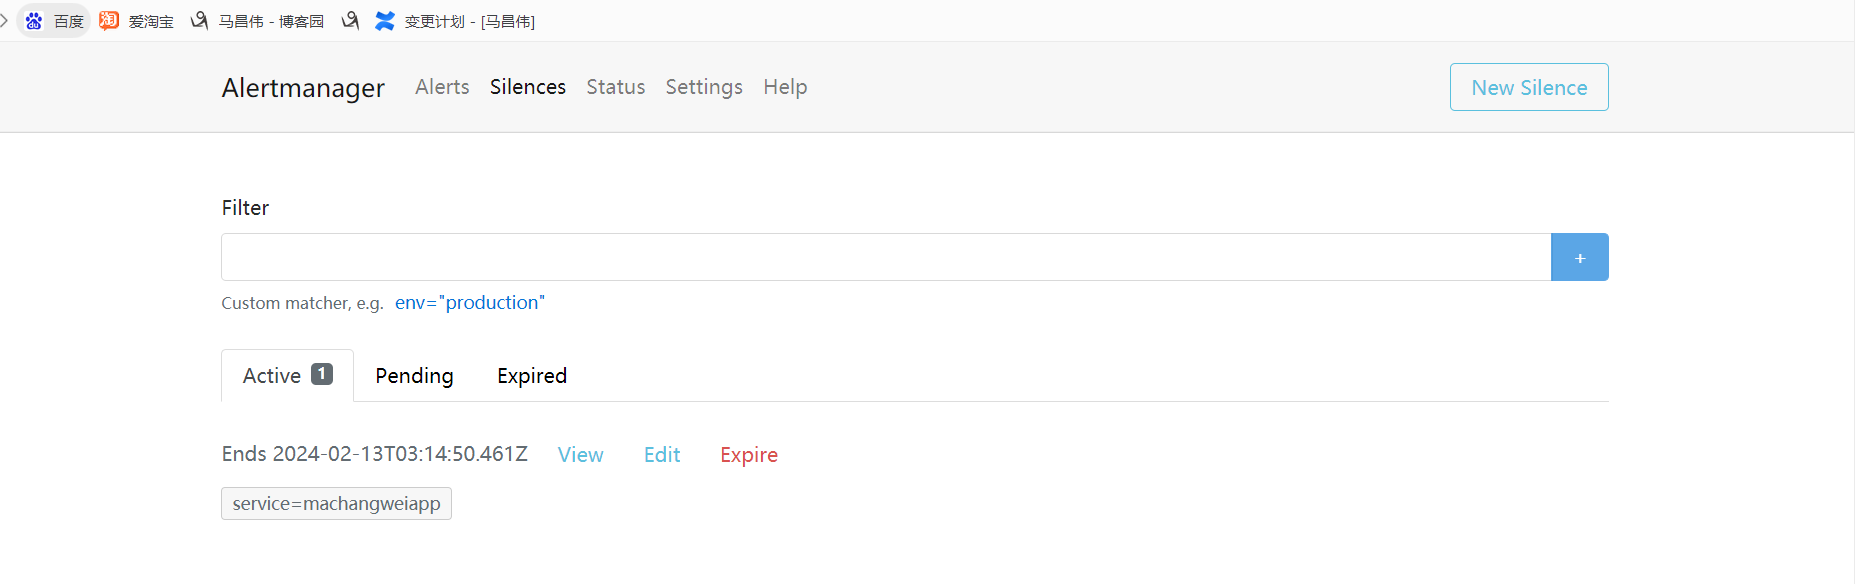
指定过期
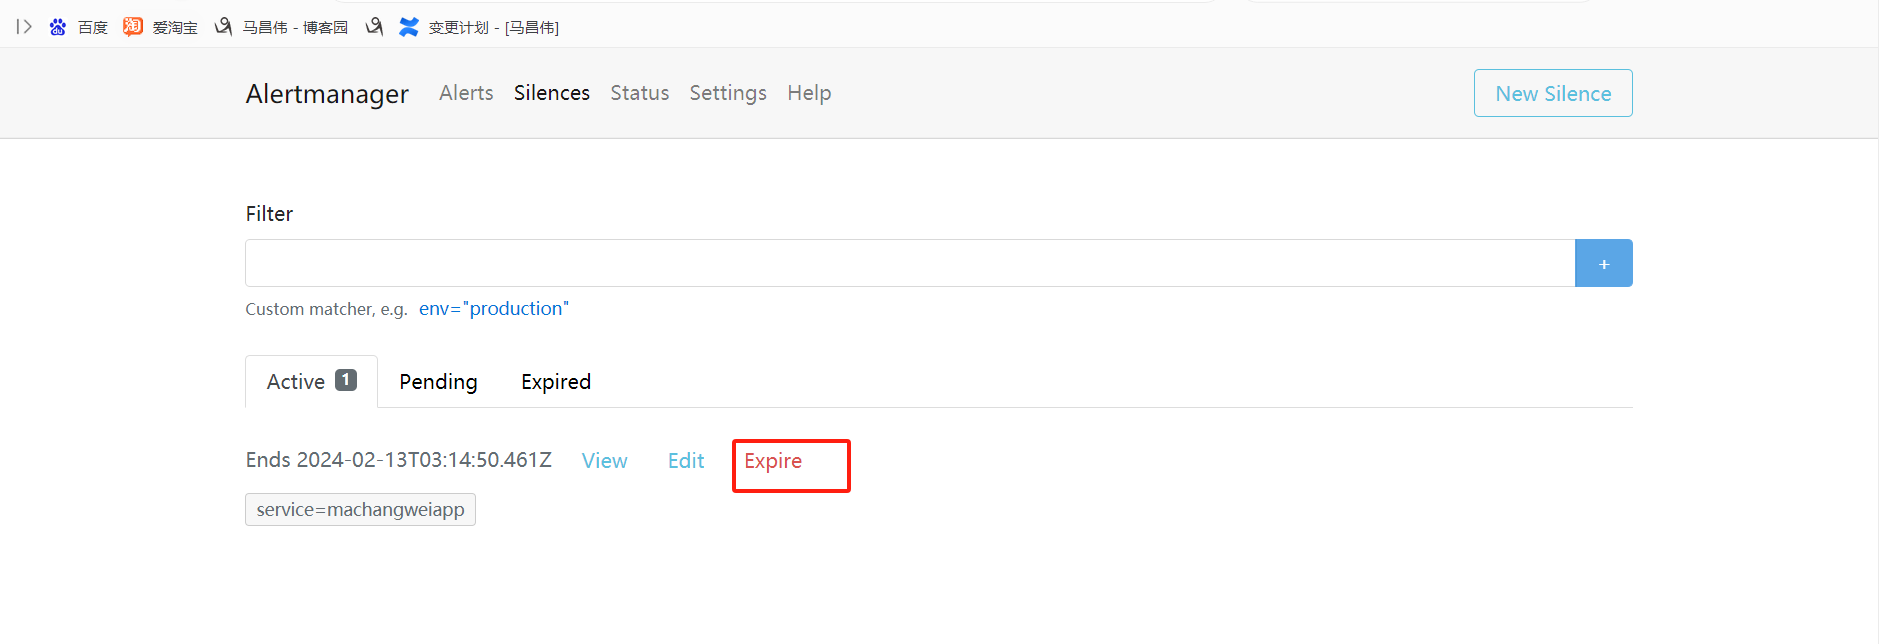
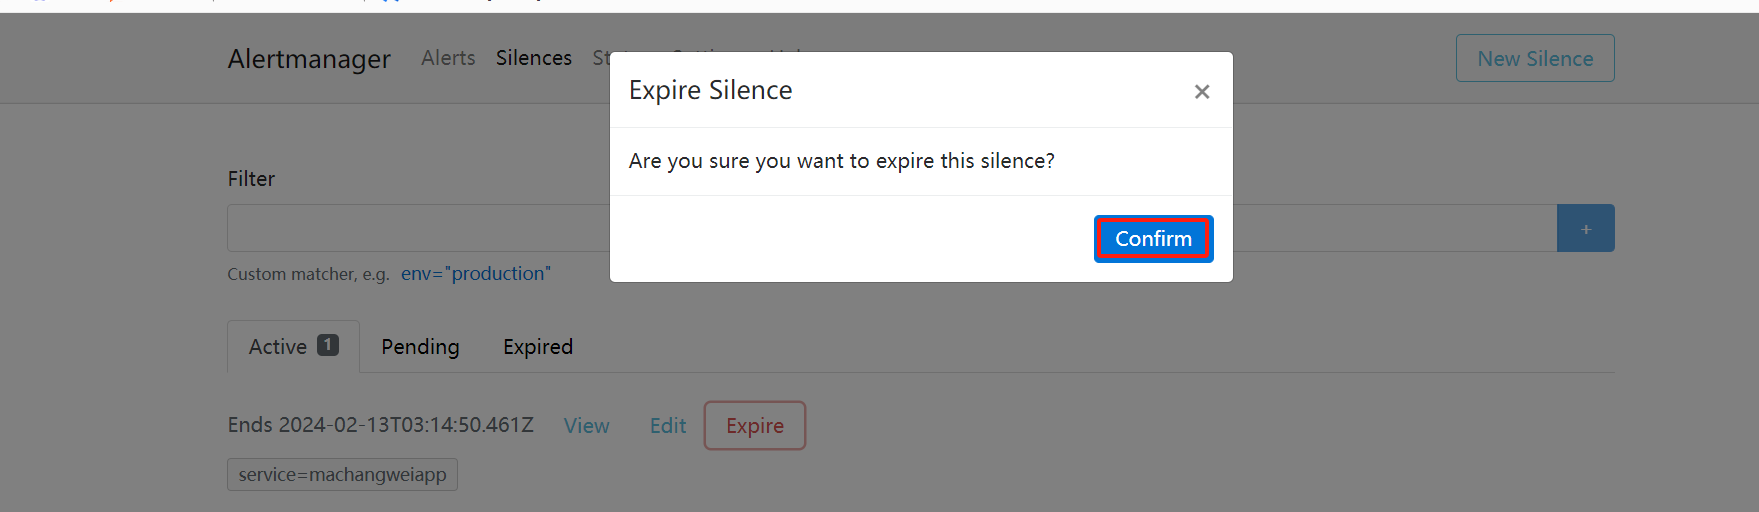
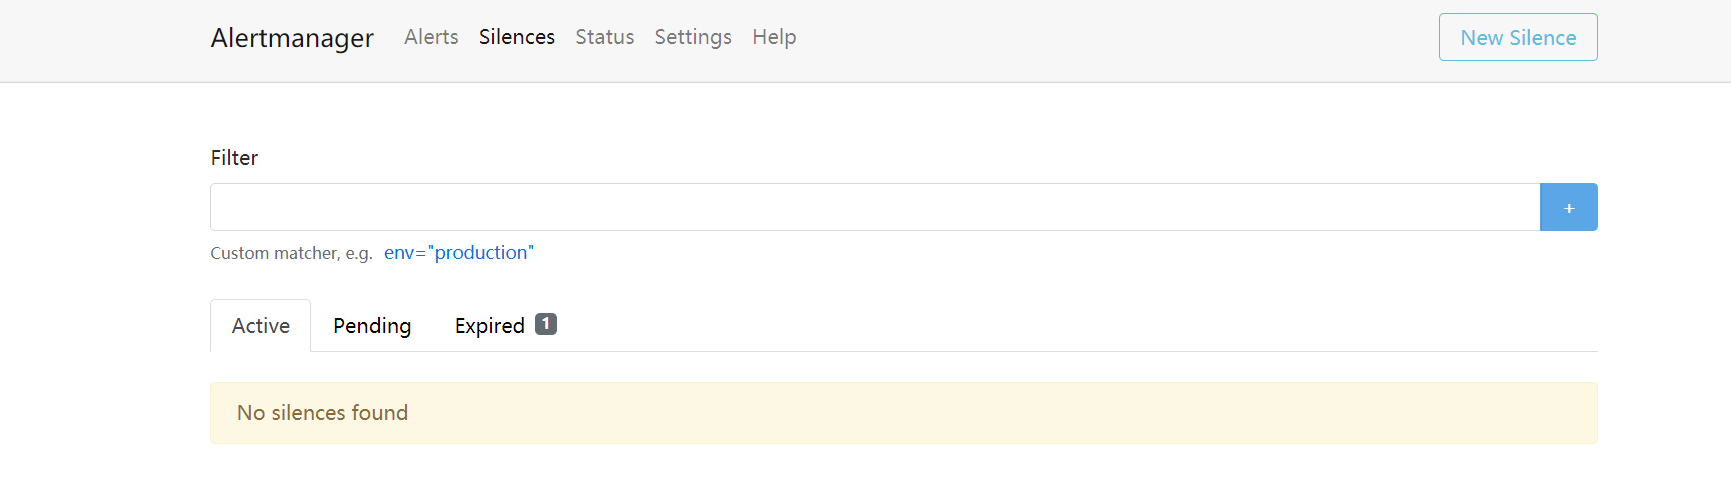
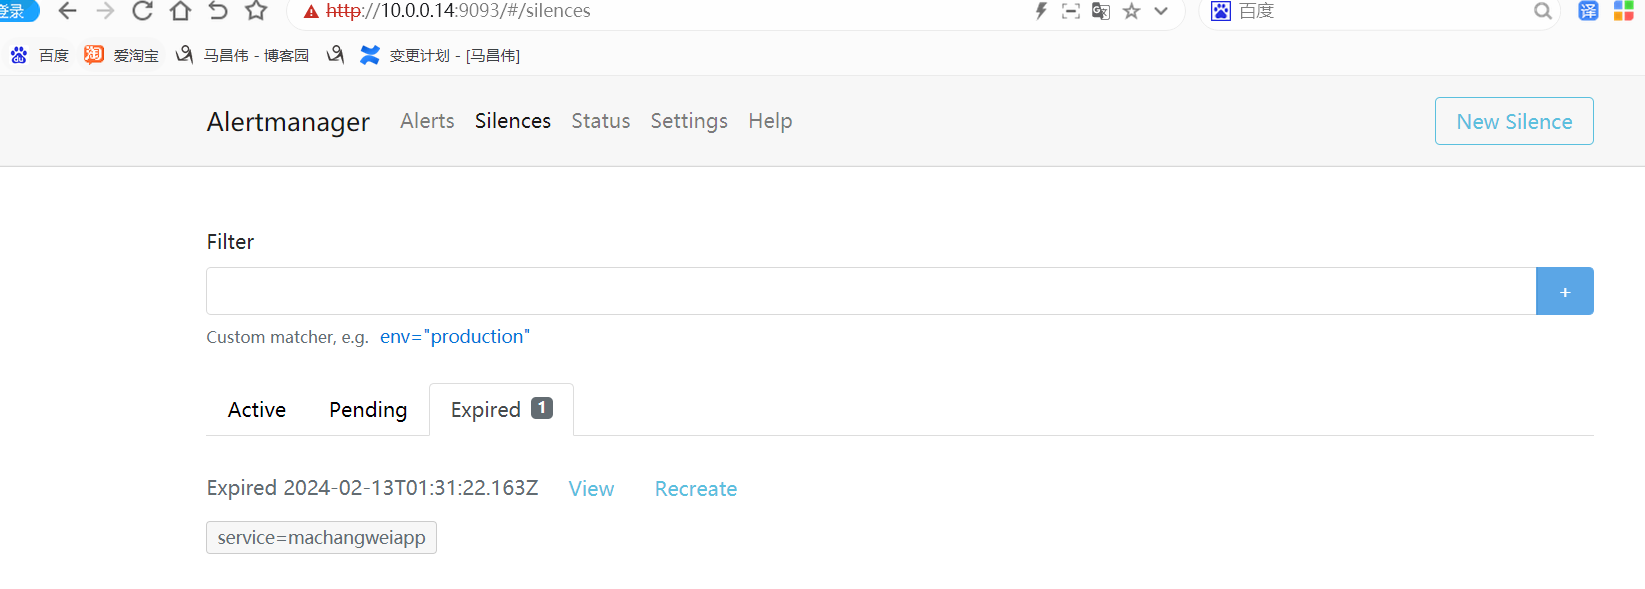
我们看上面过期时间是1:31,然后看我们的告警通知时间,9点31,减去时差,正好就是过期时间发送出去的。也就是添加了slice之后,Prometheus上能看到触发警报规则,但是alertmanager没有发送通知。当slice过期之后,因为服务还没恢复,告警通知立马发送出去了。
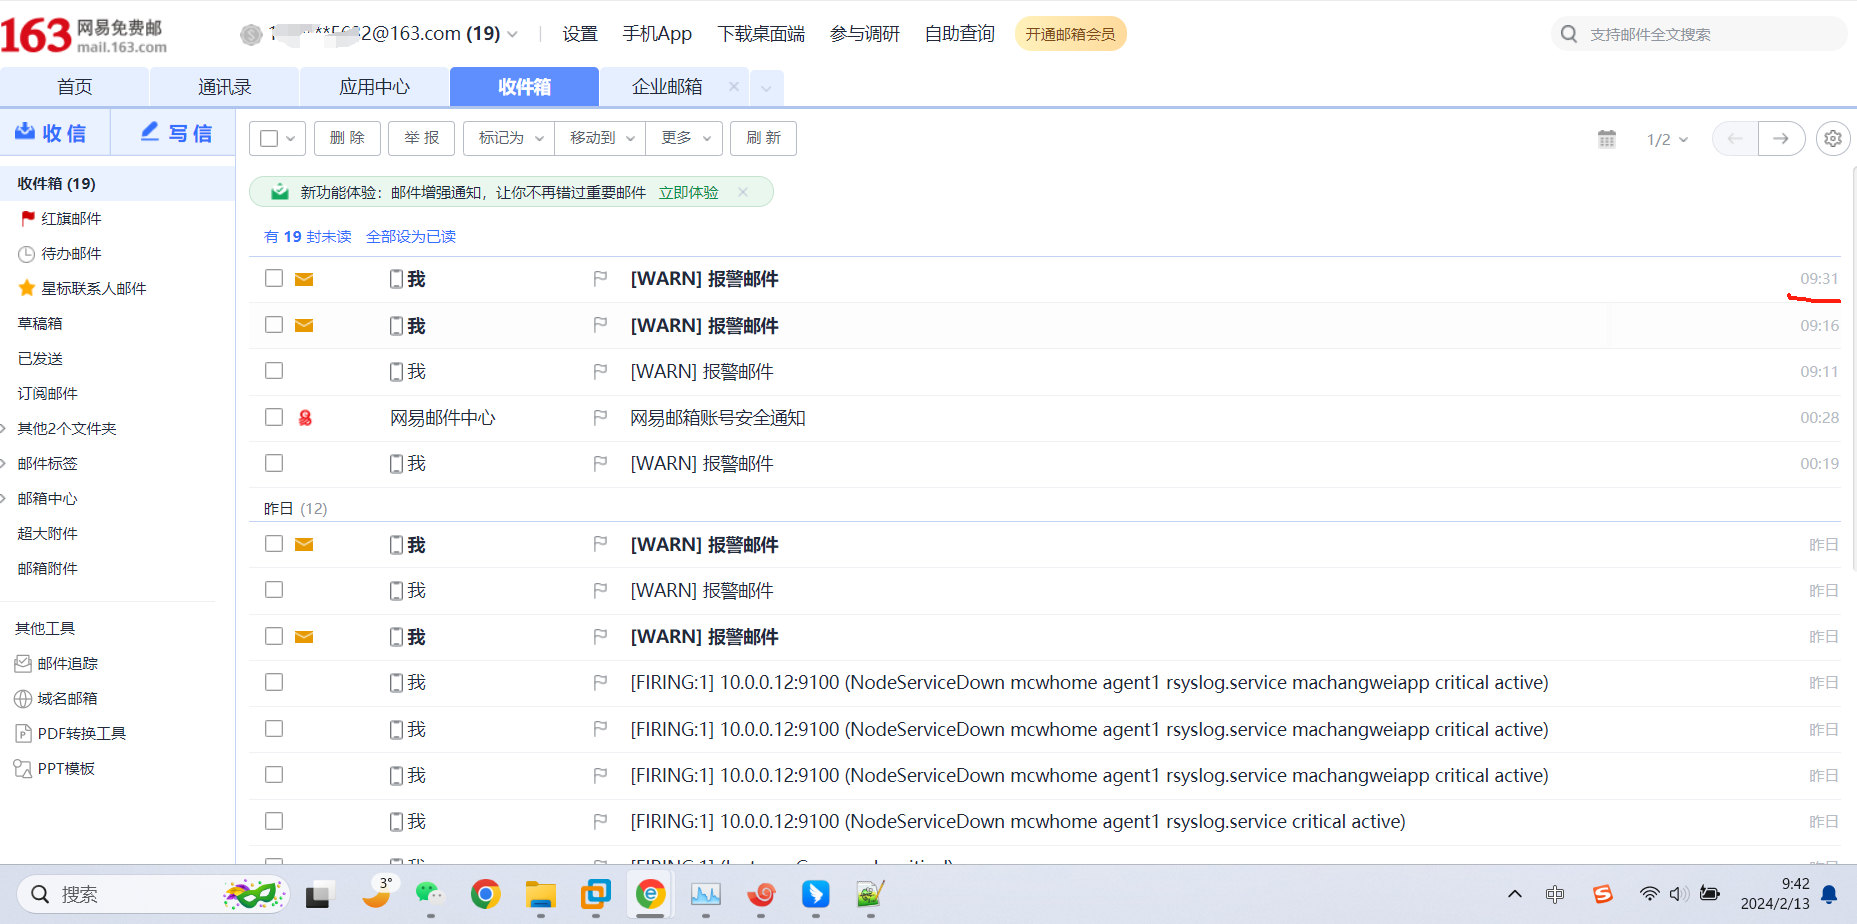
通过amtool控制silence
[root@mcw04 ~]# /tmp/alertmanager-0.26.0.linux-amd64/amtool --alertmanager.url=http://10.0.0.14:9093 silence add alertname=InstancesGone service=machangweiapp
amtool: error: comment required by config

[root@mcw04 ~]# /tmp/alertmanager-0.26.0.linux-amd64/amtool --alertmanager.url=http://10.0.0.14:9093 silence add  --comment "xiaoma test" alertname=InstancesGone service=machangweiapp
836bb0d7-4501-4d6a-bd0d-a03e659eec13
[root@mcw04 ~]#
可以看到新增的
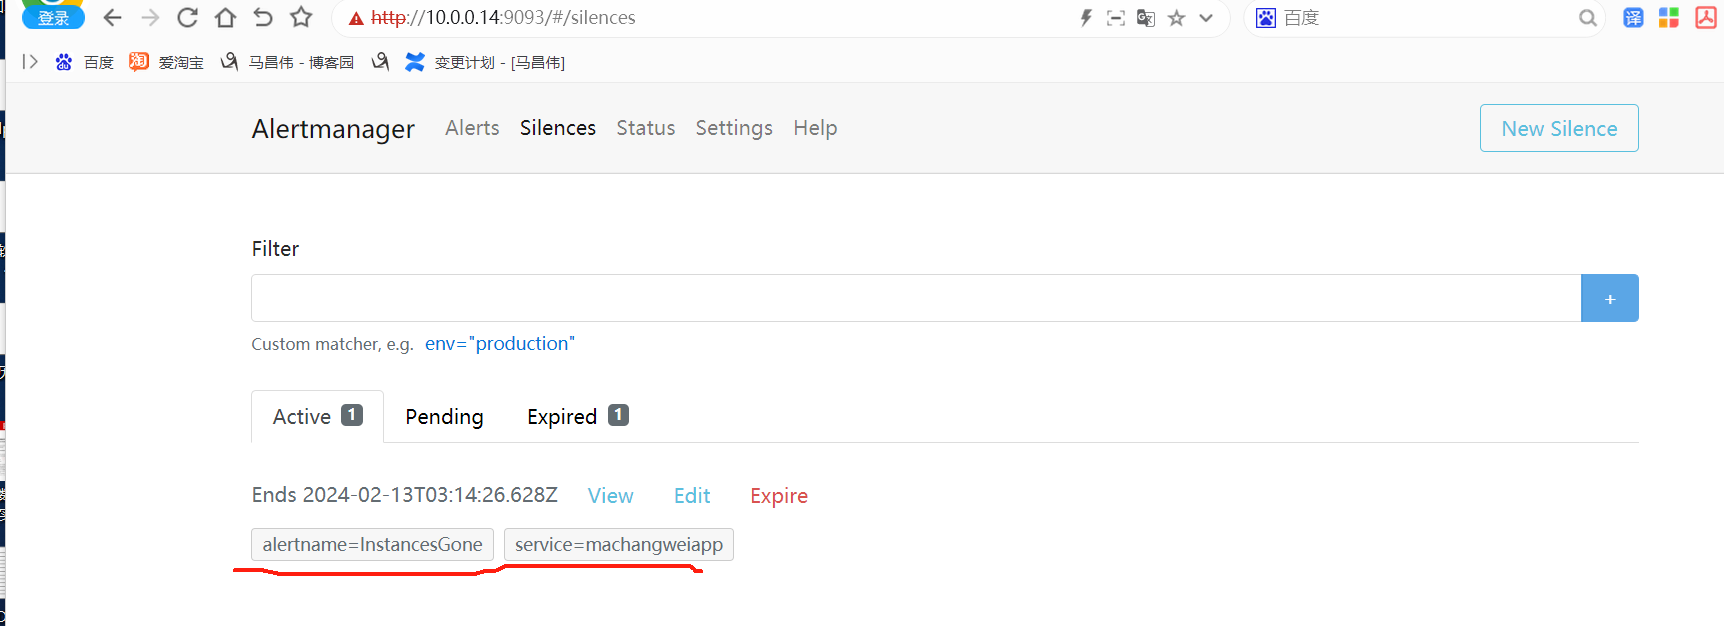
不过这个匹配不到,应该这个名称的告警规则,没有带有标签service的标签。但是依然是可以创建出来sillences的
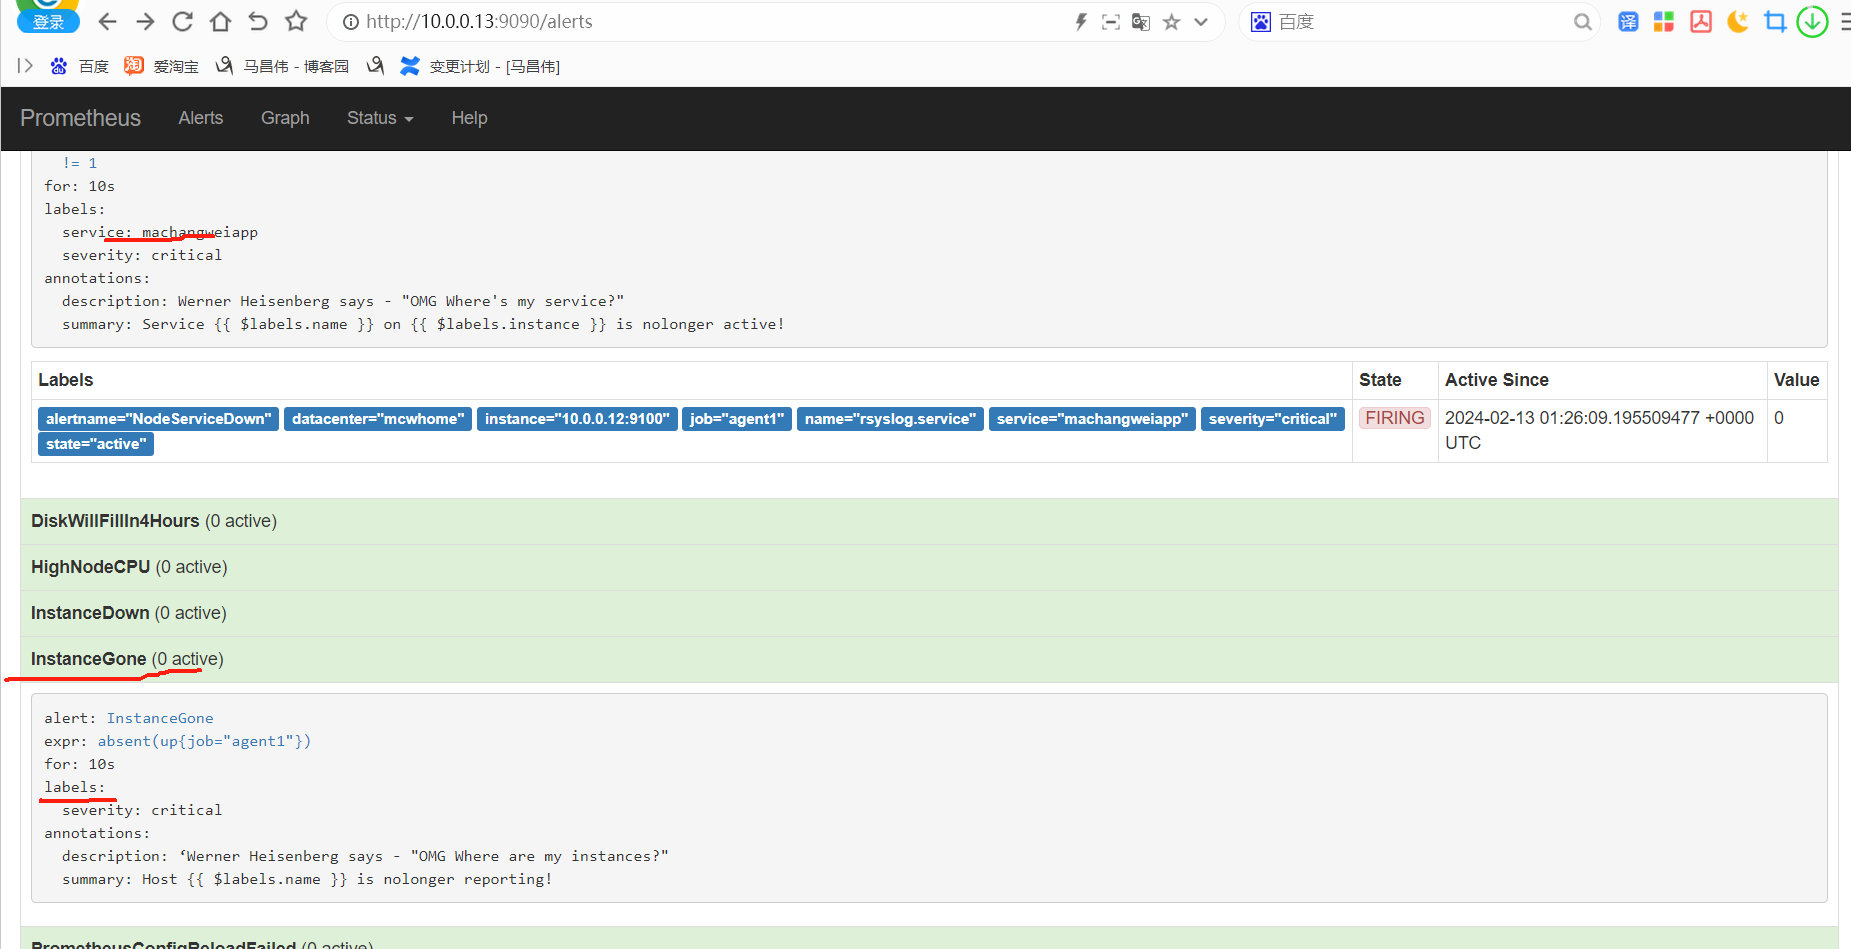
查询silence
[root@mcw04 ~]# /tmp/alertmanager-0.26.0.linux-amd64/amtool --alertmanager.url=http://10.0.0.14:9093 silence query
ID                                    Matchers                                           Ends At                  Created By  Comment
836bb0d7-4501-4d6a-bd0d-a03e659eec13  alertname="InstancesGone" service="machangweiapp"  2024-02-13 03:14:26 UTC  root        xiaoma test
[root@mcw04 ~]#
使silence失效
[root@mcw04 ~]# /tmp/alertmanager-0.26.0.linux-amd64/amtool --alertmanager.url=http://10.0.0.14:9093 silence query
ID                                    Matchers                                           Ends At                  Created By  Comment
836bb0d7-4501-4d6a-bd0d-a03e659eec13  alertname="InstancesGone" service="machangweiapp"  2024-02-13 03:14:26 UTC  root        xiaoma test
[root@mcw04 ~]# /tmp/alertmanager-0.26.0.linux-amd64/amtool --alertmanager.url=http://10.0.0.14:9093 silence expire 836bb0d7-4501-4d6a-bd0d-a03e659eec13
[root@mcw04 ~]# /tmp/alertmanager-0.26.0.linux-amd64/amtool --alertmanager.url=http://10.0.0.14:9093 silence query
ID  Matchers  Ends At  Created By  Comment
[root@mcw04 ~]#
添加配置文件,默认家目录下面那个文件,然后写上参数,这样命令行可以省去一些参数,
[root@mcw04 ~]# mkdir -p .config/amtool
[root@mcw04 ~]# vim .config/amtool/config.yml
[root@mcw04 ~]# cat .config/amtool/config.yml
alertmanager.url: "http://10.0.0.14:9093"
[root@mcw04 ~]# /tmp/alertmanager-0.26.0.linux-amd64/amtool  silence add  --comment "xiaoma test1" alertname=InstancesGone service=machangwei01
709516e6-2725-4c15-9280-8871c28dc890
[root@mcw04 ~]# /tmp/alertmanager-0.26.0.linux-amd64/amtool  silence query
ID                                    Matchers                                          Ends At                  Created By  Comment
709516e6-2725-4c15-9280-8871c28dc890  alertname="InstancesGone" service="machangwei01"  2024-02-13 03:30:40 UTC  root        xiaoma test1
[root@mcw04 ~]#
指定作者,指定过期时间24小时。我们可以看到,第二条,就是第二天的结束时间了,命令行默认是当天系统用户创建
[root@mcw04 ~]# /tmp/alertmanager-0.26.0.linux-amd64/amtool  silence add  --comment "xiaoma test2" alertname=InstancesGone service=machangwei02  --author "马昌伟" --duration "24h"
90ad0a5d-5fe4-4da4-996e-fc8a70a87552
[root@mcw04 ~]# /tmp/alertmanager-0.26.0.linux-amd64/amtool  silence query
ID                                    Matchers                                          Ends At                  Created By  Comment
709516e6-2725-4c15-9280-8871c28dc890  alertname="InstancesGone" service="machangwei01"  2024-02-13 03:30:40 UTC  root        xiaoma test1
90ad0a5d-5fe4-4da4-996e-fc8a70a87552  alertname="InstancesGone" service="machangwei02"  2024-02-14 02:45:23 UTC  马昌伟         xiaoma test2
[root@mcw04 ~]#
指定作者,在配置文件里面
[root@mcw04 ~]# vim .config/amtool/config.yml
[root@mcw04 ~]# cat .config/amtool/config.yml
alertmanager.url: "http://10.0.0.14:9093"
author: machangwei@qq.com
comment_required: true
[root@mcw04 ~]# /tmp/alertmanager-0.26.0.linux-amd64/amtool  silence add  --comment "xiaoma test3" alertname=InstancesGone service=machangwei03  --duration "24h"
3742a548-5978-4cd1-9433-9561c5bf6566
[root@mcw04 ~]# /tmp/alertmanager-0.26.0.linux-amd64/amtool  silence query
ID                                    Matchers                                          Ends At                  Created By         Comment
709516e6-2725-4c15-9280-8871c28dc890  alertname="InstancesGone" service="machangwei01"  2024-02-13 03:30:40 UTC  root               xiaoma test1
90ad0a5d-5fe4-4da4-996e-fc8a70a87552  alertname="InstancesGone" service="machangwei02"  2024-02-14 02:45:23 UTC  马昌伟                xiaoma test2
3742a548-5978-4cd1-9433-9561c5bf6566  alertname="InstancesGone" service="machangwei03"  2024-02-14 02:49:58 UTC  machangwei@qq.com  xiaoma test3
[root@mcw04 ~]#
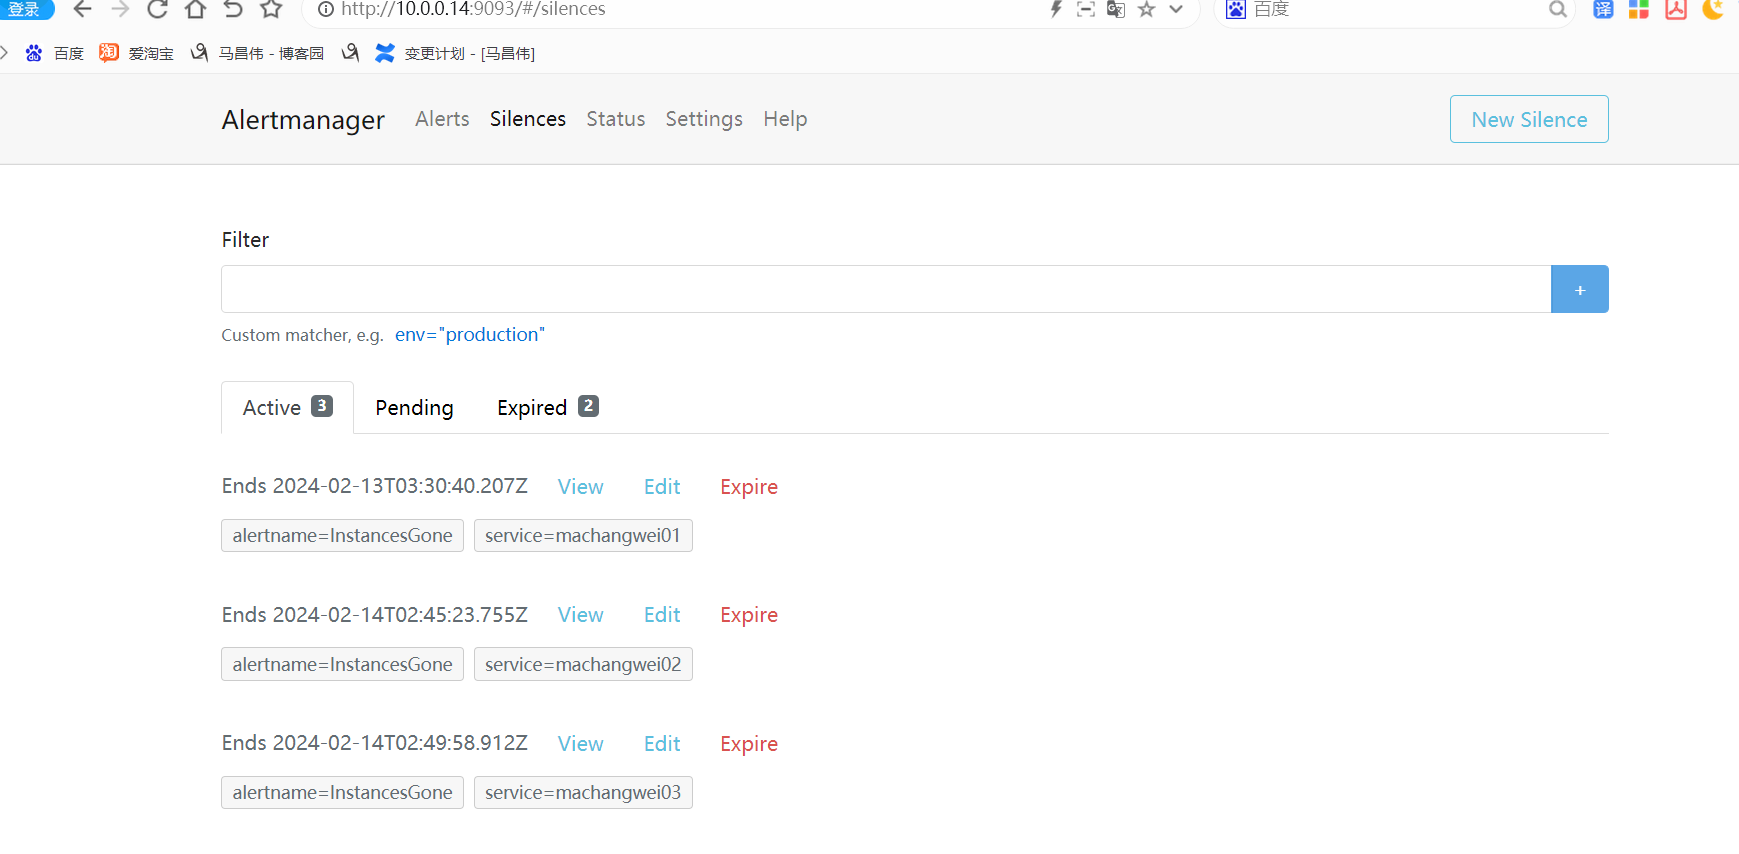

 浙公网安备 33010602011771号