
SSD中anchor理解
import numpy as np
import math
def ssd_anchor_one_layer(img_shape,feat_shape,sizes,ratios,step,offset=0.5,dtype=np.float32):
    """Computer SSD default anchor boxes for one feature layer.

    Determine the relative position grid of the centers, and the relative
    width and height.

    Arguments:
      feat_shape: Feature shape, used for computing relative position grids;
      size: Absolute reference sizes;
      ratios: Ratios to use on these features;
      img_shape: Image shape, used for computing height, width relatively to the
        former;
      offset: Grid offset.

    Return:
      y, x, h, w: Relative x and y grids, and height and width.
    """
    # Compute the position grid: simple way.
    # y, x = np.mgrid[0:feat_shape[0], 0:feat_shape[1]]
    # y = (y.astype(dtype) + offset) / feat_shape[0]
    # x = (x.astype(dtype) + offset) / feat_shape[1]
    # Weird SSD-Caffe computation using steps values...
    #对于第一个特征图(block4:38x38);y=[[0,0,……0],[1,1,……1],……[37,37,……,37]];
    # 而x=[[0,1,2……,37],[0,1,2……,37],……[0,1,2……,37]]
    y, x = np.mgrid[0:feat_shape[0], 0:feat_shape[1]]
    # 可以得到在原图上,相对原图比例大小的每个锚点中心坐标x,y
    # 将38个cell对应锚点框的x,y坐标偏移至每个cell中心,然后乘以相对原图缩放的比例,再除以原图
    y = (y.astype(dtype) + offset) * step / img_shape[0]
    x = (x.astype(dtype) + offset) * step / img_shape[1]
    # Expand dims to support easy broadcasting.
    # 对于第一个特征图,y的shape=38x38x1;x的shape=38x38x1
    y = np.expand_dims(y, axis=-1)
    x = np.expand_dims(x, axis=-1)

    # Compute relative height and width.
    # Tries to follow the original implementation of SSD for the order.
    # 该特征图上每个点对应的锚点框数量;如:对于第一个特征图每个点预测4个锚点框(block4:38x38),
    #num_anchors :2+2=4
    num_anchors = len(sizes) + len(ratios)
    # 对于第一个特征图,h的shape=4x;w的shape=4x
    h = np.zeros((num_anchors, ), dtype=dtype)
    w = np.zeros((num_anchors, ), dtype=dtype)
    # Add first anchor boxes with ratio=1.
    # 第一个锚点框的高h[0]=起始锚点的高/原图大小的高;例如:h[0]=21/300
    h[0] = sizes[0] / img_shape[0]
    # 第一个锚点框的宽w[0]=起始锚点的宽/原图大小的宽;例如:w[0]=21/300
    w[0] = sizes[0] / img_shape[1]
    di = 1 #锚点宽个数偏移
    if len(sizes) > 1:
        # 第二个锚点框的高h[1]=sqrt(起始锚点的高*起始锚点的宽)/原图大小的高;例如:h[1]=sqrt(21*45)/300
        h[1] = math.sqrt(sizes[0] * sizes[1]) / img_shape[0]
        # 第二个锚点框的高w[1]=sqrt(起始锚点的高*起始锚点的宽)/原图大小的宽;例如:w[1]=sqrt(21*45)/300
        w[1] = math.sqrt(sizes[0] * sizes[1]) / img_shape[1]
        di += 1
    for i, r in enumerate(ratios):
        # 遍历长宽比例,第一个特征图,r只有两个,2和0.5;共四个锚点宽size(h[0]~h[3])
        # 例如:对于第一个特征图,h[0+2]=h[2]=21/300/sqrt(2);w[0+2]=w[2]=45/300*sqrt(2)
        # 例如:对于第一个特征图,h[1+2]=h[3]=21/300/sqrt(0.5);w[1+2]=w[3]=45/300*sqrt(0.5)
        # 返回没有归一化前的锚点坐标和尺寸
        h[i+di] = sizes[0] / img_shape[0] / math.sqrt(r)
        w[i+di] = sizes[0] / img_shape[1] * math.sqrt(r)
    return y, x, h, w
y, x, h, w = ssd_anchor_one_layer((300,300),(38,38),(21., 45.),[2, .5],8)
print(h)
print(w)
[0.07 0.10246951 0.04949747 0.09899495]
[0.07 0.10246951 0.09899495 0.04949747]
其中第一个38*38的特征图,每个点产生4个anchor,分别为0.07和0.102的正方形两个,宽高分别为0.049、0.098的长方形两个。
Loss函数计算
SSD的Loss函数包含两项:(1)预测类别损失(2)预测位置偏移量损失:
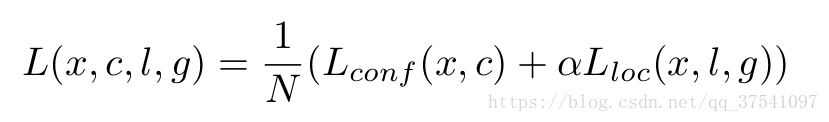
Loss中的N代表着被挑选出来的默认框正样本个数,L(los)即位置偏移量损失是Smooth L1 loss(是默认框与GTbox之间的位置偏移与网络预测出的位置偏移量之间的损失),L(conf)即预测类别损失是多类别softmax loss,α的值设置为1. Smooth L1 loss定义为:

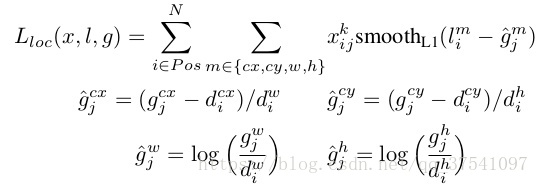
L(los)损失函数的定义为:
根据函数定义我们可以看到L(los)损失函数主要有四部分:中心坐标cx的偏移量损失,中心点坐标cy的偏移损失,宽度w的缩放损失以及高度h的缩放损失。式中的l表示的是预测的坐标偏移量,g表示的是默认框与之匹配的GTbox的坐标偏移量。
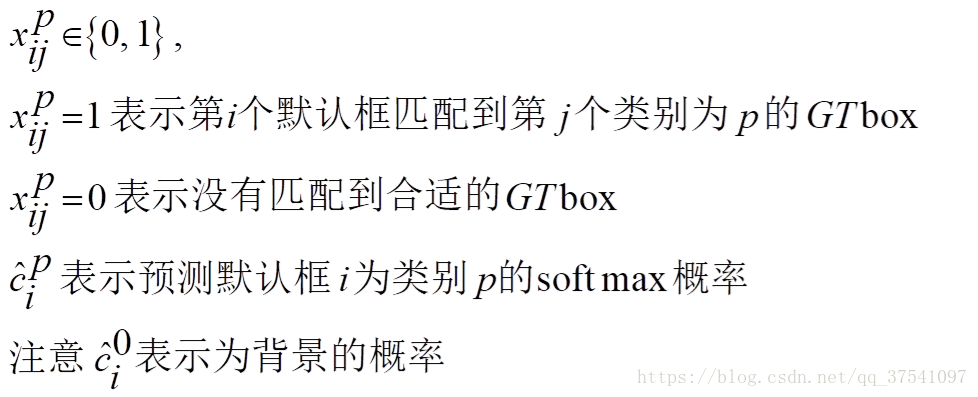
L(conf)多类别softmax loss损失定义为:

根据函数定义我们可以看到L(conf)损失由两部分组成:正样本(Pos)损失和负样本(Neg)损失。
参考:https://blog.csdn.net/u010712012/article/details/86555814

 浙公网安备 33010602011771号