5.线性回归算法
1.本节重点知识点用自己的话总结出来,可以配上图片,以及说明该知识点的重要性
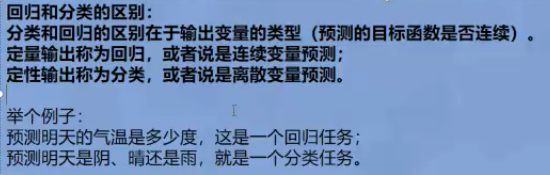
回归和分类的区别:
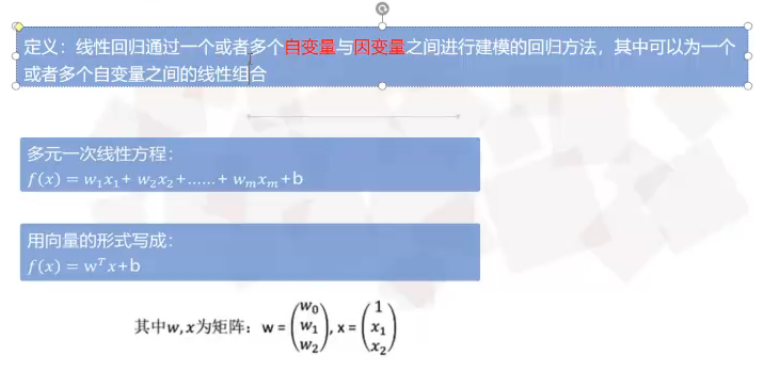
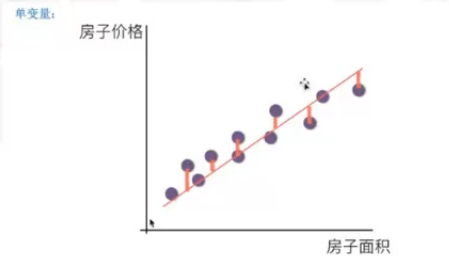
线性回归的定义
机器预测和真实值也是存在一定误差的
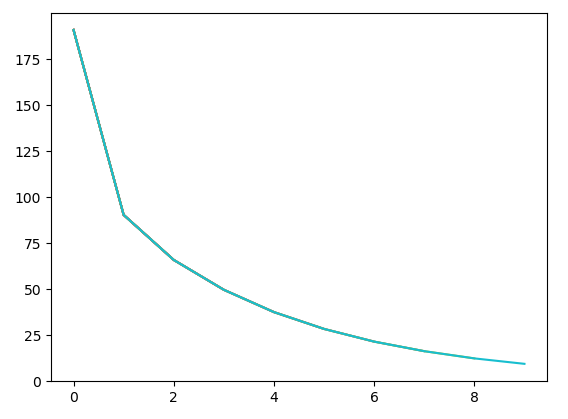
通过迭代算法来减少误差

梯度下降:

import random
import matplotlib.pyplot as plt

xs = [0.1*x for x in range(0, 10)]
ys = [12*i*4 for i in xs]
print(xs)
print(ys)

w = random.random()
b = random.random()
a1 = []
b1 = []

for i in range(10):
    for x, y in zip(xs, ys):
        o = w*x+b   # 预测值
        e = (o-y)
        loss = e**2  # 损失值
        dw = 2*e*x
        db = 2*e*1
        w = w-0.1*dw
        b = b-0.1*db
        print('loss={0},w={1},b={2}'. format(loss, w, b)) # 损失值越小越好
    a1.append(i)
    b1.append(loss)
    plt.plot(a1, b1)
    plt.pause(0.1)
plt.show()
运行结果:
2.思考线性回归算法可以用来做什么?(大家尽量不要写重复)
(1)学生成绩排名预测
(2)中国人口增长分析
(3)房地产销售影响因素分析等
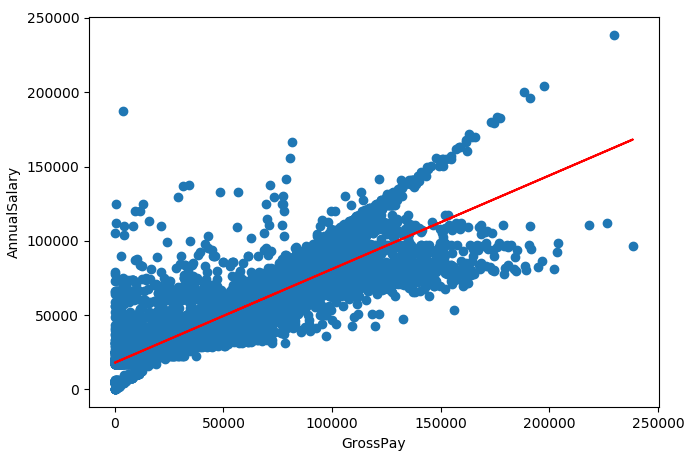
3.自主编写线性回归算法 ,数据可以自己造,或者从网上获取。(加分题)
import pandas as pd
import matplotlib.pyplot as plt

data = pd.read_csv('city.csv', index_col=0)  # 读取数据
data.dropna(inplace=True)

# 线型回归
from sklearn.linear_model import LinearRegression

regr = LinearRegression()  # 构建模型
regr.fit(data[['GrossPay']], data['AnnualSalary'])
print('权值:', regr.coef_, '截距:', regr.intercept_)

plt.scatter(data['GrossPay'].values, data['AnnualSalary'].values)
plt.plot(data[['GrossPay']].values, regr.predict(data[['GrossPay']].values), c='r')
plt.xlabel('GrossPay')
plt.ylabel('AnnualSalary')
plt.show()
运行结果:


 浙公网安备 33010602011771号