centos 安装ELK
一、安装elasticsearch
jdk: (build 1.8.0_151-b12)
elasticsearch:5.5.1
注意的问题:jdk 版本 版本不能过低必须是1.8
root 用户不能启动es ,必须新建一个用户
#1# centos 完整新增用户 赋权:
https://blog.csdn.net/u010454261/article/details/70227164
下载解压
wget https://artifacts.elastic.co/downloads/elasticsearch/elasticsearch-5.5.1.zip
unzip elasticsearch-5.5.1.zip
新增用户组 新增用户
groupadd elsearch
useradd elsearch -g elsearch -p elasticsearch
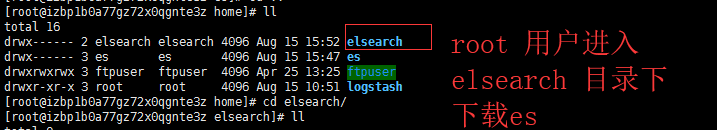
注意文件要放到对应的用户目录下
### 修改版
root用户在es所在目录执行
chmod -R 777 (当前目录)./
然后切换到其他用户也可以
# 解压 tar -xzf elasticsearch-5.5.1.tar.gz
# 进入文件 cd elasticsearch-5.5.1/
给用户赋权
chown -R elsearch:elsearch elasticsearch-5.5.1
切换用户
su - elsearch
启动
bin/elasticsearch
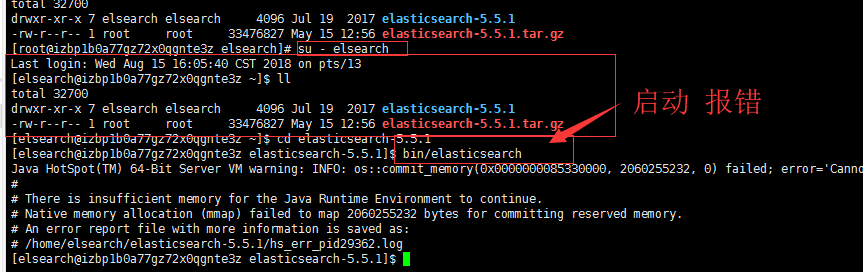
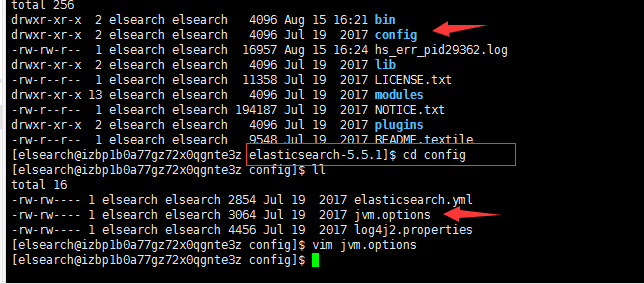
由于elasticsearch5.0默认分配jvm空间大小为2g,修改jvm空间分配
修改elasticsearch config
[elsearch@izbp1b0a77gz72x0qgnte3z config]$   cd ..
[elsearch@izbp1b0a77gz72x0qgnte3z elasticsearch-5.5.1]$ bin/elasticsearch
再次启动
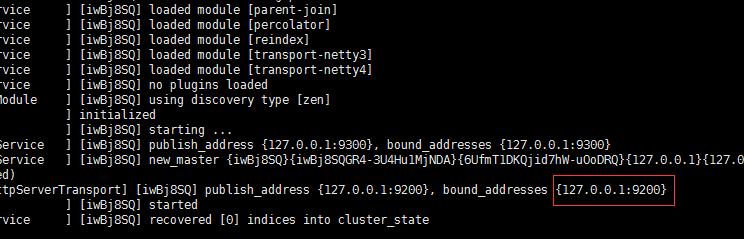
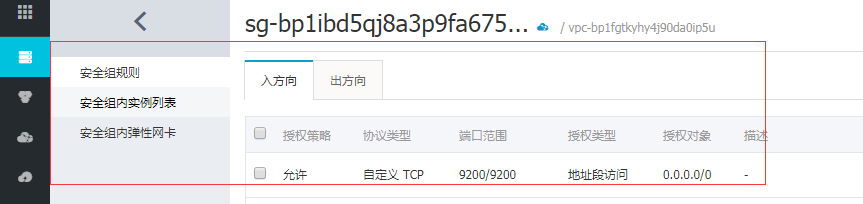
启动成功,发现不能远程访问,修改配合文件
Exception in thread "main" BindTransportException[Failed to bind to [9300-9400]];
nested: ChannelException[Failed to bind to: /192.168.0.1:9400]; nested: BindException[Cannot assign requested address];
Likely root cause: java.net.BindException: Cannot assign requested address
报错
修改配置文件 config/elasticsearch.yml

network.host: 0.0.0.0
(注意开放9200端口)
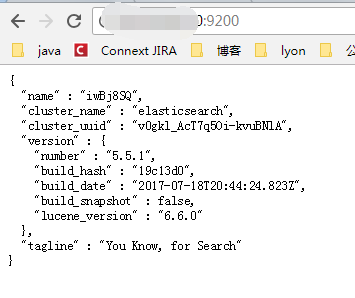
再次启动
后台启动:
nohup./bin/elasticsearch&
二、LogStash 的安装运行
wget https://artifacts.elastic.co/downloads/logstash/logstash-5.5.1.tar.gz

tar zxvf logstash-5.5.1.tar.gz
新建配置文件
vim mystash.conf
input {
  tcp {
    port => 4560
    codec => "json"
  }
}

output {
  Elasticsearch {
    hosts => ["118.24.12.141:9200"]
    index => "logstash-%{+YYYY.MM}"
  }
}
bin/logstash -f mystash.conf --config.reload.automatic
通过配置文件启动吧报错
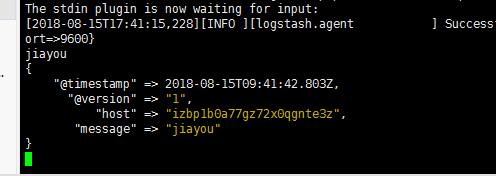
无配置启动, 端口是9600 网上说默认是5044
bin/logstash -e 'input{stdin{}} output{stdout{codec=>rubydebug}}'
启动报错
bin/logstash -f mystash.conf --config.reload.automatic
去掉 --config.reload.automatic ok了
三、安装运行 FileBeats
wget https://artifacts.elastic.co/downloads/beats/filebeat/filebeat-5.5.1-linux-x86_64.tar.gz

tar zxvf filebeat-5.5.1-linux-x86_64.tar.gz
进入目录编辑 filebeat.yml 找到对应的配置项,配置如下

配置对应的端口主机
- type: log
   # Change to true to enable this prospector configuration.
    enabled: True

    # Paths that should be crawled and fetched. Glob based paths.
    # 读取 Nginx 的日志
    paths:
      - /usr/local/nginx/logs/*.log

#----------------------------- Logstash output --------------------------------
# 输出到本机的 LogStash
output.logstash:
  # The Logstash hosts
  hosts: ["localhost:5044"]
配置完成后执行如下命令,启动 FileBeat 即可
# FileBeat 需要以 root 身份启动,因此先更改配置文件的权限
sudo chown root filebeat.yml
sudo ./filebeat -e -c filebeat.yml -d "publish"
root用户直接运行
三. Kibana 的安装运行
wgethttps://artifacts.elastic.co/downloads/kibana/kibana-5.5.1-linux-x86_64.tar.gz
tar zxvf kibana-5.5.1-linux-x86_64.tar.gz
# 直接启动即可
bin/kibana
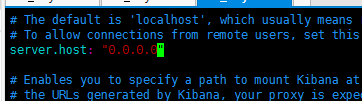
启动外网无法访问
将$KIBANA/config/kibaba.yml下的

server.host: "localhost" 更改为

server.host: "0.0.0.0" 就可以了
访问:
ip:5601
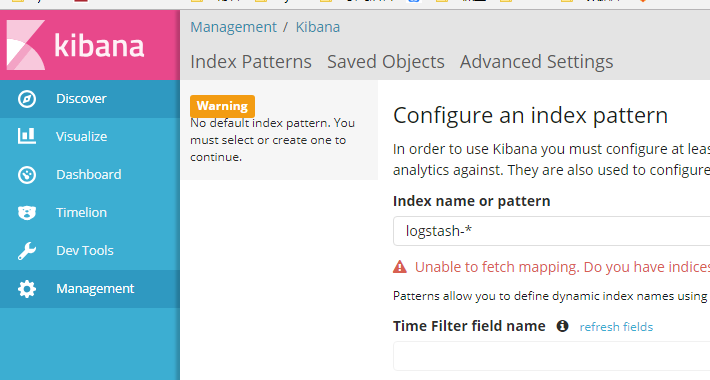
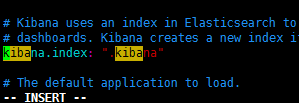
kibana.index: ".kibana"
----------- java 将日志写入logstash
参考:https://www.cnblogs.com/zhyg/p/6994314.html

 浙公网安备 33010602011771号