
(转)python性能检测工具整理
python 运行后出现core dump产生core.**文件,可通过gdb来调试
Using GDB with a core dump

having found build/python/core.22608, we can now launch GDB:

gdb programname coredump
i.e.

gdb /usr/bin/python2 build/python/core.22608
A lot of information might scroll by.

At the end, you're greeted by the GDB prompt:

(gdb)
Getting a backtrace

Typically, you'd just get a backtrace (or shorter, bt). A backtrace is simply the hierarchy of functions that were called.

 (gdb)bt
[...] skipped,

Frame #2 and following definitely look like they're part of the Python implementation -- that sounds bad, because GDB doesn't itself know how to debug python, but luckily, there's an extension to do that. So we can try to use py-bt:

(gdb) py-bt
If we get a undefined command error, we must stop here and make sure that the python development package is installed (python-devel on Redhatoids, python2.7-dev on Debianoids); for some systems, you should append the content of /usr/share/doc/{python-devel,python2.7-dev}/gdbinit[.gz] to your ~/.gdbinit, and re-start gdb.

The output of py-bt now states clearly which python lines correspond to which stack frame (skipping those stack frames that are hidden to python, because they are in external libraries or python-implementation routines)

...
分析程序的性能可以归结为回答四个基本问题:
-
正运行的多快
-
速度瓶颈在哪里
-
内存使用率是多少
-
内存泄露在哪里
用 time 粗粒度的计算时间
$ time python yourprogram.py
real    0m1.028s
user    0m0.001s
sys     0m0.003s
上面三个输入变量的意义在文章 stackoverflow article 中有详细介绍。简单的说:
- real - 表示实际的程序运行时间
- user - 表示程序在用户态的cpu总时间
- sys - 表示在内核态的cpu总时间
通过sys和user时间的求和,你可以直观的得到系统上没有其他程序运行时你的程序运行所需要的CPU周期。
若sys和user时间之和远远少于real时间,那么你可以猜测你的程序的主要性能问题很可能与IO等待相关。
使用计时上下文管理器进行细粒度计时
我们的下一个技术涉及访问细粒度计时信息的直接代码指令。这是一小段代码,我发现使用专门的计时测量是非常重要的:
timer.py
import time

class Timer(object):
    def __init__(self, verbose=False):
        self.verbose = verbose

    def __enter__(self):
        self.start = time.time()
        return self

    def __exit__(self, *args):
        self.end = time.time()
        self.secs = self.end - self.start
        self.msecs = self.secs * 1000  # millisecs
        if self.verbose:
            print 'elapsed time: %f ms' % self.msecs
为了使用它,使用 Python 的 with 关键字和 Timer 上下文管理器来包装你想计算的代码。当您的代码块开始执行,它将照顾启动计时器,当你的代码块结束的时候,它将停止计时器。
这个代码片段示例:
from timer import Timer
from redis import Redis
rdb = Redis()

with Timer() as t:
    rdb.lpush("foo", "bar")
print "=> elasped lpush: %s s" % t.secs

with Timer() as t:
    rdb.lpop("foo")
print "=> elasped lpop: %s s" % t.secs
我经常将这些计时器的输出记录到文件中,这样就可以观察我的程序的性能如何随着时间进化。
使用分析器逐行统计时间和执行频率
Robert Kern有一个称作line_profiler的不错的项目,我经常使用它查看我的脚步中每行代码多快多频繁的被执行。
想要使用它,你需要通过pip安装该python包:
pip install line_profiler
安装完成后,你将获得一个新模块称为 line_profiler 和 kernprof.py 可执行脚本。
为了使用这个工具,首先在你想测量的函数上设置 @profile 修饰符。不用担心,为了这个修饰符,你不需要引入任何东西。kernprof.py 脚本会在运行时自动注入你的脚本。
primes.py
@profile
def primes(n):
    if n==2:
        return [2]
    elif n<2:
        return []
    s=range(3,n+1,2)
    mroot = n ** 0.5
    half=(n+1)/2-1
    i=0
    m=3
    while m <= mroot:
        if s[i]:
            j=(m*m-3)/2
            s[j]=0
            while j<half:
                s[j]=0
                j+=m
        i=i+1
        m=2*i+3
    return [2]+[x for x in s if x]
primes(100)
一旦你得到了你的设置了修饰符 @profile 的代码,使用 kernprof.py 运行这个脚本。
kernprof.py -l -v fib.py
-l 选项告诉 kernprof 把修饰符 @profile 注入你的脚本,-v 选项告诉 kernprof 一旦你的脚本完成后,展示计时信息。这是一个以上脚本的类似输出:
Wrote profile results to primes.py.lprof
Timer unit: 1e-06 s

File: primes.py
Function: primes at line 2
Total time: 0.00019 s

Line #      Hits         Time  Per Hit   % Time  Line Contents
==============================================================
     2                                           @profile
     3                                           def primes(n):
     4         1            2      2.0      1.1      if n==2:
     5                                                   return [2]
     6         1            1      1.0      0.5      elif n<2:
     7                                                   return []
     8         1            4      4.0      2.1      s=range(3,n+1,2)
     9         1           10     10.0      5.3      mroot = n ** 0.5
    10         1            2      2.0      1.1      half=(n+1)/2-1
    11         1            1      1.0      0.5      i=0
    12         1            1      1.0      0.5      m=3
    13         5            7      1.4      3.7      while m <= mroot:
    14         4            4      1.0      2.1          if s[i]:
    15         3            4      1.3      2.1              j=(m*m-3)/2
    16         3            4      1.3      2.1              s[j]=0
    17        31           31      1.0     16.3              while j<half:
    18        28           28      1.0     14.7                  s[j]=0
    19        28           29      1.0     15.3                  j+=m
    20         4            4      1.0      2.1          i=i+1
    21         4            4      1.0      2.1          m=2*i+3
    22        50           54      1.1     28.4      return [2]+[x for x
寻找 hits 值比较高的行或是一个高时间间隔。这些地方有最大的优化改进空间。
程序使用了多少内存?
现在我们对计时有了较好的理解,那么让我们继续弄清楚程序使用了多少内存。我们很幸运,Fabian Pedregosa模仿Robert Kern的line_profiler实现了一个不错的内存分析器。
首先使用pip安装:
$ pip install -U memory_profiler
$ pip install psutil
(这里建议安装psutil包,因为它可以大大改善memory_profiler的性能)。
就像line_profiler,memory_profiler也需要在感兴趣的函数上面装饰@profile装饰器:
@profile
def primes(n):
    ...
    ...
运行如下命令来显示你的函数使用了多少内存:
$ python -m memory_profiler primes.py
一旦你的程序退出,你应该可以看到这样的输出:
Filename: primes.py

Line #    Mem usage  Increment   Line Contents
==============================================
     2                           @profile
     3    7.9219 MB  0.0000 MB   def primes(n):
     4    7.9219 MB  0.0000 MB       if n==2:
     5                                   return [2]
     6    7.9219 MB  0.0000 MB       elif n<2:
     7                                   return []
     8    7.9219 MB  0.0000 MB       s=range(3,n+1,2)
     9    7.9258 MB  0.0039 MB       mroot = n ** 0.5
    10    7.9258 MB  0.0000 MB       half=(n+1)/2-1
    11    7.9258 MB  0.0000 MB       i=0
    12    7.9258 MB  0.0000 MB       m=3
    13    7.9297 MB  0.0039 MB       while m <= mroot:
    14    7.9297 MB  0.0000 MB           if s[i]:
    15    7.9297 MB  0.0000 MB               j=(m*m-3)/2
    16    7.9258 MB -0.0039 MB               s[j]=0
    17    7.9297 MB  0.0039 MB               while j<half:
    18    7.9297 MB  0.0000 MB                   s[j]=0
    19    7.9297 MB  0.0000 MB                   j+=m
    20    7.9297 MB  0.0000 MB           i=i+1
    21    7.9297 MB  0.0000 MB           m=2*i+3
    22    7.9297 MB  0.0000 MB       return [2]+[x for x in s if x]
line_profiler和memory_profiler的IPython快捷方式
memory_profiler和line_profiler有一个鲜为人知的小窍门,两者都有在IPython中的快捷命令。你需要做的就是在IPython会话中输入以下内容:
%load_ext memory_profiler

%load_ext line_profiler
在这样做的时候你需要访问魔法命令%lprun和%mprun,它们的行为类似于他们的命令行形式。主要区别是你不需要使用@profiledecorator来修饰你要分析的函数。只需要在IPython会话中像先前一样直接运行分析:
In [1]: from primes import primes
In [2]: %mprun -f primes primes(1000)
In [3]: %lprun -f primes primes(1000)
这可以节省你大量的时间和精力,因为使用这些分析命令,你不需要修改你的源代码。
内存泄漏在哪里?
cPython解释器使用引用计数做为记录内存使用的主要方法。这意味着每个对象包含一个计数器,当某处对该对象的引用被存储时计数器增加,当引用被删除时计数器递减。当计数器到达零时,cPython解释器就知道该对象不再被使用,所以删除对象,释放占用的内存。
如果程序中不再被使用的对象的引用一直被占有,那么就经常发生内存泄漏。
查找这种“内存泄漏”最快的方式是使用Marius Gedminas编写的objgraph,这是一个极好的工具。该工具允许你查看内存中对象的数量,定位含有该对象的引用的所有代码的位置。
一开始,首先安装objgraph:
pip install objgraph
一旦你已经安装了这个工具,在你的代码中插入一行声明调用调试器:
import pdb; pdb.set_trace()
最普遍的对象是哪些?
在运行的时候,你可以通过执行下述指令查看程序中前20个最普遍的对象:
pdb) import objgraph
(pdb) objgraph.show_most_common_types()

MyBigFatObject             20000
tuple                      16938
function                   4310
dict                       2790
wrapper_descriptor         1181
builtin_function_or_method 934
weakref                    764
list                       634
method_descriptor          507
getset_descriptor          451
type                       439
哪些对象已经被添加或删除?
我们也可以查看两个时间点之间那些对象已经被添加或删除:
(pdb) import objgraph
(pdb) objgraph.show_growth()
.
.
.
(pdb) objgraph.show_growth()   # this only shows objects that has been added or deleted since last show_growth() call

traceback                4        +2
KeyboardInterrupt        1        +1
frame                   24        +1
list                   667        +1
tuple                16969        +1
谁引用着泄漏的对象?
继续,你还可以查看哪里包含给定对象的引用。让我们以下述简单的程序做为一个例子:
x = [1]
y = [x, [x], {"a":x}]
import pdb; pdb.set_trace()
为了看到持有变量 X 的引用是什么,运行 objgraph.show_backref() 函数:
(pdb) import objgraph
(pdb) objgraph.show_backref([x], filename="/tmp/backrefs.png")
该命令的输出是一个 PNG 图片,被存储在 /tmp/backrefs.png,它应该看起来像这样:
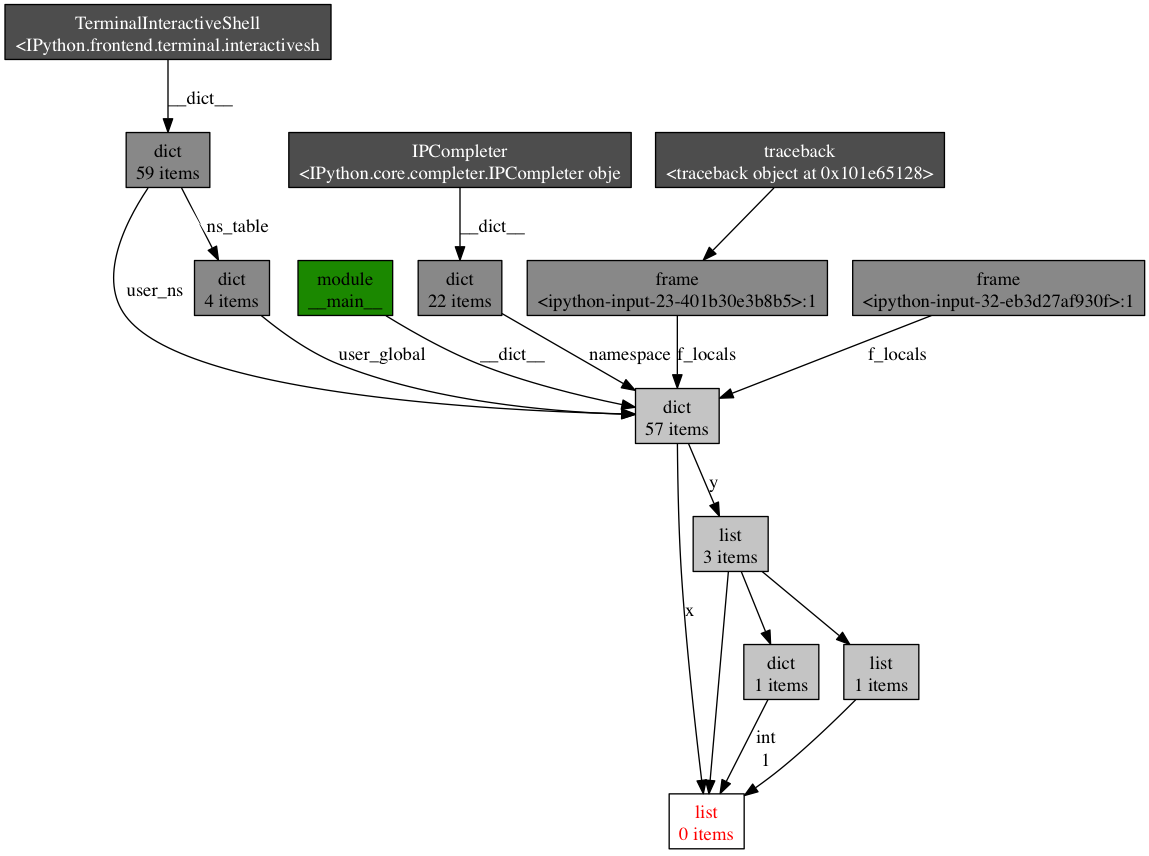
最下面有红字的盒子是我们感兴趣的对象。我们可以看到,它被符号x引用了一次,被列表y引用了三次。如果是x引起了一个内存泄漏,我们可以使用这个方法,通过跟踪它的所有引用,来检查为什么它没有自动的被释放。
回顾一下,objgraph 使我们可以:
- 显示占据python程序内存的头N个对象
- 显示一段时间以后哪些对象被删除活增加了
- 在我们的脚本中显示某个给定对象的所有引用
努力与精度
在本帖中,我给你显示了怎样用几个工具来分析python程序的性能。通过这些工具与技术的武装,你可以获得所有需要的信息,来跟踪一个python程序中大多数的内存泄漏,以及识别出其速度瓶颈。
对许多其他观点来说,运行一次性能分析就意味着在努力目标与事实精度之间做出平衡。如果感到困惑,那么就实现能适应你目前需求的最简单的解决方案。
参考
- stack overflow - time explained(堆栈溢出 - 时间解释)
- line_profiler(线性分析器)
- memory_profiler(内存分析器)
- objgraph(对象图)
补充部分工具使用方法
cProfile
cProfile是Python标准库中包含的profile工具,使用方式如下,
import cProfile
import pstats

profile = cProfile.Profile()
profile.enable()
# your code hear
# ...
profile.disable()
pstats.Stats(profile).dump_stats('profile.prof')
需要profile的代码放在enable/disable两个函数调用之间,profile结果通过pstats导出到文件。实际开发中可以让待profile的程序支持接收指令,动态开启与关闭profile。
除了上面这个调用方法外,还可以使用run方法,或是在命令行下以-m方式加载cProfile,
def foobar():
  print 'foobar'

profile.run('foobar()')
python -m cProfile [-o output_file] [-s sort_order] myscript.py
pstats导出的结果可以用一些可视化工具查看。个人推荐通过PyCharm提供的Open cProfile Snapshots这个功能来进行查看。不仅能够看到函数之间的调用关系,也可以直接进行代码跳转。
line_profiler
line_profiler可以进一步显示Python函数每一行的用时开销,
import line_profiler
import sys


def foo():
    for x in xrange(100):
        print x


profiler = line_profiler.LineProfiler(foo)
profiler.enable()
foo()
profiler.disable()
profiler.print_stats(sys.stdout)
Line #      Hits         Time  Per Hit   % Time  Line Contents
==============================================================
     8                                           def foo():
     9       101           44      0.4     15.4      for x in xrange(100):
    10       100          242      2.4     84.6          print x
objgraph
objgraph是一个非常轻巧的工具,但在排查内存泄露的时候非常有用。objgraph的代码很短,只有一个文件,其主要依靠标准库中的gc模块来获取对象之间的创建引用关系。objgraph使用起来十分简单,
# 列出最多实例的类型
objgraph.show_most_common_types(shortnames=False)
# 显示两次调用之间的对象数量变化
objgraph.show_growth(limit=None)
# 获取指定类型的对象
objgraph.by_type('Foobar')
# 查找反向引用
objgraph.find_backref_chain(obj, objgraph.is_proper_module)
...
在遇到内存泄露问题时候首先考虑下用objgraph来进行查看,没有问题的时候也可以学习下它的代码,可以极大了解gc模块的应用。
tracemalloc
tracemalloc是用来分析Python程序内存分配的工具,使用上也很简单,
import tracemalloc
tracemalloc.start()

# ... run your application ...

snapshot = tracemalloc.take_snapshot()
top_stats = snapshot.statistics('lineno')
snapshot结果中可以看到每个模块最终创建分配的内存大小,在追查内存问题上很有帮助。Python 3.5.x之后将tracemalloc集成到了标准库当中,PEP-454。
英文:Huy Nguyen
译文:yexiaobai
链接:segmentfault.com/a/1190000000616798
补充工具原文地址 http://blog.soliloquize.org/2016/06/17/Python-Profile%E5%B7%A5%E5%85%B7%E6%8B%BE%E9%81%97/

 浙公网安备 33010602011771号