

Logistic Regression
使hypotheses hθ(x) to satisfy 0≤hθ(x)≤1.
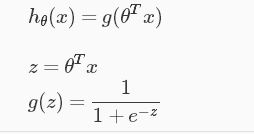
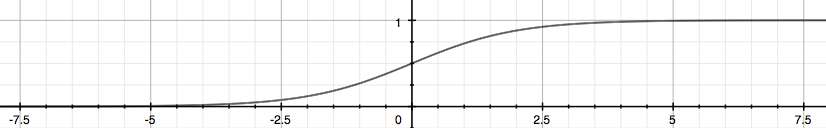
z > 0,g(z) > 0.5 ,y=1;
z< 0,g(z) < 0.5 ,y=0;
Cost Function:

When y = 1, we get the following plot for J(θ) vs hθ(x):

Similarly, when y = 0, we get the following plot for J(θ) vs hθ(x):

Cost(hθ(x),y) = 0 if hθ(x) = y;
Cost(hθ(x),y) ->∞ if y = 0 and hθ(x) ->1 或
者y
= 1 and hθ(x) ->0.
Simplified Cost Function:
Cost(hθ(x),y)=−ylog(hθ(x))−(1−y)log(1−hθ(x))
y = 1 时,Cost(hθ(x),y) = −log(hθ(x));
y = 0时, Cost(hθ(x),y) = -log(1−hθ(x));
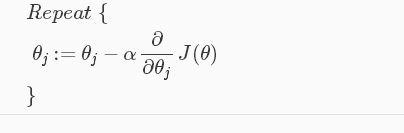
Gradient Descent
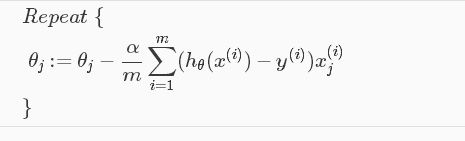
向量化:θ:=θ−(α/m) XT(g(Xθ)−y⃗ )

 浙公网安备 33010602011771号