03-echarts中的其它图表
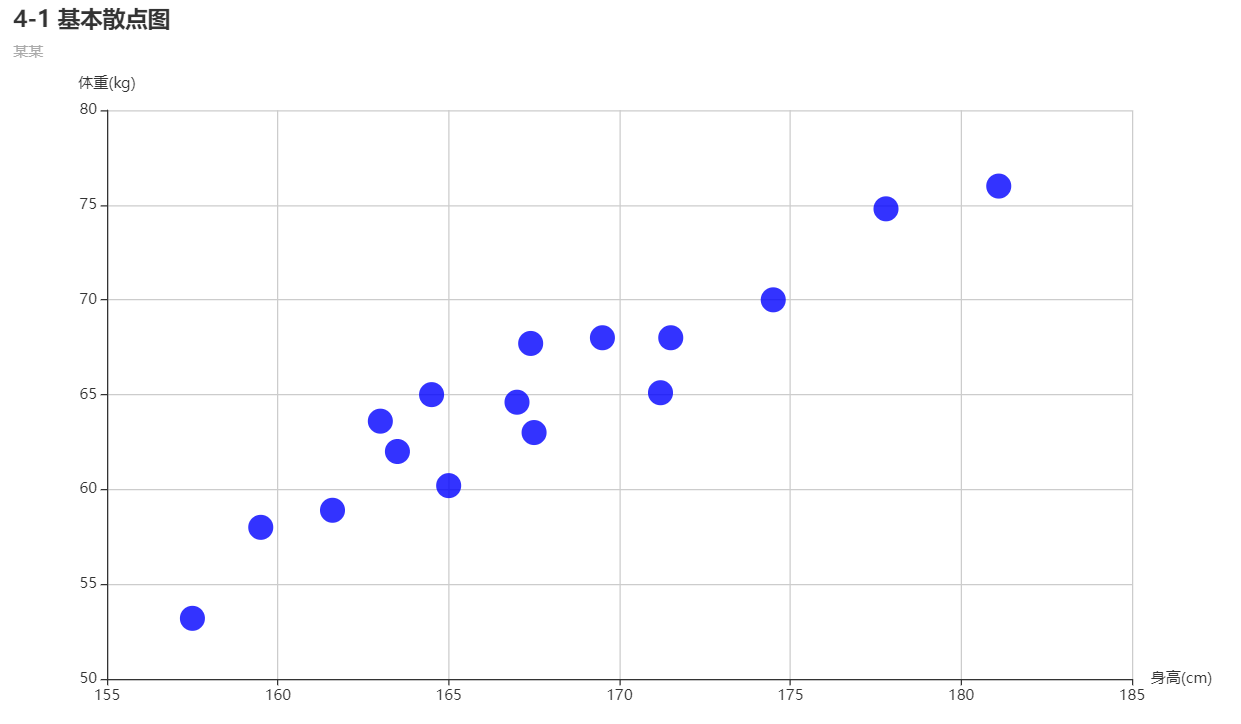
1. 基本散点图
<!DOCTYPE html>
<html lang="en">

<head>
    <meta charset="UTF-8">
    <meta http-equiv="X-UA-Compatible" content="IE=edge">
    <meta name="viewport" content="width=device-width, initial-scale=1.0">
    <title>4-1-基本散点图</title>
</head>

<body>
    <script src="js/echarts.js"></script>
    <div id="box" style="width: 1000px;height: 600px"></div>
    <script>
        var myChart = echarts.init(document.getElementById("box"));
        var option = {
            title: {
                text: '4-1 基本散点图',
                subtext: '某某',
            },
            color: ['blue', 'green'],
            grid: {
                // left: '3%',
                // right: '4%',
                // bottom: '3%',
                // containLabel: true
                x: 80, y: 85
            },
            xAxis: { scale: true, name: '身高(cm)', color: 'red' },
            yAxis: { scale: true, name: '体重(kg)' },
            series: [
                {
                    type: 'scatter',
                    symbolSize: 20,
                    data: [
                        [167.0, 64.6], [177.8, 74.8], [159.5, 58.0], [169.5, 68.0],
                        [163.0, 63.6], [157.5, 53.2], [164.5, 65.0], [163.5, 62.0],
                        [171.2, 65.1], [161.6, 58.9], [167.4, 67.7], [167.5, 63.0],
                        [181.1, 76.0], [165.0, 60.2], [174.5, 70.0], [171.5, 68.0],
                    ]
                }
            ]
        };
        myChart.setOption(option);
    </script>
</body>

</html>
运行效果:
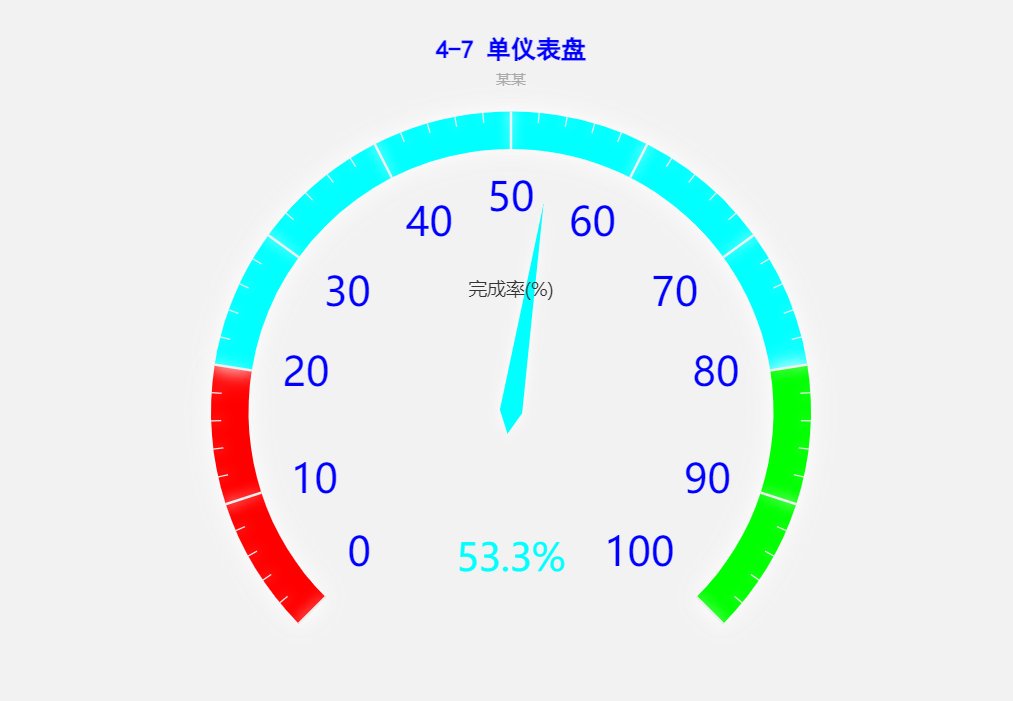
2. 单仪表盘
<!DOCTYPE html>
<html lang="en">

<head>
    <meta charset="UTF-8">
    <meta http-equiv="X-UA-Compatible" content="IE=edge">
    <meta name="viewport" content="width=device-width, initial-scale=1.0">
    <title>4-7 单仪表盘</title>
</head>

<body>
    <script src="js/echarts.js"></script>
    <div id="box" style="width: 1000px;height: 600px"></div>
    <script>
        var myChart = echarts.init(document.getElementById("box"));
        var color1 = [
            [0.2, "rgba(255,0,0,1)"],
            [0.8, "rgba(0,255,255,1)"],
            [1, "rgba(0,255,0,1)"]
        ];
        var data1 = [
            {
                name: "完成率(%)",
                value: 50,
            }
        ];
        var option = {
            backgroundColor: 'rgba(128,128,128,0.1)',
            title: {
                text: '4-7 单仪表盘',
                subtext: '某某',
                x: 'center',
                y: 25,
                show: true,
                offsetCenter: [50, "20%"],
                textStyle: {
                    color: 'blue',
                    fontSize: 20,
                    fontFamily: '黑体'
                }
            },
            tooltip: {
                show: true,
                formatter: "{b}: {c}%",
                backgroundColor: 'rgba(255,0,0,0.8)',
                borderColor: '#333',
                borderWidth: 0,
                padding: 5,
                // textStyle: {   设置提示框浮层的文本样式

                // }
            },
            series: [
                {
                    name: "单仪表盘示例",
                    radius: "80%",
                    center: ["50%", "55%"],
                    startAngle: 225,
                    endAngle: -45,
                    clockwise: true,
                    max: 100,
                    min: 0,
                    splitNumber: 10,
                    type: 'gauge',
                    axisLine: {
                        show: true,
                        lineStyle: {
                            width: 30,
                            color: color1,
                            opacity: 1,
                            shadowBlur: 20,
                            shadowColor: "#fff",
                        }
                    },
                    splitLine: {
                        show: true,
                        length: 30,
                        lineStyle: {
                            color: '#eee',
                            width: 2,
                            opacity: 1,
                            shadowBlur: 10,
                            shadowColor: "#fff",
                        }
                    },
                    axisTick: {
                        show: true,
                        length: 8,
                        splitNumber: 5,
                        lineStyle: {
                            color: '#eee',
                            width: 1,
                            opacity: 1,
                            type: "solid",
                            shadowBlur: 10,
                            shadowColor: "#fff",
                        }
                    },
                    axisLabel: {
                        show: true,
                        color: 'blue',
                        distance: 25,
                        fontSize: 32,
                        formatter: "{value}"
                    },
                    pointer: {
                        show: true,
                        width: 9,
                        length: "70%"
                    },
                    itemStyle: {
                        color: 'auto',
                        opacity: 1,
                        borderType: "solid",
                        borderColor: '#000',
                        borderWidth: 0,
                        shadowBlur: 10,
                        shadowColor: "#fff",
                    },
                    emphasis: {
                        itemStyle: {

                        }
                    },
                    detail: {
                        show: true,
                        offsetCenter: [0, "50%"],
                        formatter: '{value}%',
                        fontSize: 30,
                        color: 'auto'
                    },
                    data: data1
                }
            ]
        };
        setInterval(function () {
            option.series[0].data[0].value = (Math.random() * 100).toFixed(2);
            myChart.setOption(option,true);
        }, 2000);
    </script>
</body>

</html>
运行效果:
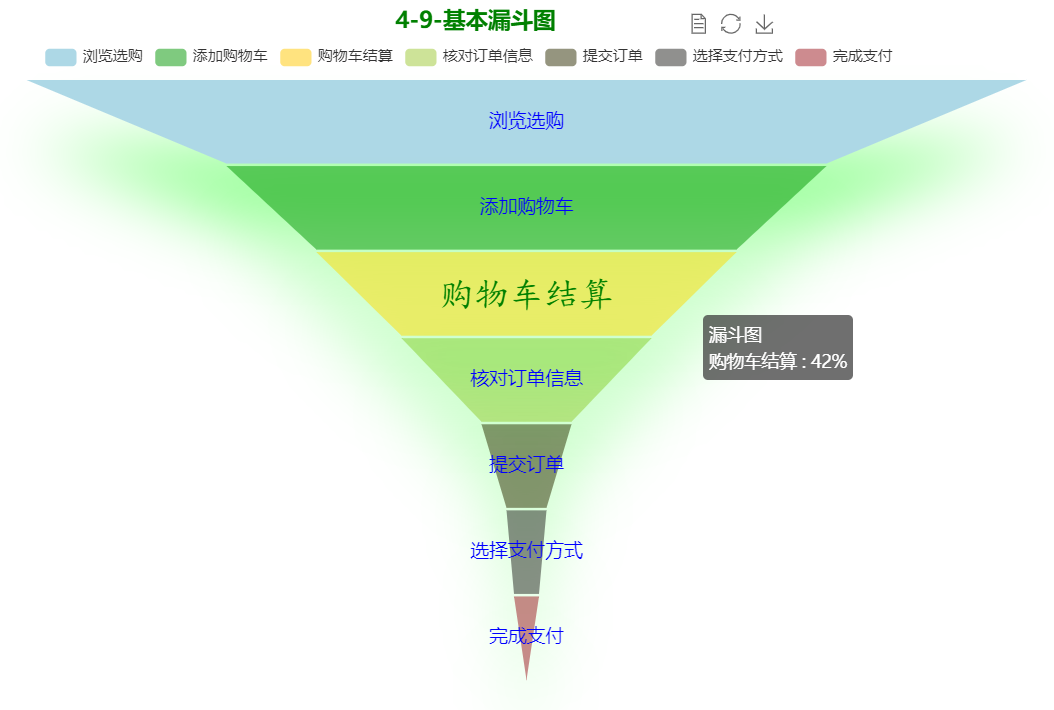
3. 基本漏斗图
<!DOCTYPE html>
<html lang="en">

<head>
    <meta charset="UTF-8">
    <meta http-equiv="X-UA-Compatible" content="IE=edge">
    <meta name="viewport" content="width=device-width, initial-scale=1.0">
    <title>4-9-基本漏斗图</title>
</head>

<body>
    <script src="js/echarts.js"></script>
    <div id="box" style="width: 1000px;height: 600px"></div>
    <script>
        var myChart = echarts.init(document.getElementById("box"));
        var option = {
            color: [
                'lightblue',
                'rgba(0,150,0,0.5)',
                'rgba(255,200,0,0.5)',
                'rgba(155,200,50,0.5)',
                'rgba(44,44,0,0.5)',
                'rgba(33,33,30,0.5)',
                'rgba(155,23,31,0.5)',
                'rgba(23,44,55,0.5)',
            ],
            title: {
                text: '4-9-基本漏斗图',
                // subtext: '某某',
                left: 320,
                top: 0,
                textStyle: {
                    color: 'green'
                }
            },
            tooltip: {
                trigger: 'item',
                formatter: '{a} <br/>{b} : {c}%'
            },
            toolbox: {
                left: 555,
                top: 0,
                feature: {
                    dataView: { readOnly: false },
                    restore: {},
                    saveAsImage: {}
                }
            },
            legend: {
                left: 40,
                top: 30,
                data: ['浏览选购', '添加购物车', '购物车结算', '核对订单信息', '提交订单', '选择支付方式', '完成支付']
            },
            calculable: true,
            series: [
                {
                    name: '漏斗图',
                    type: 'funnel',
                    left: '3%',
                    sort: 'descending',  //金字塔 'ascending' ;漏斗图 'descending'
                    top: 60,
                    bottom: 60,
                    width: '80%',
                    min: 0,
                    max: 100,
                    minSize: '0%',
                    maxSize: '100%',
                    gap: 2,
                    label: {
                        show: true,
                        position: 'inside'
                    },
                    labelLine: {
                        length: 10,
                        lineStyle: {
                            width: 1,
                            type: 'solid'
                        }
                    },
                    itemStyle: {
                        normal: {
                            label: {
                                show: true,
                                position: 'inside',
                                color: 'blue',
                                fontSize: 15,
                            },
                            borderColor: '#fff',
                            borderWidth: 0,
                            shadowBlur: 50,
                            shadowOffsetX: 0,
                            shadowOffsetY: 50,
                            shadowColor: 'rgba(0,255,0,0.4)',
                        }

                    },
                    emphasis: {
                        label: {
                            fontSize: 28,
                            color: 'green',
                            fontFamily: '楷体'
                        }
                    },
                    data: [
                        { value: 100, name: '浏览选购' },
                        { value: 60, name: '添加购物车' },
                        { value: 42, name: '购物车结算' },
                        { value: 25, name: '核对订单信息' },
                        { value: 9, name: '提交订单' },
                        { value: 4, name: '选择支付方式' },
                        { value: 2.5, name: '完成支付' },
                    ]
                }
            ]
        };
        myChart.setOption(option);
    </script>
</body>

</html>
运行效果:
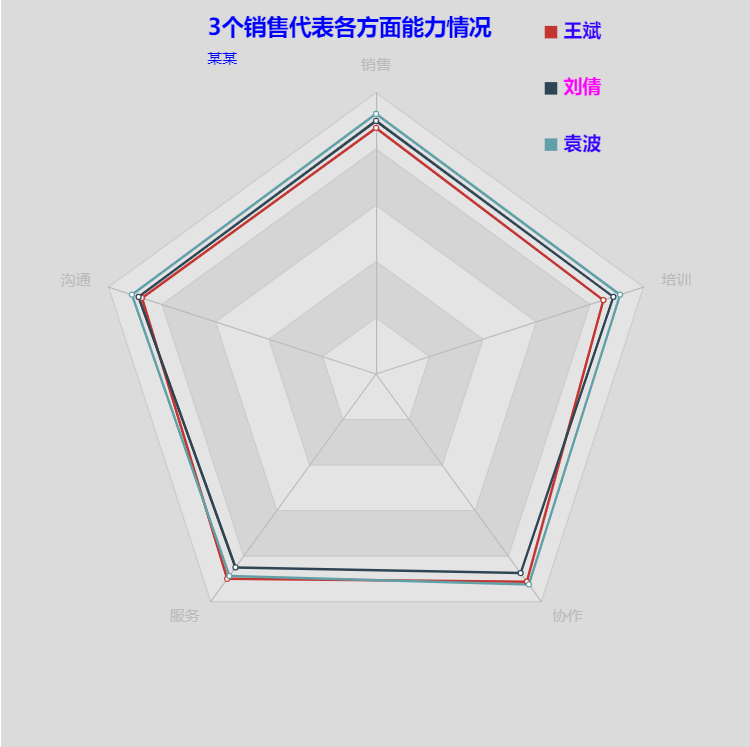
4. 雷达图
<!DOCTYPE html>
<html lang="en">

<head>
    <meta charset="UTF-8">
    <meta http-equiv="X-UA-Compatible" content="IE=edge">
    <meta name="viewport" content="width=device-width, initial-scale=1.0">
    <title>task1-散点图</title>
</head>

<body>
    <script src="js/echarts.js"></script>
    <div id="box" style="width: 600px;height: 600px"></div>
    <script>
        var myChart = echarts.init(document.getElementById("box"));
        var option = {
            backgroundColor: 'rgba(204,204,204,0.7)',
            title: {
                text: '3个销售代表各方面能力情况',
                subtext: '某某',
                top: '10',
                left: '160',
                textStyle: {
                    color: 'blue',
                    fontSize: 18,
                },
                subtextStyle: {
                    color: 'blue',
                    fontSize: 12,
                }
            },
            legend: {
                show: true,
                icon: 'rect',
                top: '14',
                left: '430',
                itemWidth: 10,
                itemHeight: 10,
                itemGap: 30,
                orient: 'vertical',
                textStyle: {
                    color: '#fff',
                    fontSize: 15,
                },
            },
            data: [
                {
                    name: '王斌', icon: 'rect',
                    textStyle: {
                        color: 'rgba(51,0,255,1)',
                        fontWeight: 'bold',
                    }

                },
                {
                    name: '刘倩', icon: 'rect',
                    textStyle: {
                        color: 'rgba(255,0,255,1)',
                        fontWeight: 'bold',
                    }

                },
                {
                    name: '袁波', icon: 'rect',
                    textStyle: {
                        color: 'rgba(51,0,255,1)',
                        fontWeight: 'bold',
                    }
                },
            ],
            radar: {
                // shape: 'circle',
                indicator: [
                    { name: '销售', max: 100 },
                    { name: '沟通', max: 100 },
                    { name: '服务', max: 100 },
                    { name: '协作', max: 100 },
                    { name: '培训', max: 100 },

                ]

            },
            series: [
                {
                    name: 'Budget vs spending',
                    type: 'radar',
                    data: [
                        {
                            value: [87.5, 87.5, 90, 91.25, 85],
                            name: '王斌'
                        },
                        {
                            value: [90, 88.75, 85, 87.5, 88.75],
                            name: '刘倩'
                        },
                        {
                            value: [92.5, 91.25, 88.75, 92.5, 91.25],
                            name: '袁波'
                        }
                    ]
                }
            ]
        };
        myChart.setOption(option);
    </script>
</body>

</html>
运行效果:

 浙公网安备 33010602011771号