探究Go-YCSB做数据库基准测试
本篇文章开篇会介绍一下Go-YCSB是如何使用,然后按照惯例会分析一下它是如何做基准测试,看看它有什么优缺点。
转载请声明出处哦~,本篇文章发布于luozhiyun的博客: https://www.luozhiyun.com/archives/634
最近我们在做数据库的技术选型,要做选型的话难免需要对数据库进行一个基准测试,以便可以横向对比不同数据库性能。
YCSB,全称为“Yahoo!Cloud Serving Benchmark”,是雅虎开发的用来对云服务进行基础测试的工具,其内部涵盖了常见的NoSQL数据库产品,如Cassandra、MongoDB、HBase、Redis等等。
作为一名go开发人员,所以我们使用 pingcap 开发的Go YCSB来进行基准测试。
安装
首先要保证本地 Go 版本不低于 1.16,然后下载编译:
git clone https://github.com/pingcap/go-ycsb.git
cd go-ycsb
make
在 bin 文件夹里面就放着我们编译好的程序 go-ycsb。
我们先来看一下 workloads 文件夹,目录下有各种workload的模板,可以基于workload模板进行自定义修改。默认的6种测试场景如下:
- workloada:读写均衡型,50%/50%,Reads/Writes
- workloadb:读多写少型,95%/5%,Reads/Writes
- workloadc:只读型,100%,Reads
- workloadd:读最近写入记录型,95%/5%,Reads/insert
- workloade:扫描小区间型,95%/5%,scan/insert
- workloadf:读写入记录均衡型,50%/50%,Reads/insert
- workload_template:参数列表模板。
所以我们可以依据不同的 workload 多维度的对系统进行测试。workload里面的操作主要包括:
- Insert:插入一条新的记录
- Update:更新一条记录的某一个或者所有 fields
- Read:读取一条记录的某一个或者所有 fields
- Scan:随机从一个 key 开始顺序扫描随机条记录
在测试的时候,我们还需要根据不同的业务场景来模拟测试,那么可以通过 requestdistribution 控制:
- uniform:随机选择一个记录;
- sequential:按顺序选择记录;
- zipfian:根据 Zipfian 分布来选择记录。大致意思就是互联网常说的80/20原则,也就是20%的key,会占有80%的访问量;
- latest:和 Zipfian 类似,但是倾向于访问新数据明显多于老数据;
- hotspot:热点分布访问;
- exponential:指数分布访问;
下面我们看一下workload里面可以填哪些参数:
# 目前只实现了这一种
workload=core

# 总记录数
recordcount=1000000

# 测试阶段被操作的记录数,如果设置了 threadcount,那么每个线程操作的记录数=operationcount/threadcount
operationcount=3000000

# 线程数
threadcount=500

# 如果一个表里面已经有记录数了,那么load的数据的时候从这个记录数开始
insertstart=0

# 一行数据的字段数
fieldcount=10

# 每个字段大小
fieldlength=100

# 是否应该读取所有字段
readallfields=true

# 是否应该更新所有字段
writeallfields=false

# 字段长度分布
fieldlengthdistribution=constant
#fieldlengthdistribution=uniform
#fieldlengthdistribution=zipfian

# 读操作概率
readproportion=0.95
# 更新操作概率
updateproportion=0.05

# 插入操作概率
insertproportion=0

# 先读后写操作同一条记录概率
readmodifywriteproportion=0

# 范围操作的概率
scanproportion=0

# 范围操作,最大的可操作的记录数
maxscanlength=1000

# 用来选择扫描时访问的记录数量分布情况
scanlengthdistribution=uniform
#scanlengthdistribution=zipfian

# 记录应按顺序插入还是伪随机插入
insertorder=hashed
#insertorder=ordered

# 以什么方式模拟测试
requestdistribution=zipfian
#requestdistribution=uniform
#requestdistribution=latest

# 下面这两种方式时针对requestdistribution为hotspot的时候
# 构成热点集的数据项的百分比
hotspotdatafraction=0.2

# 访问热点集的数据操作百分比
hotspotopnfraction=0.8

# 操作数据的表名
table=usertable

# 延迟测量结果展现形式,暂时没实现
measurementtype=histogram
测试
比如我们现在要测试 redis 的性能,先写一个 workload:
recordcount=1000000
operationcount=1000000
workload=core
readallfields=true
readmodifywriteproportion=1
requestdistribution=uniform
redis.addr=127.0.0.1:6379
threadcount=50
上面的这个 workload 表示在 load 的时候会插入100万条数据到库里面,操作的数据量也是100万,但是有50个线程,也就是每个线程实际操作2万行记录;
测试方式使用 readmodifywriteproportion,先读后写,操作记录采用 uniform 也就是随机方式进行。
先 load 数据:
./bin/go-ycsb load redis -P workloads/workloada
再运行测试:
./bin/go-ycsb run redis -P workloads/workloada
返回:
READ_MODIFY_WRITE - Takes(s): 18.8, Count: 499312, OPS: 26539.8, Avg(us): 1388, Min(us): 107, Max(us): 42760, 99th(us): 3000, 99.9th(us): 7000, 99.99th(us): 26000
- Takes(s) :表示测试总共耗时;
- Count:操作记录数;
- OPS:Operates Per Second,一般是操作次数,与qps区别不大;
- Avg、Min、Max:平均、最小、最大单条记录操作耗时;
- 99th、99.9th、99.99th:P99、P99.9、P99.99时延;
代码实现分析
当然对于我来说,肯定还是要看一下它的代码是怎么做的,学习一下大佬是如何写代码的对我们工作也是很有帮助。
对于 Go YCSB 来说,它总共有这么几个组成部分:
- workload:加载初始化配置文件,创建线程执行测试;
- client:封装了 workload ,配置参数,DB等,用来运行测试;
- db:配置了一堆可被执行的数据库 client,执行具体的读写数据库;
- measurement:数据统计模块,统计执行次数,时延等;
我们以 redis 为例先看一下,如果要测试自己的 Database 该怎么办。
定义 DB
在 Go YCSB 中,所有的 DB 都放在 db 这个目录下面:

所以,我们可以在这个文件夹下面创建自己的db,然后构造一个 struct ,实现 DB 这个接口:
type DB interface {
	ToSqlDB() *sql.DB
	Close() error
	InitThread(ctx context.Context, threadID int, threadCount int) context.Context
	CleanupThread(ctx context.Context)
	Read(ctx context.Context, table string, key string, fields []string) (map[string][]byte, error)
	Scan(ctx context.Context, table string, startKey string, count int, fields []string) ([]map[string][]byte, error)
	Update(ctx context.Context, table string, key string, values map[string][]byte) error
	Insert(ctx context.Context, table string, key string, values map[string][]byte) error
	Delete(ctx context.Context, table string, key string) error
}
里面定义了具体的 DB 操作。
然后需要定义一个工厂,用来创建这个 DB struct,实现DBCreator接口:
type DBCreator interface {
	Create(p *properties.Properties) (DB, error)
}
然后需要定义一个 init 函数,在启动的时候进行 DBCreator 注册:
func init() {
	ycsb.RegisterDBCreator("redis", redisCreator{})
}

var dbCreators = map[string]DBCreator{}

func RegisterDBCreator(name string, creator DBCreator) {
	_, ok := dbCreators[name]
	if ok {
		panic(fmt.Sprintf("duplicate register database %s", name))
	}

	dbCreators[name] = creator
}
RegisterDBCreator 会在初始化的时候被调用。用来获取 init 方法注册过的 DB。通过这种方式 Go YCSB 实现了 DB 的自定义化。
全局参数初始化
首先 Go YCSB 在运行的时候会使用 cobra 根据传入的是 load 还是 run 执行到下面两个不同的方法:
func runLoadCommandFunc(cmd *cobra.Command, args []string) {
	runClientCommandFunc(cmd, args, false)
}

func runTransCommandFunc(cmd *cobra.Command, args []string) {
	runClientCommandFunc(cmd, args, true)
}
这里会调用到 runClientCommandFunc 函数中:
func runClientCommandFunc(cmd *cobra.Command, args []string, doTransactions bool) {
	dbName := args[0]
	// 初始化全局参数
	initialGlobal(dbName, func() {
		doTransFlag := "true"
		if !doTransactions {
			doTransFlag = "false"
		}
		globalProps.Set(prop.DoTransactions, doTransFlag)

		if cmd.Flags().Changed("threads") {
			// We set the threadArg via command line.
			globalProps.Set(prop.ThreadCount, strconv.Itoa(threadsArg))
		}

		if cmd.Flags().Changed("target") {
			globalProps.Set(prop.Target, strconv.Itoa(targetArg))
		}

		if cmd.Flags().Changed("interval") {
			globalProps.Set(prop.LogInterval, strconv.Itoa(reportInterval))
		}
	})

	fmt.Println("***************** properties *****************")
	for key, value := range globalProps.Map() {
		fmt.Printf("\"%s\"=\"%s\"\n", key, value)
	}
	fmt.Println("**********************************************")
	// 初始化 client
	c := client.NewClient(globalProps, globalWorkload, globalDB)
	start := time.Now()
	// 运行测试
	c.Run(globalContext)

	fmt.Printf("Run finished, takes %s\n", time.Now().Sub(start))
	// 测试结果输出
	measurement.Output()
}
参数的初始化主要是在 initialGlobal 里面做的:
func initialGlobal(dbName string, onProperties func()) {
	...
	go func() {
		http.ListenAndServe(addr, nil)
	}()
	//初始化 measurement
	measurement.InitMeasure(globalProps)

	if len(tableName) == 0 {
		tableName = globalProps.GetString(prop.TableName, prop.TableNameDefault)
	}
	// 获取 WorkloadCreator
	workloadName := globalProps.GetString(prop.Workload, "core")
	workloadCreator := ycsb.GetWorkloadCreator(workloadName)
	//创建Workload
	var err error
	if globalWorkload, err = workloadCreator.Create(globalProps); err != nil {
		util.Fatalf("create workload %s failed %v", workloadName, err)
	}
	// 获取要被测试的 db
	dbCreator := ycsb.GetDBCreator(dbName)
	if dbCreator == nil {
		util.Fatalf("%s is not registered", dbName)
	}
	// 创建 db
	if globalDB, err = dbCreator.Create(globalProps); err != nil {
		util.Fatalf("create db %s failed %v", dbName, err)
	}
	globalDB = client.DbWrapper{globalDB}
}
这里最主要的是创建 Workload 和 DB。Workload 里面会初始化很多配置文件里面的信息。
运行测试
runClientCommandFunc 里面会调用 client 的 Run 方法执行测试:
func (c *Client) Run(ctx context.Context) {
	var wg sync.WaitGroup
	threadCount := c.p.GetInt(prop.ThreadCount, 1)

	wg.Add(threadCount)
	measureCtx, measureCancel := context.WithCancel(ctx)
	measureCh := make(chan struct{}, 1)
	go func() {
		defer func() {
			measureCh <- struct{}{}
		}()
		// 这里很有意思,因为有时候我们做数据库是需要初始化数据到缓存里面的
		// 所以开始的一段时间我们不能计入测试统计中,这里有隔预热时间,可以通过 warmuptime 配置
		if c.p.GetBool(prop.DoTransactions, true) {
			dur := c.p.GetInt64(prop.WarmUpTime, 0)
			select {
			case <-ctx.Done():
				return
			case <-time.After(time.Duration(dur) * time.Second):
			}
		}
		// 预热完毕
		measurement.EnableWarmUp(false)

		dur := c.p.GetInt64(prop.LogInterval, 10)
		t := time.NewTicker(time.Duration(dur) * time.Second)
		defer t.Stop()

		for {
			select {
			// 在运行的时候每隔 10 秒输出一次统计信息
			case <-t.C:
				measurement.Output()
			case <-measureCtx.Done():
				return
			}
		}
	}()
	// 做一些初始化的工作,如mysql需要创建表
	if err := c.workload.Init(c.db); err != nil {
		fmt.Printf("Initialize workload fail: %v\n", err)
		return
	}
	// 根据 threadCount 创建多个线程操作数据库
	for i := 0; i < threadCount; i++ {
		go func(threadId int) {
			defer wg.Done()
			// 初始化 worker
			w := newWorker(c.p, threadId, threadCount, c.workload, c.db)
			ctx := c.workload.InitThread(ctx, threadId, threadCount)
			ctx = c.db.InitThread(ctx, threadId, threadCount)
			// 开始跑测试
			w.run(ctx)
			// 跑完测试做清理工作
			c.db.CleanupThread(ctx)
			c.workload.CleanupThread(ctx)
		}(i)
	}
	// 等待测试跑完
	wg.Wait()
	measureCancel()
	<-measureCh
}
这里分为两个部分:第一部分是创建一个线程,这个线程会控制是否开始测试统计,然后会每隔10秒输出一次统计信息;第二部分是根据设置的 threadcount 创建线程,运行 Worker 运行测试;
newWorker 的时候会根据 operationcount 设置 totalOpCount 表示总共需要执行次数,用 totalOpCount / int64(threadCount)设置 opCount 表示 单线程操作的记录数。
func (w *worker) run(ctx context.Context) {
	// 将线程操作分散开来,这样它们就不会同时击中DB了。
	if w.targetOpsPerMs > 0.0 && w.targetOpsPerMs <= 1.0 {
		time.Sleep(time.Duration(rand.Int63n(w.targetOpsTickNs)))
	}

	startTime := time.Now()
	// 循环直到操作数达到 opsDone
	for w.opCount == 0 || w.opsDone < w.opCount {
		var err error
		opsCount := 1
		// 这里是执行基准测试
		if w.doTransactions {
			if w.doBatch {
				err = w.workload.DoBatchTransaction(ctx, w.batchSize, w.workDB)
				opsCount = w.batchSize
			} else {
				err = w.workload.DoTransaction(ctx, w.workDB)
			}
			//	这里是执行 load 数据
		} else {
			if w.doBatch {
				err = w.workload.DoBatchInsert(ctx, w.batchSize, w.workDB)
				opsCount = w.batchSize
			} else {
				err = w.workload.DoInsert(ctx, w.workDB)
			}
		}
		// 预热完了会进行操作次数的统计
		if measurement.IsWarmUpFinished() {
			w.opsDone += int64(opsCount)
			w.throttle(ctx, startTime)
		}

		select {
		case <-ctx.Done():
			return
		default:
		}
	}
}
基准测试的具体执行是交给 workload 的 DoTransaction 方法来判断执行。
func (c *core) DoTransaction(ctx context.Context, db ycsb.DB) error {
	state := ctx.Value(stateKey).(*coreState)
	r := state.r
	// 根据会根据不同的测试场景,进入到不同的测试分支
	// Next 方法会根据设置的 readproportion、updateproportion、 scanproportion等概率来获取相应操作类型
	operation := operationType(c.operationChooser.Next(r))
	switch operation {
	case read:
		return c.doTransactionRead(ctx, db, state)
	case update:
		return c.doTransactionUpdate(ctx, db, state)
	case insert:
		return c.doTransactionInsert(ctx, db, state)
	case scan:
		return c.doTransactionScan(ctx, db, state)
	default:
		return c.doTransactionReadModifyWrite(ctx, db, state)
	}
}
这里会调用 operationChooser 的 Next 方法来判断该执行那个指令,执行指令的概率是我们在配置文件里面设置好的。
这个算法很简单,在初始化 operationChooser 会将设置的参数readproportion、updateproportion、 scanproportion的值以数组的形式 add 到 operationChooser 的 values 里面,然后随机一个 0~1的小数,检查这个随机数落在哪个范围就好了:
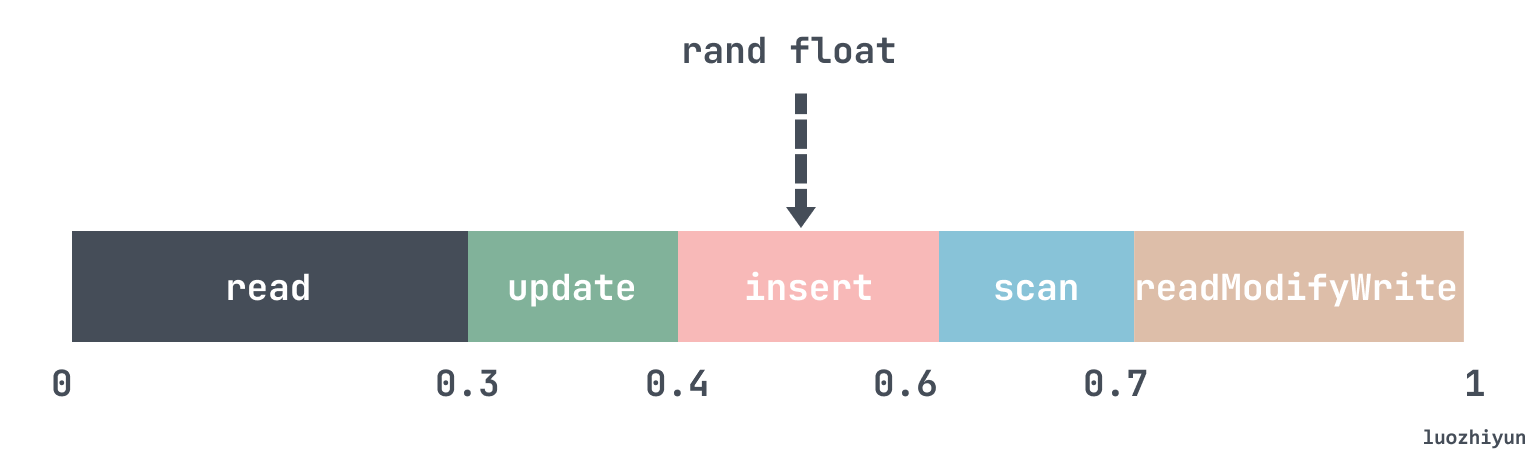
func (d *Discrete) Next(r *rand.Rand) int64 {
	sum := float64(0)
	for _, p := range d.values {
		sum += p.Weight
	}
	// 随机一个 0~1的小数
	val := r.Float64()
	for _, p := range d.values {
		pw := p.Weight / sum
		if val < pw {
			d.SetLastValue(p.Value)
			return p.Value
		}
		val -= pw
	}
	panic("oops, should not get here.")
}
在代码实现上就是按照上面说的,将所有 values 的值加起来得到 sum,然后计算每个 value 的占比是否达到随机数值。
最后我们再来看看 doTransactionRead 是怎么执行的:
func (c *core) doTransactionRead(ctx context.Context, db ycsb.DB, state *coreState) error {
	r := state.r
	// 根据我们设置的 requestdistribution 获取一个 key 值
	keyNum := c.nextKeyNum(state)
	keyName := c.buildKeyName(keyNum)

	//被读取的字段
	var fields []string
	if !c.readAllFields {
		// 如果不是读取所有字段,那么根据fieldChooser字段选择器选择一个字段执行
		fieldName := state.fieldNames[c.fieldChooser.Next(r)]
		fields = append(fields, fieldName)
	} else {
		fields = state.fieldNames
	}
	//调用 db 的read方法
	values, err := db.Read(ctx, c.table, keyName, fields)
	if err != nil {
		return err
	}
	//校验数据完整性
	if c.dataIntegrity {
		c.verifyRow(state, keyName, values)
	}

	return nil
}
这里首先会调用 nextKeyNum 去获取 key 值,这里的 key 会根据我们设置的 requestdistribution 参数根据一定的规则获取到。然后校验完需要读哪些字段后调用 DbWrapper 的 Read 方法读取数据。
func (db DbWrapper) Read(ctx context.Context, table string, key string, fields []string) (_ map[string][]byte, err error) {
	start := time.Now()
	defer func() {
		// 进行测试数据统计
		measure(start, "READ", err)
	}()

	return db.DB.Read(ctx, table, key, fields)
}
DbWrapper 会封装一层,用 defer 方法调用 measure 进行统计。
不过这里我有问题是在读取数据的时候通过还会根据传入的 fields 来进行解析,这样也会损耗一些性能,不知是否合理,如redis 的 Read 方法:
func (r *redis) Read(ctx context.Context, table string, key string, fields []string) (map[string][]byte, error) {
	data := make(map[string][]byte, len(fields))

	res, err := r.client.Get(table + "/" + key).Result()

	if err != nil {
		return nil, err
	}
	// 反序列化
	err = json.Unmarshal([]byte(res), &data)
	if err != nil {
		return nil, err
	}
	// TODO: filter by fields
	return data, err
}
数据统计
每一次操作完毕之后都会调用到 measure 方法,进行测试数据统计。
func measure(start time.Time, op string, err error) {
	// 计算耗时
	lan := time.Now().Sub(start)
	if err != nil {
		measurement.Measure(fmt.Sprintf("%s_ERROR", op), lan)
		return
	}
	measurement.Measure(op, lan)
}
统计信息由于是会有多个线程同时操作,所以需要使用线程安全的方式进行操作:
func (h *histogram) Measure(latency time.Duration) {
	// 这里是 us 微秒
	n := int64(latency / time.Microsecond)

	atomic.AddInt64(&h.sum, n)
	atomic.AddInt64(&h.count, 1)
	// 这里转为毫秒ms
	bound := int(n / h.boundInterval)
	// boundCounts 是一个并发map,用来统计每个时间段(单位:ms)中有多少次操作
	h.boundCounts.Upsert(bound, 1, func(ok bool, existedValue int64, newValue int64) int64 {
		if ok {
			return existedValue + newValue
		}
		return newValue
	})
	// 设置最小时延
	for {
		oldMin := atomic.LoadInt64(&h.min)
		if n >= oldMin {
			break
		}

		if atomic.CompareAndSwapInt64(&h.min, oldMin, n) {
			break
		}
	}
	// 设置最大时延
	for {
		oldMax := atomic.LoadInt64(&h.max)
		if n <= oldMax {
			break
		}

		if atomic.CompareAndSwapInt64(&h.max, oldMax, n) {
			break
		}
	}
}
统计每个时间段(单位:ms)内操作的次数是使用 boundCounts,它是 Go YCSB 自己实现的 ConcurrentMap 保证线程安全,用来统计单位时间内操作的次数;
最大和最小时延是通过 CAS 进行操作的,也是为了保证线程安全。
统计完之后会调用 getInfo 计算耗时:
func (h *histogram) getInfo() map[string]interface{} {
	min := atomic.LoadInt64(&h.min)
	max := atomic.LoadInt64(&h.max)
	sum := atomic.LoadInt64(&h.sum)
	count := atomic.LoadInt64(&h.count)

	bounds := h.boundCounts.Keys()
	sort.Ints(bounds)

	avg := int64(float64(sum) / float64(count))
	per99 := 0
	per999 := 0
	per9999 := 0

	opCount := int64(0)
	// 计算 P99,P99.9,P99.99
	// 这里实际上是统计一个占比
	// bound 里面会保存每毫秒有多少次操作
	for _, bound := range bounds {
		boundCount, _ := h.boundCounts.Get(bound)
		opCount += boundCount
		per := float64(opCount) / float64(count)
		// 这里是 99% 的操作是落在哪个时间区间内
		if per99 == 0 && per >= 0.99 {
			per99 = (bound + 1) * 1000
		}

		if per999 == 0 && per >= 0.999 {
			per999 = (bound + 1) * 1000
		}

		if per9999 == 0 && per >= 0.9999 {
			per9999 = (bound + 1) * 1000
		}
	}
	// 计算整个测试耗时
	elapsed := time.Now().Sub(h.startTime).Seconds()
	// 计算单位耗时内操作次数
	qps := float64(count) / elapsed
	res := make(map[string]interface{})
	res[ELAPSED] = elapsed
	res[COUNT] = count
	res[QPS] = qps
	res[AVG] = avg
	res[MIN] = min
	res[MAX] = max
	res[PER99TH] = per99
	res[PER999TH] = per999
	res[PER9999TH] = per9999

	return res
}
这里的 per99、per999、per9999 实际上精度只有毫秒,是为了做直方图导出而设计的(然后作者在这个项目已经过去3年了,还没加上这个功能)。
总结
通过上面的分析可以发现, Go YCSB 设计还是很精妙的,通过很少的代码就可以进行 DB 的扩展;配置也是相当灵活,可以根据不同的 requestdistribution 提供了不同的测试环境,并且在测试中也可以随意的调整读写概率,保证可以尽可能的模拟线上的环境。
但是它也有很多不足,一方面是文档很不充分,基本上就写了几个参数配置;另一方面就是很多功能都没有实现,线上测试的时候经常会出现ERROR,去代码一看结果是没有实现。三年前作者的博客中就说要实现测试结果导出功能,结果现在还没实现。我已经给作者 tl@pingcap.com 发邮件了,等待回复。
Reference
https://github.com/pingcap/go-ycsb
https://github.com/brianfrankcooper/YCSB/wiki/Running-a-Workload


 浙公网安备 33010602011771号