
爬取百度贴吧热议榜
一.主题式网络主题式网络爬虫设计方案
1、主题式网络爬虫名称:爬取百度贴吧数据并数据分析及可视化
2.爬取的内容:贴吧热议榜的标题、排行、热度
3.网络爬虫设计方案概述:首先找到爬取页面的源代码,找到所需要爬取的数据在源代码中的位置,接下来进行数据爬取,并将数据持久化,接下来对数据进行清洗处理,并进行数据分析和可视化
技术难点:对回归分析和一些其他的库的使用不是太熟练
二、主题页面的结构特征分析
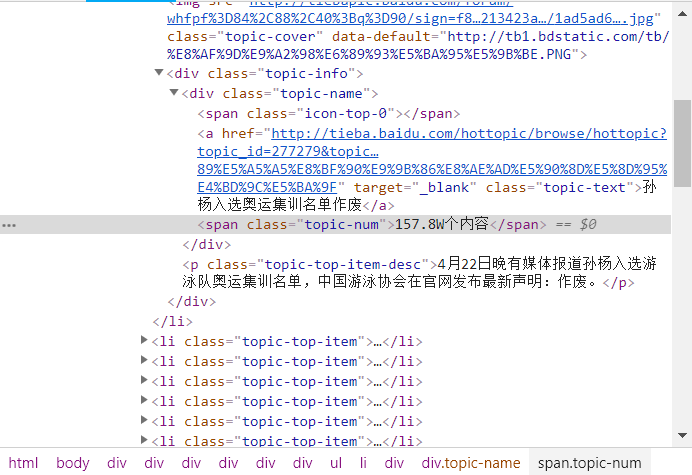
1、主题页面的结构和特征分析:所要爬取的热度数据在<span class="topic-num">标签‘’里面,标题在标签‘<a href> .... <a>’里面
2.页面解析
三、
1、数据爬取与采集
import requests
import re
import pandas as pd
import openpyxl
import matplotlib
import matplotlib.pyplot as plt
import numpy as np
import seaborn as sns
from sklearn.linear_model import LinearRegression
url = 'http://tieba.baidu.com/hottopic/browse/topicList?res_type=1&red_tag=n0379530944'
header = {'user-agent':'Mozilla/5.0'}
r = requests.get(url, headers=header)
r.raise_for_status()
r.encoding = r.apparent_encoding
r.text
html = r.text
title = re.findall('<a href=.*? target="_blank" .*?>(.*?)</a>',html)[1:11]
redu = re.findall('<span class="topic-num">(.*?)</span>',html)[0:11]
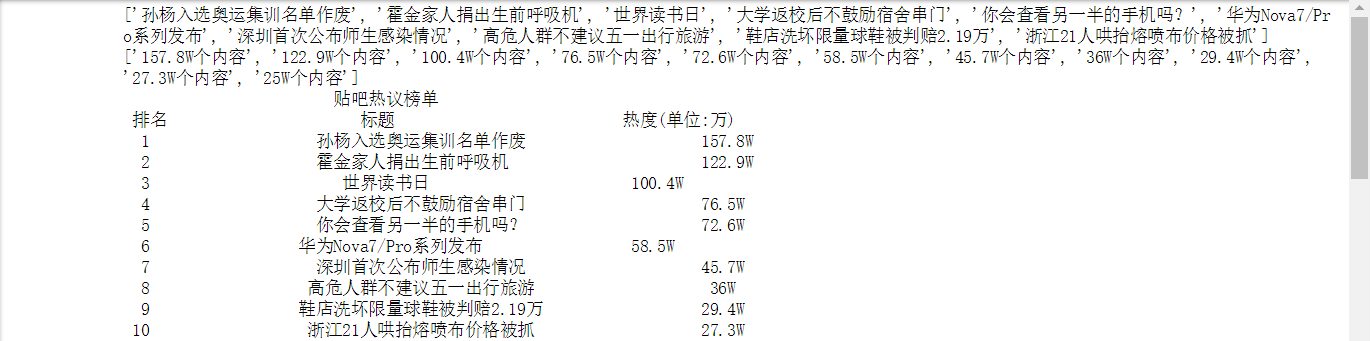
print(title)
print(redu)
print('{:^55}'.format('贴吧热议榜单'))
print('{:^5}\t{:^40}\t{:^10}'.format('排名','标题','热度(单位:万)'))
num = 10
lst = []
for i in range(num):
print('{:^5}\t{:^40}\t{:^10}'.format(i+1, title[i], redu[i][:-3]))
lst.append([i+1, title[i], redu[i][:-3]])
df = pd.DataFrame(lst, columns=['排名','标题','热度(单位:万)'])
df.to_excel('百度贴吧热议榜.xlsx')
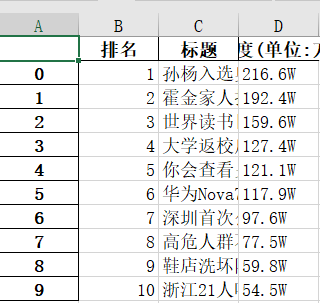
数据清洗
#数据清洗
df = pd.DataFrame(pd.read_excel('百度贴吧热议榜.xlsx'))
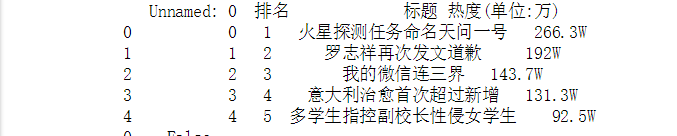
print(df.head())
#检查重复值
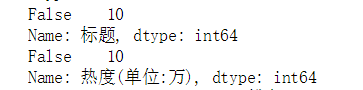
print(df.duplicated())

检查是否有空值
print(df['标题'].isnull().value_counts())
print(df['热度(单位:万)'].isnull().value_counts())
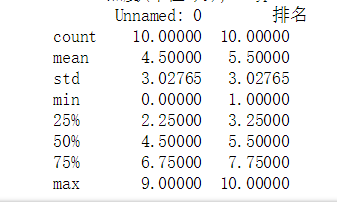
异常值处理
print(df.describe())
#数据持久化
df = pd.DataFrame(lst, columns=['排名','标题','热度(单位:万)'])
df.to_excel('百度贴吧热议榜.xlsx')
数据可视化
def zhexian():
plt.rcParams['font.sans-serif'] = ['SimHei']
x = df['排名']
y = df['热度(单位:万)']
plt.xlabel('排名')
plt.ylabel('热度(单位:万)')
plt.plot(x,y)
plt.scatter(x,y)
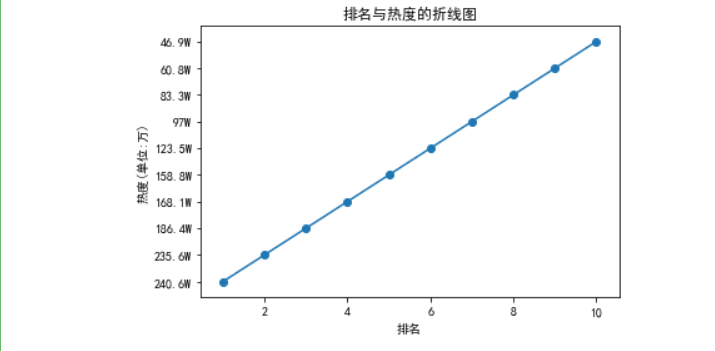
plt.title('排名与热度的折线图')
plt.show()
zhexian()
plt.rcParams['font.sans-serif'] = ['SimHei']
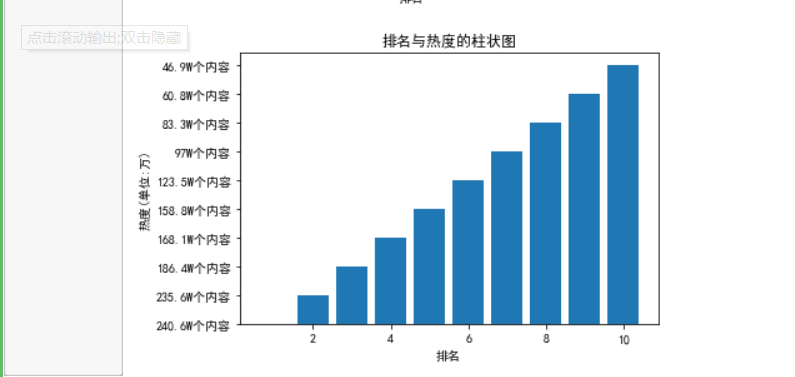
plt.bar(range(1,11),redu[:10])
plt.xlabel('排名')
plt.ylabel('热度(单位:万)')
plt.title('排名与热度的柱状图')
plt.show()
#完整代码
import requests
import re
import pandas as pd
import openpyxl
import matplotlib
import matplotlib.pyplot as plt
import numpy as np
import seaborn as sns
from sklearn.linear_model import LinearRegression
url = 'http://tieba.baidu.com/hottopic/browse/topicList?res_type=1&red_tag=n0379530944'
header = {'user-agent':'Mozilla/5.0'}
r = requests.get(url, headers=header)
r.raise_for_status()
r.encoding = r.apparent_encoding
r.text
html = r.text
title = re.findall('<a href=.*? target="_blank" .*?>(.*?)</a>',html)[1:11]
redu = re.findall('<span class="topic-num">(.*?)</span>',html)[0:11]
print(title)
print(redu)
print('{:^55}'.format('贴吧热议榜单'))
print('{:^5}\t{:^40}\t{:^10}'.format('排名','标题','热度(单位:万)'))
num = 10
lst = []
for i in range(num):
print('{:^5}\t{:^40}\t{:^10}'.format(i+1, title[i], redu[i][:-3]))
lst.append([i+1, title[i], redu[i][:-3]])
#数据持久化
df = pd.DataFrame(lst, columns=['排名','标题','热度(单位:万)'])
df.to_excel('百度贴吧热议榜.xlsx')
#数据清洗
df = pd.DataFrame(pd.read_excel('百度贴吧热议榜.xlsx'))
print(df.head())
print(df.duplicated())
print(df['标题'].isnull().value_counts())#检查是否有空值
print(df['热度(单位:万)'].isnull().value_counts())#检查是否有空值
print(df.describe())#异常值处理
#折线图
def zhexian():
plt.rcParams['font.sans-serif'] = ['SimHei']
x = df['排名']
y = df['热度(单位:万)']
plt.xlabel('排名')
plt.ylabel('热度(单位:万)')
plt.plot(x,y)
plt.scatter(x,y)
plt.title('排名与热度的折线图')
plt.show()
zhexian()
plt.rcParams['font.sans-serif'] = ['SimHei']
plt.bar(range(1,11),redu[:10])
plt.xlabel('排名')
plt.ylabel('热度(单位:万)')
plt.title('排名与热度的柱状图')
plt.show()
四.总结
1.热度会随排名的降低而下降,图表可以更为直观的表现出排名与热度的关系和变化。
2.完成本次的程序设计花了较长时间,遇到了挺多困难,但也把问题解决,虽然还是有很多不足,对于回归分析和一部分的内容掌握的不够扎实

 浙公网安备 33010602011771号