
docker基础之八monitor-5-prometheus
Prometheus
架构图:
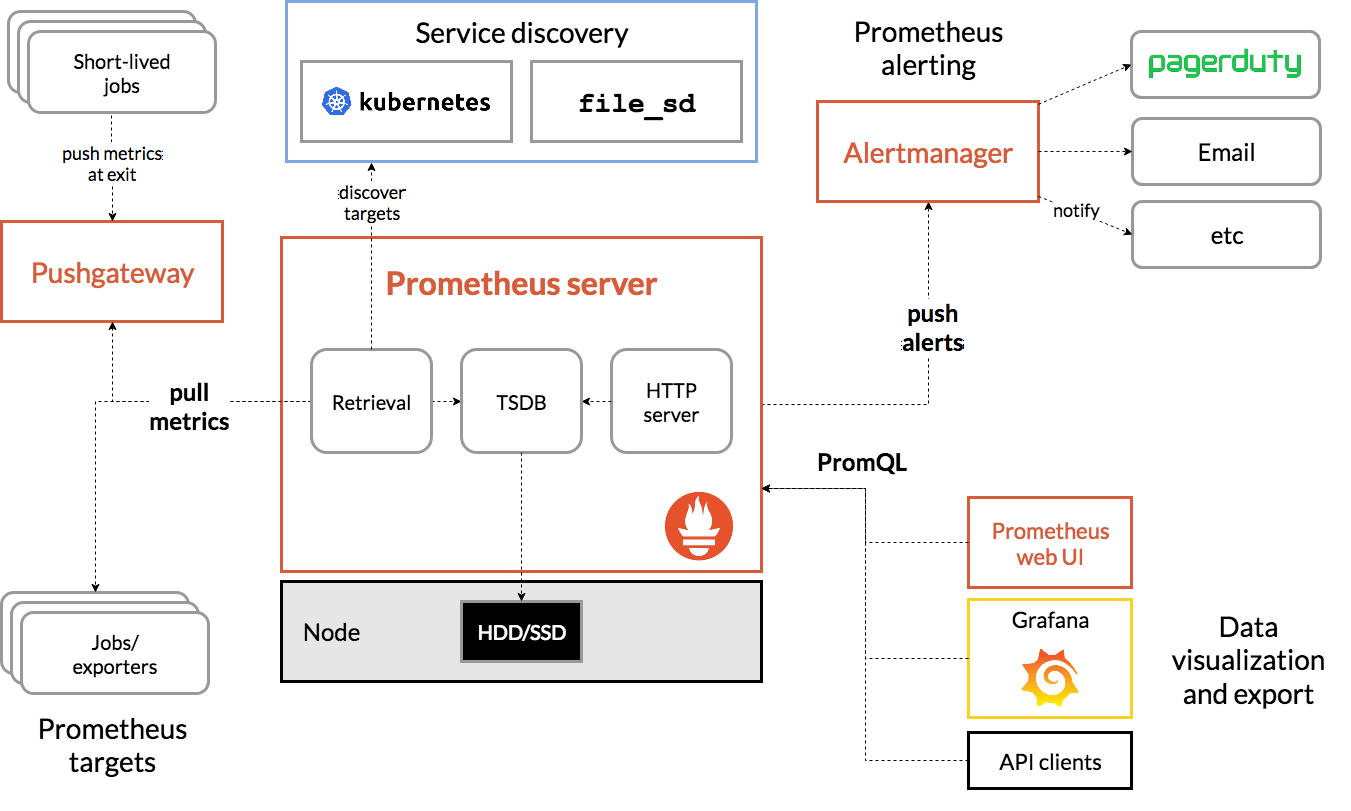
组件:
prometheus server
负责从exporter拉取和存储监控数据,并提供一套灵活的查询语言(promQL)供用户使用
exporter
负责收集目标对象(host,container)的性能数据,并通过http接口供prometheus server获取
grafana
监控数据的可视化组件,提供完美的数据展示能力
alertmanager
用户可以定义基于监控数据的告警规则,规则会触发告警.一旦alertmanager收到告警,会通过预定义的方式发出告警通知。支持的方式包括email,pagerduty,webhook
prometheus最大的亮点:它的多维数据模型
多维数据模型理解参考:
环境
俩台docker host,监控host和容器两个层次的数据
premetheus server
本身以容器的方式运行在nas5上
exporter
prometheus有很多现成的exporter,完整列表看https://prometheus.io/docs/instrumenting/exporters/
我们使用
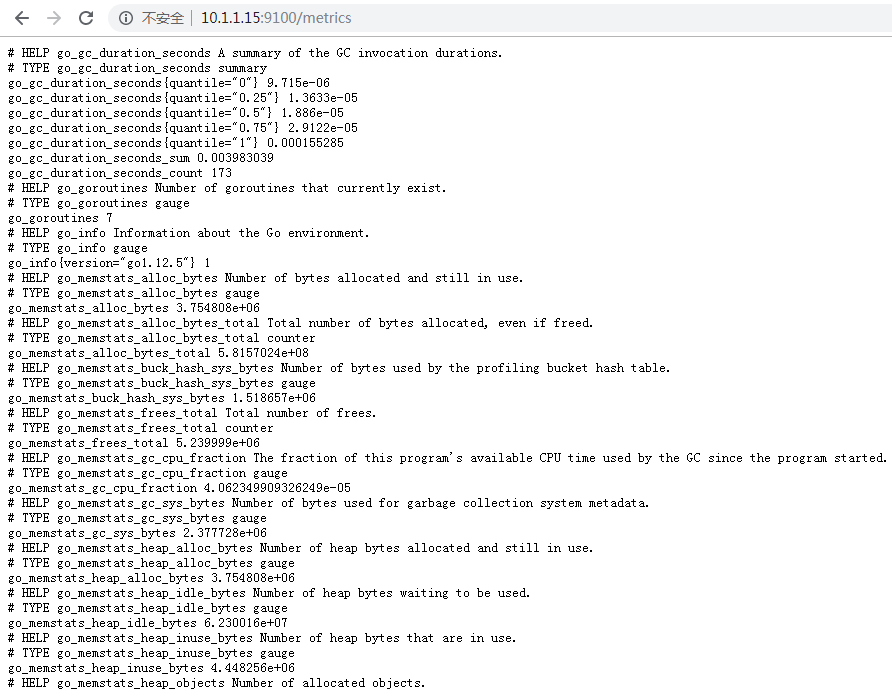
1.node exporter,负责收集host硬件和操作系统数据,它将以容器方式运行在所有host上
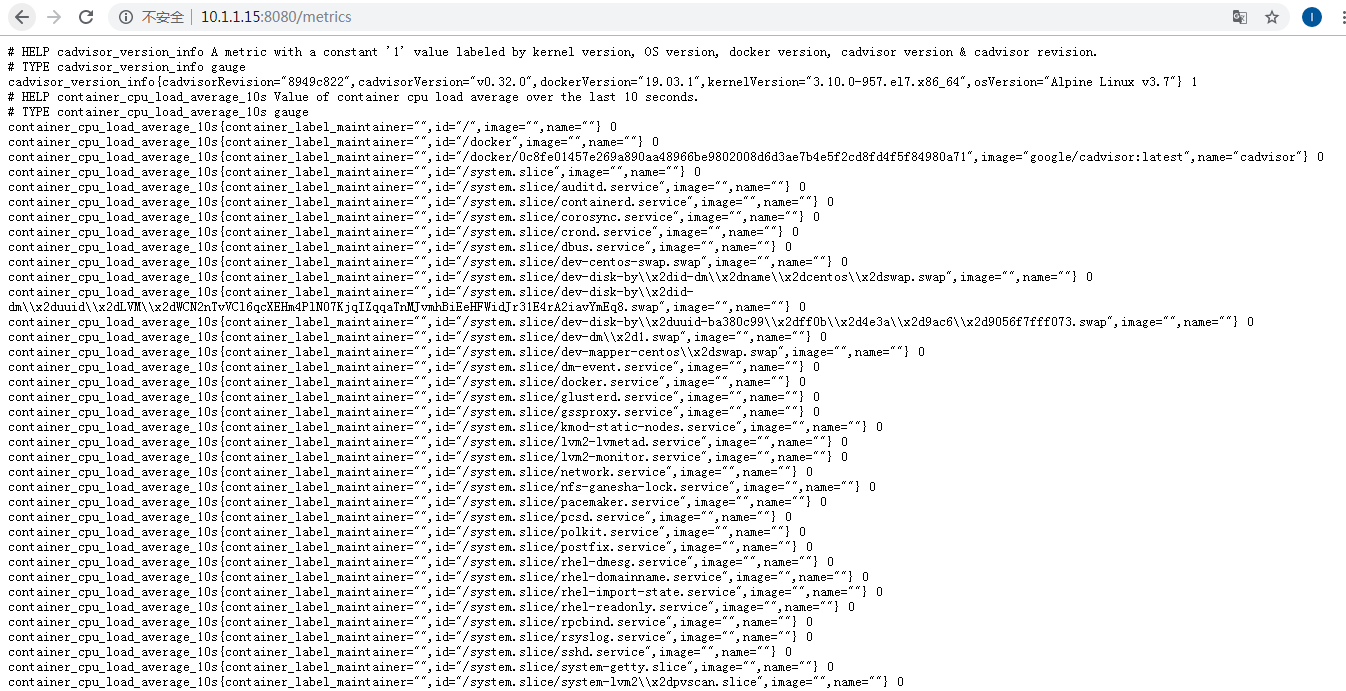
2.cAdvisor,负责收集容器数据,它将以容器方式运行在所有host上
grafana
显示多维数据,也以容器方式运行在nas5上
1.运行node exporter
docker run -d -p 9100:9100 \
-v "/proc:/host/proc" \
-v "/sys:/host/sys" \
-v "/:/rootfs" \
--net=host \
prom/node-exporter \
--path.procfs /host/proc \
--path.sysfs /host/sys \
--collector.filesystem.ignored-mount-points "^/(sys|proc|dev|host|etc)($|/)"

WARNING: Published ports are discarded when using host network mode
node exporter启动后,将通过9100提供host的监控数据,浏览器测试http://ip:9100/metrics
2.运行cAdvisor
docker run \
--volume=/:/rootfs:ro \
--volume=/var/run:/var/run:rw \
--volume=/sys:/sys:ro \
--volume=/var/lib/docker/:/var/lib/docker:ro \
--publish=8080:8080 \
--detach=true \
--name=cadvisor \
--net=host \
google/cadvisor:latest
cAdvisor启动后,将通过8080提供容器的监控数据,浏览器测试http://ip:8080/metrics
3.运行prometheus server
在nas5,10.1.1.15上执行
docker run -d -p 9090:9090 \
-v /root/prometheus.yml:/etc/prometheus/prometheus.yml \
--name prometheus \
--net=host \
prom/prometheus
容器状态处于exited状态,原因是缺主配置文件
注意,--net=host,意味着prometheus server可以直接与node exporter,cAdvisor,grafana通信
prometheus需要手动准备配置文件
/root/prometheus.yml是prometheus server的配置文件
global:
  scrape_interval:     15s # By default, scrape targets every 15 seconds.

  # Attach these labels to any time series or alerts when communicating with
  # external systems (federation, remote storage, Alertmanager).
  external_labels:
    monitor: 'codelab-monitor'

# A scrape configuration containing exactly one endpoint to scrape:
# Here it's Prometheus itself.
scrape_configs:
  # The job name is added as a label `job=<job_name>` to any timeseries scraped from this config.
  - job_name: 'prometheus'

    # Override the global default and scrape targets from this job every 5 seconds.
    scrape_interval: 5s

    static_configs:
      - targets: ['localhost:9090','localhost:8080','localhost:9100','10.1.1.14:8080','10.1.1.14:9100']
docker start prometheus
指定从哪些exporter抓取数据,这里指定了两台host上的node exporter和cadvisor
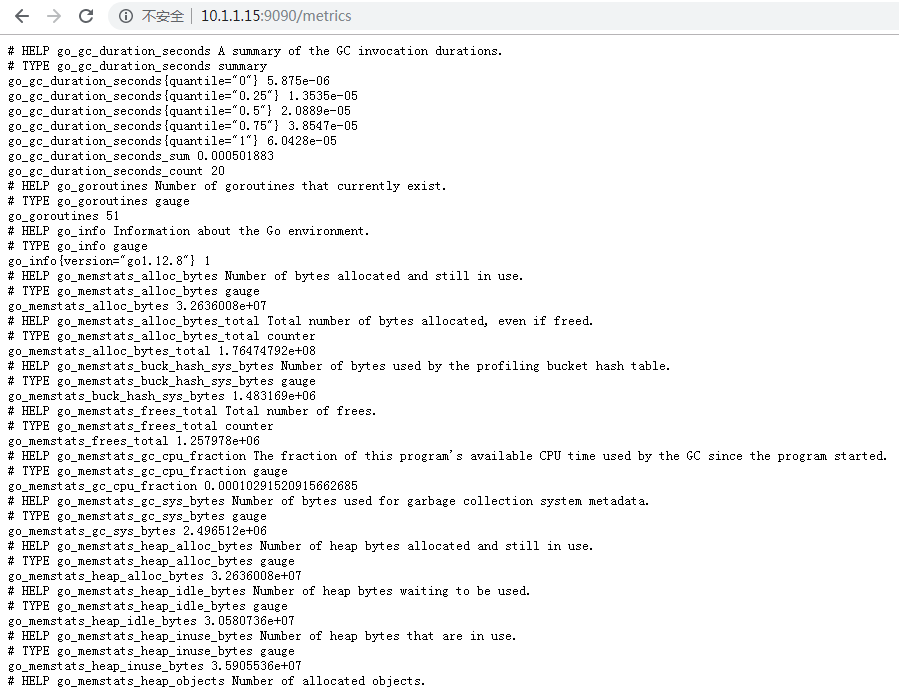
localhost:9090是prometheus server自己,证明prometheus 本身也会手机自己的监控数据,浏览器测试http://10.1.1.15:9090/metrics
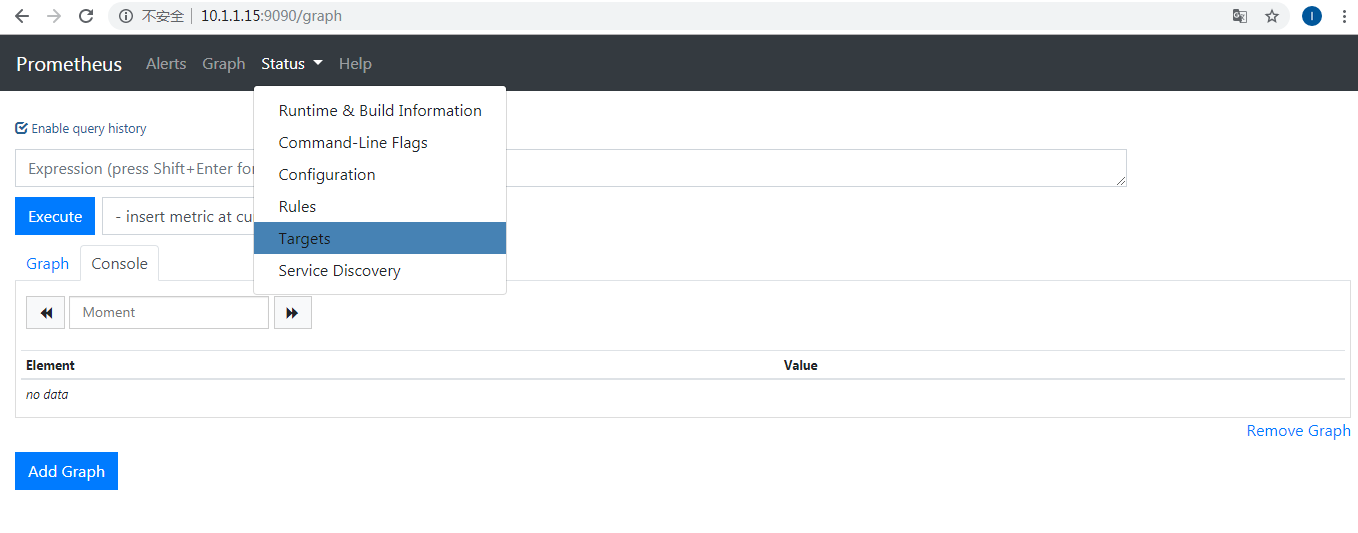
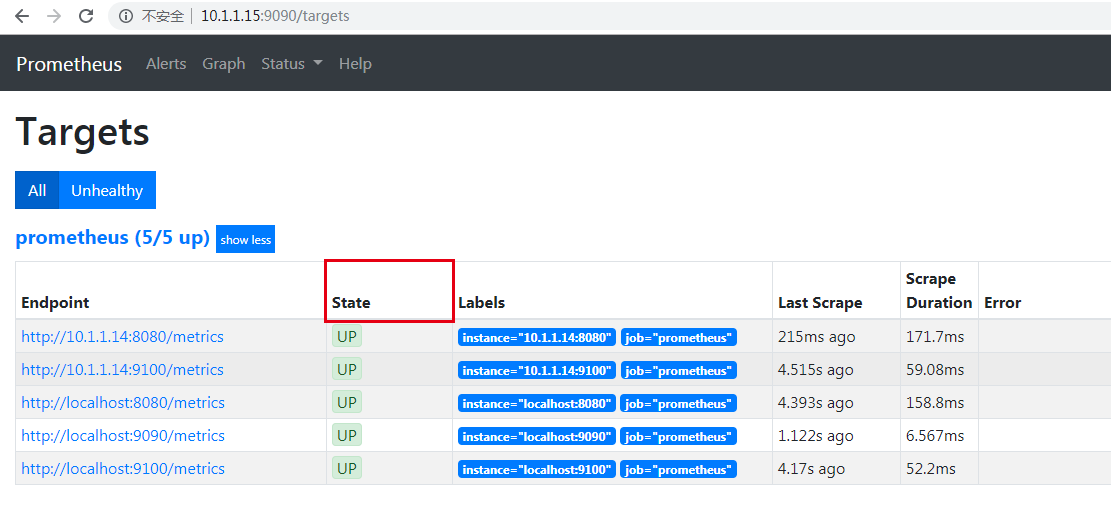
prometheus主页:浏览器http://10.1.1.15:9090,点击菜单Status -> Targets
所有Target的State都是UP,说明prometheus server能够正常获取监控数据
4.运行grafana
在nas5,10.1.1.15上执行
docker run -d -i -p 3000:3000 \
-e "GF_SERVER_ROOT_URL=http://grafana.server.name" \
-e "GF_SECURITY_ADMIN_PASSWORD=secret" \
--net=host \
grafana/grafana
注意:
-e "GF_SECURITY_ADMIN_PASSWORD=secret" 指定了grafana admin用户的密码secret
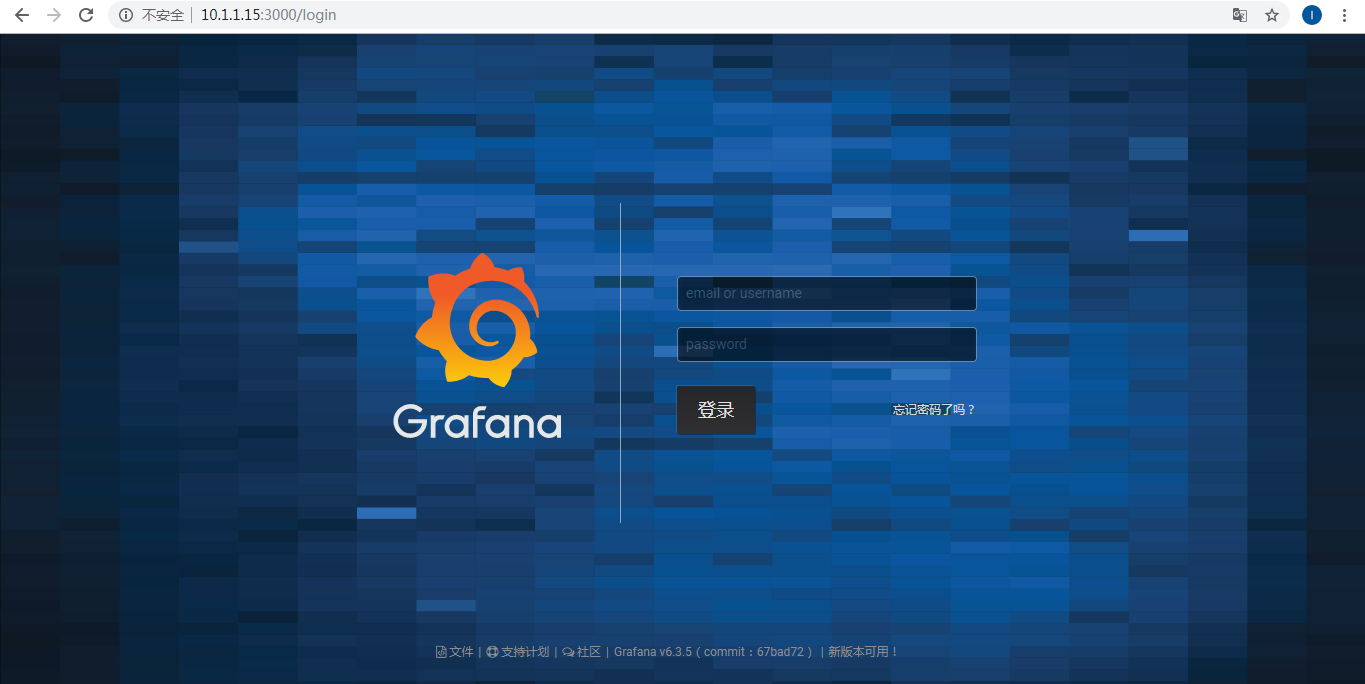
grafana启动后,浏览器测试,http://10.1.1.15:3000
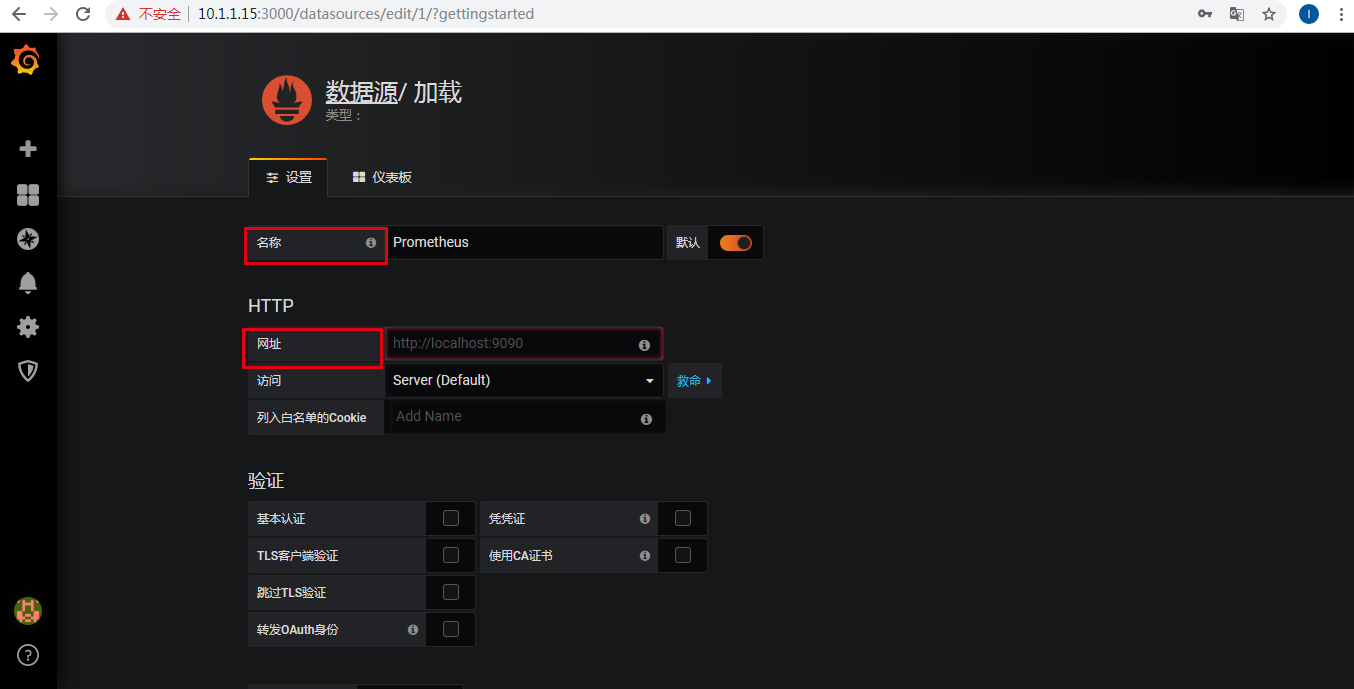
登录后,grafana将引导我们配置data source
名称为prometheus,添加网址
其它保持默认值即可,
点解Save & Test,自会更新
grafana应该能够访问prometheus中存放的数据啦,如何展示?
grafana通过dashboard展示数据,需要在dashboard中定义:
1)展示prometheus的哪些多维数据?需要给出具体的查询语言表达式
2)用什么形式展示,比如二维线形图,仪表图,各种坐标的含义等
幸运的是,可以借助开源社区的力量,直接使用现成的dashboard
比如下载 docker and system monitoring,得到一个json文件,
然后点击grafana左上角 + -> Import
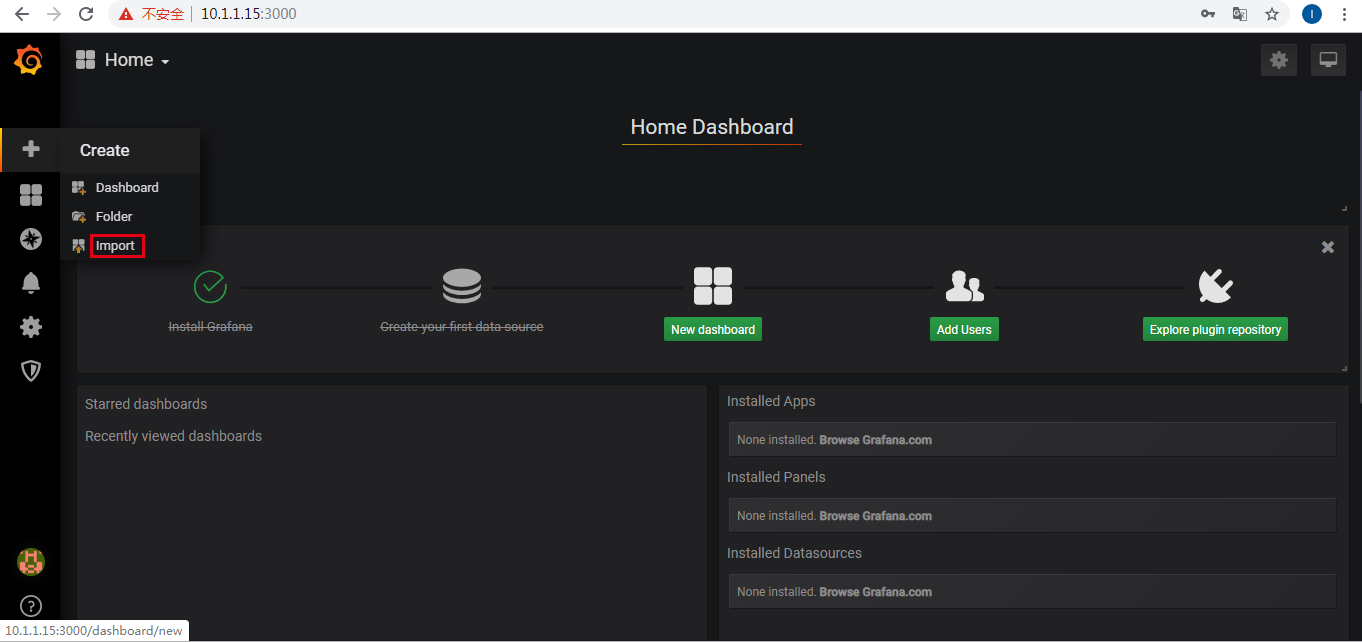
导入下载的json

dashboard展示出漂亮的图表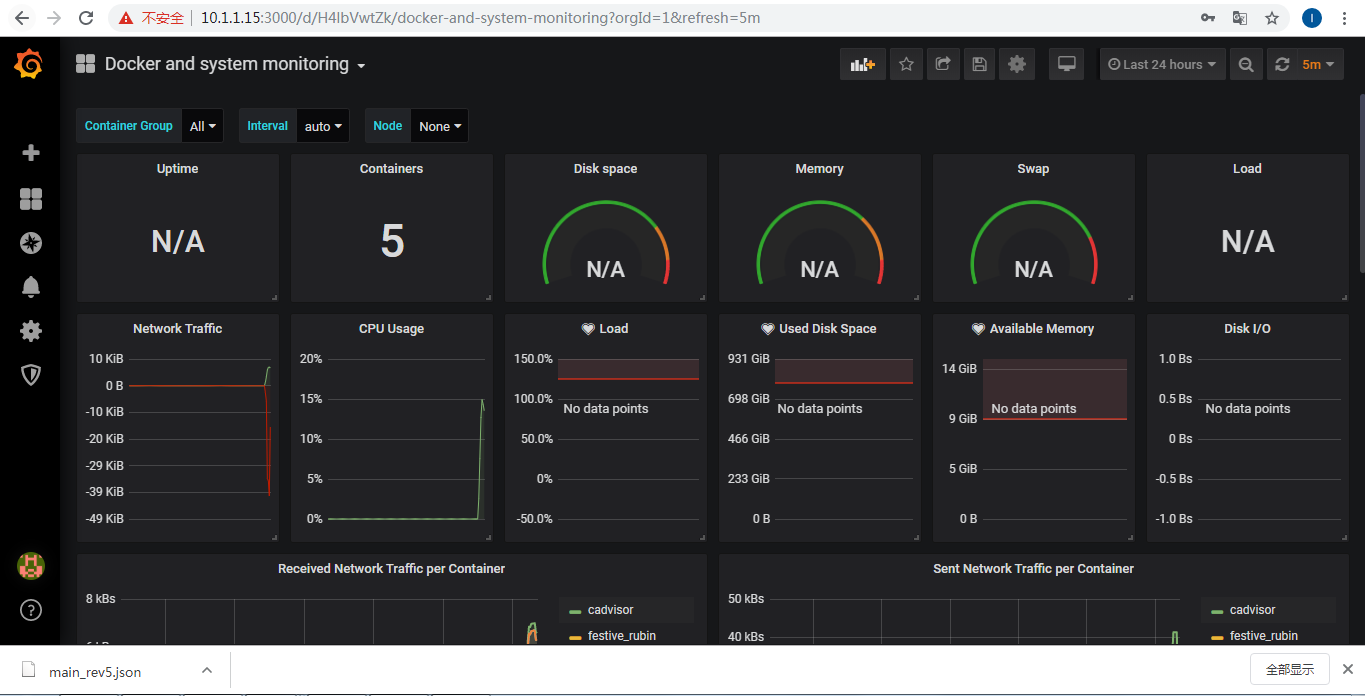
补充:
准备镜像:
docker pull prom/node-exporter

docker pull prom/prometheus

docker pull grafana/grafana

 浙公网安备 33010602011771号