李雅普诺夫指数
- 李雅普诺夫指数
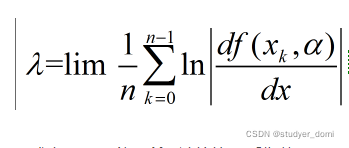
Lyaponuv(李雅普诺夫)指数表示相空间相邻轨迹的平均指数发散率的数值特征。又称李雅普诺夫特征指数,是用于识别混沌运动若干数值的特征之一。
李雅普诺夫指数常常被用来判定一个系统的混沌性,通过图像可以直观地看出某个系统或者映射是否是混沌系统或映射。
- Lyaponuv指数性质
我们假定Lyaponuv指数用 来表示,那么对于的不同取值有以下不同的含义:
当lambda >0时,系统运动会进入混沌状态,对应的映射叫做混沌映射;
当 lambda<0时,系统的运动状态会趋于稳定且此时对系统的初始状态不敏感,也就是说此时的映射对初始值不敏感;
当 lambda=0时,系统则处于稳定状态。
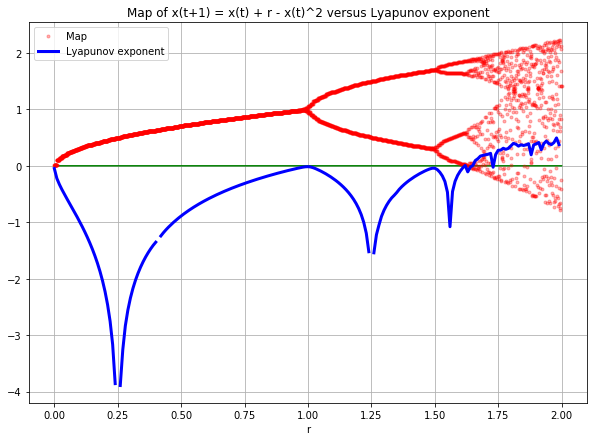
- Lyaponuv指数的计算
# -*- coding: utf-8 -*-
"""
Spyder Editor

This is a temporary script file.
"""


import numpy as np
import matplotlib.pyplot as plt
# show plots in notebook


result = []
lambdas = []
maps = []

# define range of r
rvalues = np.arange(0, 2, 0.01)

# loop through r
for r in rvalues:
    x = 0.1
    result = []
    # iterate system 100 times
    for t in range(100):
        x = x + r - x**2

        print(x)
        # calculate log of the absolute of the derivative
        result.append(np.log(abs(1 - 2*x)))
    # take average
    lambdas.append(np.mean(result))
    # for the map ignore first 100 iterations as transient time and iterate anew
    for t in range(20):
        x = x + r - x**2
        maps.append(x)

fig = plt.figure(figsize=(10,7))
ax1 = fig.add_subplot(1,1,1)

xticks = np.linspace(0, 2, 4000)
# zero line
zero = [0]*4000
ax1.plot(xticks, zero, 'g-')
# plot map
ax1.plot(xticks, maps, 'r.',alpha = 0.3, label = 'Map')
ax1.set_xlabel('r')
# plot lyapunov
ax1.plot(rvalues, lambdas, 'b-', linewidth = 3, label = 'Lyapunov exponent')
ax1.grid('on')
ax1.set_xlabel('r')
ax1.legend(loc='best')
ax1.set_title('Map of x(t+1) = x(t) + r - x(t)^2 versus Lyapunov exponent')

 浙公网安备 33010602011771号