

pyqtgraph逐点画波形图例子
使用python的array模块创建能够动态改变大小的数组,结合numpy中的frombuffer函数转换为numpy的数组,最后在pyqtgraph中逐点画波形图。
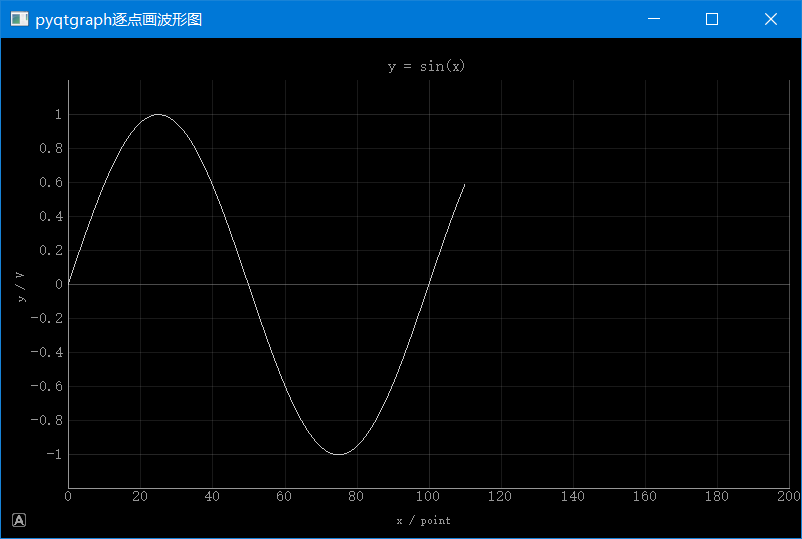
 1 # -*- coding: utf-8 -*-#
 2
 3 #-------------------------------------------------------------------------------
 4 # Name:         pyqtgraph逐点画波形图
 5 # Description:
 6 # Author:       lgk
 7 # Date:         2018/6/2
 8 #-------------------------------------------------------------------------------
 9
10 import pyqtgraph as pg
11 import numpy as np
12 import array
13
14 app = pg.mkQApp()
15
16 win = pg.GraphicsWindow()
17 win.setWindowTitle(u'pyqtgraph逐点画波形图')
18 win.resize(800, 500)
19
20 data = array.array('d') #可动态改变数组的大小,double型数组
21 historyLength = 200
22
23 p = win.addPlot()
24 p.showGrid(x=True, y=True)
25 p.setRange(xRange=[0,historyLength], yRange=[-1.2, 1.2], padding=0)
26 p.setLabel(axis='left', text='y / V')
27 p.setLabel(axis='bottom', text='x / point')
28 p.setTitle('y = sin(x)')
29
30 curve = p.plot()
31 idx = 0
32
33 def plotData():
34     global idx
35     tmp = np.sin(np.pi / 50 * idx)
36
37     if len(data)<historyLength:
38         data.append(tmp)
39     else:
40         data[:-1] = data[1:]
41         data[-1] = tmp
42         # curve.setPos(idx-historyLength, 0)
43         # p.enableAutoRange('x', True)
44
45     curve.setData(np.frombuffer(data, dtype=np.double))
46     # curve.setData(data) #也可以
47     idx += 1
48
49 timer = pg.QtCore.QTimer()
50 timer.timeout.connect(plotData)
51 timer.start(50)
52
53 app.exec_()


 浙公网安备 33010602011771号