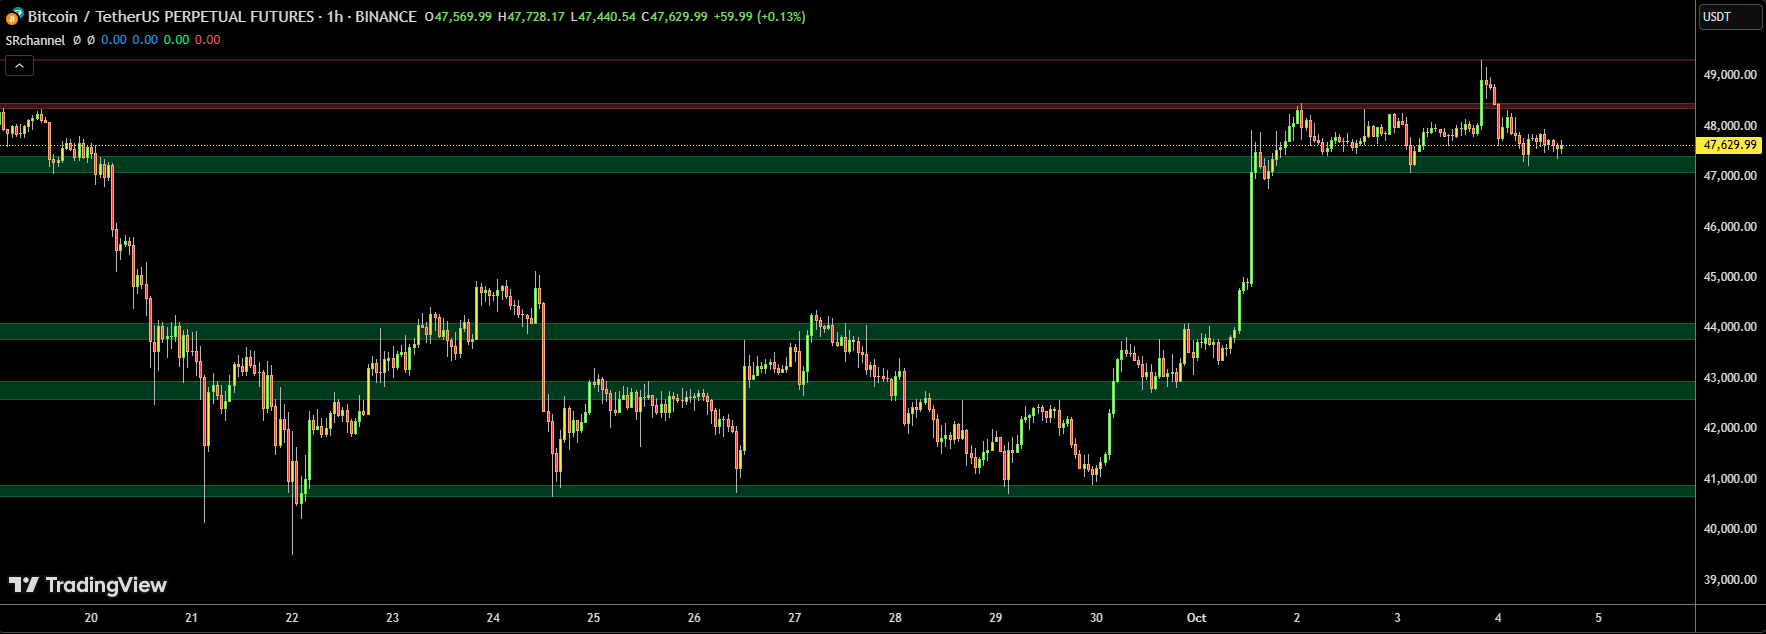
Support Resistance Channels
Support Resistance Channels
see https://www.tradingview.com/script/Ej53t8Wv-Support-Resistance-Channels/
How this script works?
- it finds and keeps Pivot Points
- when it found a new Pivot Point it clears older S/R channels then;
- for each pivot point it searches all pivot points in its own channel with dynamic width
- while creating the S/R channel it calculates its strength
- then sorts all S/R channels by strength
- it shows the strongest S/R channels, before doing this it checks old location in the list and adjust them for better visibility
- if any S/R channel was broken on last move then it gives alert and put shape below/above the candle
- The colors of the S/R channels are adjusted automatically
这个脚本是如何工作的?
- 它会查找并保存关键的转折点(Pivot Points)。
- 当发现一个新的转折点时,会清除之前生成的支撑/阻力(S/R)通道,然后:
- 针对每个转折点,搜索其动态宽度通道范围内的所有其他转折点。
- 在创建支撑/阻力通道的同时,计算该通道的强度。
- 将所有支撑/阻力通道按强度进行排序。
- 显示最强的几个支撑/阻力通道。在显示前,会参考通道在列表中的历史位置,进行调整以提升视觉清晰度。
- 如果最近的价格波动突破了某个支撑或阻力通道,脚本会发出警报,并在K线的下方或上方标记提示形状。
- 支撑/阻力通道的颜色会根据价格与通道的相对位置自动调整。
You can set/change following settings:
- Pivot Period
- Source: High/Low or Close/Open can be used
- Maximum Channel Width %: this is the maximum channel width rate, this is calculated using Highest/Lowest levels in last 300 bars
- Number of S/R to show: this is the number of Strongest S/R to show
- Loopback Period: While calculating S/R levels it checks Pivot Points in LoopBack Period
- Show S/R on last # Bars: To see S/R levels only on last N bars
- Start Date: the script starts calculating Pivot Point from this date, the reason I put this option is for visuality. Explained below
- You can set colors/transparency
- and You can enable/disable shapes for broken S/R levels
你可以设置或更改以下参数:
- 转折点周期(Pivot Period):用于识别转折点的K线周期。
- 数据源(Source):可选择使用最高价/最低价(High/Low)或收盘价/开盘价(Close/Open)作为计算依据。
- 最大通道宽度百分比(Maximum Channel Width %):支撑/阻力通道允许的最大宽度比例,基于最近300根K线的最高和最低价计算得出。
- 显示的S/R数量(Number of S/R to show):显示最强的支撑/阻力通道的数量。
- 回溯周期(Loopback Period):在计算支撑/阻力位时,用于查找转折点的历史K线数量。
- 仅在最近N根K线上显示S/R:可选择只在最近若干根K线上显示支撑/阻力通道。
- 起始日期(Start Date):脚本从该日期开始计算转折点。此选项主要是为了视觉效果更清晰(下文有进一步说明)。
- 颜色与透明度设置:可自定义支撑/阻力通道的颜色和透明度。
- 启用/禁用突破标记:可开启或关闭当支撑/阻力被突破时显示的提示形状。
// This source code is subject to the terms of the Mozilla Public License 2.0 at https://mozilla.org/MPL/2.0/
// © LonesomeTheBlue

//@version=6
indicator('My Support Resistance Channels', 'MySRchannel', overlay = true, max_bars_back = 501)
prd = input.int(defval = 10, title = 'Pivot Period', minval = 4, maxval = 30, group = 'Settings 🔨', tooltip = 'Used while calculating Pivot Points, checks left&right bars')
ppsrc = input.string(defval = 'High/Low', title = 'Source', options = ['High/Low', 'Close/Open'], group = 'Settings 🔨', tooltip = 'Source for Pivot Points')
ChannelW = input.int(defval = 5, title = 'Maximum Channel Width %', minval = 1, maxval = 8, group = 'Settings 🔨', tooltip = 'Calculated using Highest/Lowest levels in 300 bars')
minstrength = input.int(defval = 1, title = 'Minimum Strength', minval = 1, group = 'Settings 🔨', tooltip = 'Channel must contain at least 2 Pivot Points')
maxnumsr = input.int(defval = 6, title = 'Maximum Number of S/R', minval = 1, maxval = 10, group = 'Settings 🔨', tooltip = 'Maximum number of Support/Resistance Channels to Show') - 1
loopback = input.int(defval = 180, title = 'Loopback Period', minval = 100, maxval = 400, group = 'Settings 🔨', tooltip = 'While calculating S/R levels it checks Pivots in Loopback Period')
res_col = input.color(defval = color.new(color.red, 75), title = 'Resistance Color', group = 'Colors 🟡🟢🟣')
sup_col = input.color(defval = color.new(color.lime, 75), title = 'Support Color', group = 'Colors 🟡🟢🟣')
inch_col = input.color(defval = color.new(color.gray, 75), title = 'Color When Price in Channel', group = 'Colors 🟡🟢🟣')
showpp = input.bool(defval = false, title = 'Show Pivot Points', group = 'Extras ⏶⏷')
showsrbroken = input.bool(defval = false, title = 'Show Broken Support/Resistance', group = 'Extras ⏶⏷')
showthema1en = input.bool(defval = false, title = 'MA 1', inline = 'ma1')
showthema1len = input.int(defval = 50, title = '', inline = 'ma1')
showthema1type = input.string(defval = 'SMA', title = '', options = ['SMA', 'EMA'], inline = 'ma1')
showthema2en = input.bool(defval = false, title = 'MA 2', inline = 'ma2')
showthema2len = input.int(defval = 200, title = '', inline = 'ma2')
showthema2type = input.string(defval = 'SMA', title = '', options = ['SMA', 'EMA'], inline = 'ma2')

ma1 = showthema1en ? showthema1type == 'SMA' ? ta.sma(close, showthema1len) : ta.ema(close, showthema1len) : na
ma2 = showthema2en ? showthema2type == 'SMA' ? ta.sma(close, showthema2len) : ta.ema(close, showthema2len) : na

plot(ma1, color = not na(ma1) ? color.blue : na)
plot(ma2, color = not na(ma2) ? color.red : na)

// get Pivot High/low
float src1 = ppsrc == 'High/Low' ? high : math.max(close, open)
float src2 = ppsrc == 'High/Low' ? low : math.min(close, open)
float ph = ta.pivothigh(src1, prd, prd)
float pl = ta.pivotlow(src2, prd, prd)

// draw Pivot points
plotshape(bool(ph) and showpp, text = 'H', style = shape.labeldown, color = na, textcolor = color.new(color.red, 0), location = location.abovebar, offset = -prd)
plotshape(bool(pl) and showpp, text = 'L', style = shape.labelup, color = na, textcolor = color.new(color.lime, 0), location = location.belowbar, offset = -prd)

//calculate maximum S/R channel width
prdhighest = ta.highest(300)
prdlowest = ta.lowest(300)
cwidth = (prdhighest - prdlowest) * ChannelW / 100

// get/keep Pivot levels
var pivotvals = array.new_float(0)
var pivotlocs = array.new_float(0)
if bool(ph) or bool(pl)
    array.unshift(pivotvals, bool(ph) ? ph : pl)
    array.unshift(pivotlocs, bar_index)
    for x = array.size(pivotvals) - 1 to 0 by 1
        if bar_index - array.get(pivotlocs, x) > loopback // remove old pivot points
            array.pop(pivotvals)
            array.pop(pivotlocs)
            continue
        break

//find/create SR channel of a pivot point
get_sr_vals(ind) =>
    float lo = array.get(pivotvals, ind)
    float hi = lo
    int numpp = 0
    for y = 0 to array.size(pivotvals) - 1 by 1
        float cpp = array.get(pivotvals, y)
        float wdth = cpp <= hi ? hi - cpp : cpp - lo
        if wdth <= cwidth // fits the max channel width?
            if cpp <= hi
                lo := math.min(lo, cpp)
                lo
            else
                hi := math.max(hi, cpp)
                hi

            numpp := numpp + 20 // each pivot point added as 20
            numpp
    [hi, lo, numpp]

// keep old SR channels and calculate/sort new channels if we met new pivot point
var suportresistance = array.new_float(20, 0) // min/max levels
changeit(x, y) =>
    tmp = array.get(suportresistance, y * 2)
    array.set(suportresistance, y * 2, array.get(suportresistance, x * 2))
    array.set(suportresistance, x * 2, tmp)
    tmp := array.get(suportresistance, y * 2 + 1)
    array.set(suportresistance, y * 2 + 1, array.get(suportresistance, x * 2 + 1))
    array.set(suportresistance, x * 2 + 1, tmp)

if bool(ph) or bool(pl)
    supres = array.new_float(0) // number of pivot, strength, min/max levels
    stren = array.new_float(10, 0)
    // get levels and strengs
    for x = 0 to array.size(pivotvals) - 1 by 1
        [hi, lo, strength] = get_sr_vals(x)
        array.push(supres, strength)
        array.push(supres, hi)
        array.push(supres, lo)

    // add each HL to strengh
    for x = 0 to array.size(pivotvals) - 1 by 1
        h = array.get(supres, x * 3 + 1)
        l = array.get(supres, x * 3 + 2)
        s = 0
        for y = 0 to loopback by 1
            if high[y] <= h and high[y] >= l or low[y] <= h and low[y] >= l
                s := s + 1
                s
        array.set(supres, x * 3, array.get(supres, x * 3) + s)

    //reset SR levels
    array.fill(suportresistance, 0)
    // get strongest SRs
    src = 0
    for x = 0 to array.size(pivotvals) - 1 by 1
        stv = -1. // value
        stl = -1 // location
        for y = 0 to array.size(pivotvals) - 1 by 1
            if array.get(supres, y * 3) > stv and array.get(supres, y * 3) >= minstrength * 20
                stv := array.get(supres, y * 3)
                stl := y
                stl
        if stl >= 0
            //get sr level
            hh = array.get(supres, stl * 3 + 1)
            ll = array.get(supres, stl * 3 + 2)
            array.set(suportresistance, src * 2, hh)
            array.set(suportresistance, src * 2 + 1, ll)
            array.set(stren, src, array.get(supres, stl * 3))

            // make included pivot points' strength zero
            for y = 0 to array.size(pivotvals) - 1 by 1
                if array.get(supres, y * 3 + 1) <= hh and array.get(supres, y * 3 + 1) >= ll or array.get(supres, y * 3 + 2) <= hh and array.get(supres, y * 3 + 2) >= ll
                    array.set(supres, y * 3, -1)

            src := src + 1
            if src >= 10
                break

    for x = 0 to 8 by 1
        for y = x + 1 to 9 by 1
            if array.get(stren, y) > array.get(stren, x)
                tmp = array.get(stren, y)
                array.set(stren, y, array.get(stren, x))
                changeit(x, y)


get_level(ind) =>
    float ret = na
    if ind < array.size(suportresistance)
        if array.get(suportresistance, ind) != 0
            ret := array.get(suportresistance, ind)
            ret
    ret

get_color(ind) =>
    color ret = na
    if ind < array.size(suportresistance)
        if array.get(suportresistance, ind) != 0
            ret := array.get(suportresistance, ind) > close and array.get(suportresistance, ind + 1) > close ? res_col : array.get(suportresistance, ind) < close and array.get(suportresistance, ind + 1) < close ? sup_col : inch_col
            ret
    ret

var srchannels = array.new_box(10)
for x = 0 to math.min(9, maxnumsr) by 1
    box.delete(array.get(srchannels, x))
    srcol = get_color(x * 2)
    if not na(srcol)
        array.set(srchannels, x, box.new(left = bar_index, top = get_level(x * 2), right = bar_index + 1, bottom = get_level(x * 2 + 1), border_color = srcol, border_width = 1, extend = extend.both, bgcolor = srcol))

resistancebroken = false
supportbroken = false

// check if it's not in a channel
not_in_a_channel = true
for x = 0 to math.min(9, maxnumsr) by 1
    if close <= array.get(suportresistance, x * 2) and close >= array.get(suportresistance, x * 2 + 1)
        not_in_a_channel := false
        not_in_a_channel

// if price is not in a channel then check broken ones
if not_in_a_channel
    for x = 0 to math.min(9, maxnumsr) by 1
        if close[1] <= array.get(suportresistance, x * 2) and close > array.get(suportresistance, x * 2)
            resistancebroken := true
            resistancebroken
        if close[1] >= array.get(suportresistance, x * 2 + 1) and close < array.get(suportresistance, x * 2 + 1)
            supportbroken := true
            supportbroken

alertcondition(resistancebroken, title = 'Resistance Broken', message = 'Resistance Broken')
alertcondition(supportbroken, title = 'Support Broken', message = 'Support Broken')
plotshape(showsrbroken and resistancebroken, style = shape.triangleup, location = location.belowbar, color = color.new(color.lime, 0), size = size.tiny)
plotshape(showsrbroken and supportbroken, style = shape.triangledown, location = location.abovebar, color = color.new(color.red, 0), size = size.tiny)
这是一个非常完整且功能强大的 Pine Script 指标脚本,名为 “My Support Resistance Channels”(我的支撑阻力通道),由作者 LonesomeTheBlue 编写,用于在 TradingView 图表上自动识别并绘制支撑位、阻力位和价格通道。
📌 总体功能概述
该脚本的核心目标是:
自动识别历史上的关键高点(Pivot High)和低点(Pivot Low),将它们聚类成“支撑/阻力通道”,并以矩形区域的形式在价格图表上显示出来。
它不仅能显示当前有效的 S/R 通道,还能:
- 检测通道突破
- 显示已失效的支撑/阻力
- 支持自定义颜色、强度、宽度等参数
- 提供价格是否处于通道内的视觉反馈
🔧 一、基础设置(Inputs)
1. 指标声明
indicator('My Support Resistance Channels', 'MySRchannel', overlay = true, max_bars_back = 501)- 名称:
My Support Resistance Channels - 缩写:
MySRchannel overlay = true:绘制在价格图上(而非子图)max_bars_back = 501:最多回溯 501 根 K 线,确保能处理大量历史数据
2. 用户可调参数(分组为 Settings 和 Colors)
| 参数 | 说明 |
|---|---|
prd (Pivot Period) |
计算 Pivot 点时左右各看多少根 K 线(默认 10) |
ppsrc (Source) |
Pivot 点使用 High/Low 还是 Close/Open 作为源 |
ChannelW |
支撑/阻力通道的最大允许宽度(占 300 根 K 线极值范围的百分比) |
minstrength |
通道必须包含至少这么多“强度”的 Pivot 点(强度 ≥ 最小值 × 20) |
maxnumsr |
最多显示几个支撑/阻力通道(最多 10 个) |
loopback |
回溯多少根 K 线来查找 Pivot 点(默认 290) |
⚠️ 注意:
maxnumsr - 1是因为后面代码中用math.min(9, maxnumsr),所以实际最大是 9。
3. 颜色设置
res_col = 阻力颜色(红)
sup_col = 支撑颜色(绿)
inch_col = 价格在通道内时的颜色(灰)
4. 额外功能开关
showpp = 是否显示 Pivot 点标记(H/L)
showsrbroken = 是否显示支撑/阻力突破信号
showthema1en, showthema2en = 是否显示两条移动平均线(SMA/EMA)
📈 二、移动平均线(MA)绘制(可选)
ma1 = showthema1en ? (SMA 或 EMA) : na
ma2 = showthema2en ? (SMA 或 EMA) : na
plot(ma1, color.blue)
plot(ma2, color.red)- 用户可选择开启两条 MA(如 50 和 200),用于趋势判断。
🔍 三、Pivot 点检测
float src1 = ppsrc == 'High/Low' ? high : math.max(close, open)
float src2 = ppsrc == 'High/Low' ? low : math.min(close, open)
float ph = ta.pivothigh(src1, prd, prd)
float pl = ta.pivotlow(src2, prd, prd)- 使用
ta.pivothigh()和ta.pivotlow()函数检测局部极值。 - 支持两种源:
High/Low:用最高价和最低价Close/Open:用开盘/收盘价中的最大/最小值
plotshape(showpp and ph, text='H')  // 上方标记 H
plotshape(showpp and pl, text='L')  // 下方标记 L
📏 四、计算最大通道宽度
prdhighest = ta.highest(300)
prdlowest = ta.lowest(300)
cwidth = (prdhighest - prdlowest) * ChannelW / 100- 在最近 300 根 K 线中找最高价和最低价
- 用它们的差值乘以用户设置的百分比,得到“最大允许通道宽度”
✅ 这是为了避免把跨度太大的价格区域误判为有效通道。
🗃️ 五、存储 Pivot 点数据
var pivotvals = array.new_float(0)   // 存储 Pivot 价格
var pivotlocs = array.new_float(0)   // 存储 Pivot 所在的 bar_index

if bool(ph) or bool(pl)
    array.unshift(pivotvals, ph 或 pl)
    array.unshift(pivotlocs, bar_index)

    // 删除超过 loopback 期的旧 Pivot 点
    for x = array.size(...) -1 to 0
if bar_index - loc > loopback → pop()- 使用
unshift()把新 Pivot 插入数组头部 - 超过
loopback周期的旧点会被清除
🧩 六、构建支撑/阻力通道(核心逻辑)
函数:get_sr_vals(ind)
目的:以第 ind 个 Pivot 点为中心,尝试将其他相近的 Pivot 点“合并”成一个通道。
get_sr_vals(ind) =>
    float lo = pivot_price, hi = pivot_price
    int numpp = 0
    for each other pivot:
        if 该点价格在当前通道宽度内(wdth <= cwidth)
            扩展 hi 或 lo
            numpp += 20  // 每个包含的 Pivot 增加 20 强度
    return [hi, lo, numpp]
✅ 这是一个“聚类”过程:相似价格的 Pivot 被归为一组。
🏆 七、筛选最强的支撑/阻力通道
每次出现新 Pivot 时,重新计算所有可能的通道,并按“强度”排序。
步骤:
- 对每个 Pivot,调用
get_sr_vals()得到一个候选通道(hi, lo, strength) - 增强强度:统计过去
loopback根 K 线中,有多少根价格进入过这个通道(高点在内或低点在内),每进入一次 +1 - 从所有候选通道中选出强度最高的 10 个
- 为了避免重叠,一旦某个通道被选中,就将其包含的所有 Pivot 的强度设为 -1(防止重复使用)
- 按强度从高到低排序,存入
suportresistance数组(每 2 个元素存一个通道的 [高, 低])
🎨 八、绘制支撑/阻力通道(使用 box)
var srchannels = array.new_box(10)

for x = 0 to maxnumsr
    box.delete(old_box)
    color = get_color(...)  // 根据价格与通道位置决定颜色
    box.new(
        left = bar_index, right = bar_index + 1,
        top = hi, bottom = lo,
        extend = extend.both,  // 向左右无限延伸
        border_color = color,
        bgcolor = color
)- 使用
box对象绘制矩形通道 extend.both:通道向左右无限延伸- 颜色逻辑:
- 价格在通道上方 → 阻力(红色)
- 价格在通道下方 → 支撑(绿色)
- 价格在通道内部 → 灰色
🔔 九、突破检测与警报
// 检查当前价格是否不在任何通道内
not_in_a_channel = true
for 通道 in 所有通道:
    if close 在通道内 → not_in_a_channel = false

// 如果不在通道内,检查是否突破了某个通道
if not_in_a_channel
    for 通道 in 所有通道:
        if 昨日 ≤ 阻力 且 今日 > 阻力 → resistancebroken = true
        if 昨日 ≥ 支撑 且 今日 < 支撑 → supportbroken = true

// 发出警报
alertcondition(resistancebroken, title="Resistance Broken")
alertcondition(supportbroken, title="Support Broken")

// 显示突破信号(小三角)
plotshape(showsrbroken and resistancebroken, ▲ below bar)
plotshape(showsrbroken and supportbroken, ▼ above bar)
✅ 总结:这个脚本做了什么?
| 功能 | 实现方式 |
|---|---|
| 识别关键价格点 | 使用 ta.pivothigh/low 检测局部极值 |
| 聚类成通道 | 将价格相近的 Pivot 点合并,形成支撑/阻力区域 |
| 评估通道强度 | 基于包含的 Pivot 数量 + 历史测试次数 |
| 筛选最强通道 | 按强度排序,最多保留 10 个 |
| 可视化通道 | 用 box 绘制向两侧延伸的矩形区域 |
| 动态颜色反馈 | 根据价格与通道的相对位置变色 |
| 突破检测 | 检测价格是否突破通道边界 |
| 支持警报 | 可设置“阻力突破”或“支撑跌破”警报 |
💡 使用建议
- 适合周期:日线、4H、1H 等中长线周期
- 搭配使用:可结合 MA 判断趋势方向,在上升趋势中更关注支撑位,在下跌趋势中关注阻力位
- 通道宽度设置:市场波动大时可调高
ChannelW,震荡市可调低 - 突破信号:三角形信号可作为入场或止损参考
🚀 总体评价
这是一个非常成熟、逻辑严谨、可视化优秀的支撑阻力识别指标。它超越了简单的水平线,采用了“通道”概念,更符合真实市场的波动特性,是技术分析中非常实用的工具。
========== End

 浙公网安备 33010602011771号