

SQueeze Vergence
SQueeze Vergence
see https://www.tradingview.com/script/pB5pzyvj-SQueezeVergence/
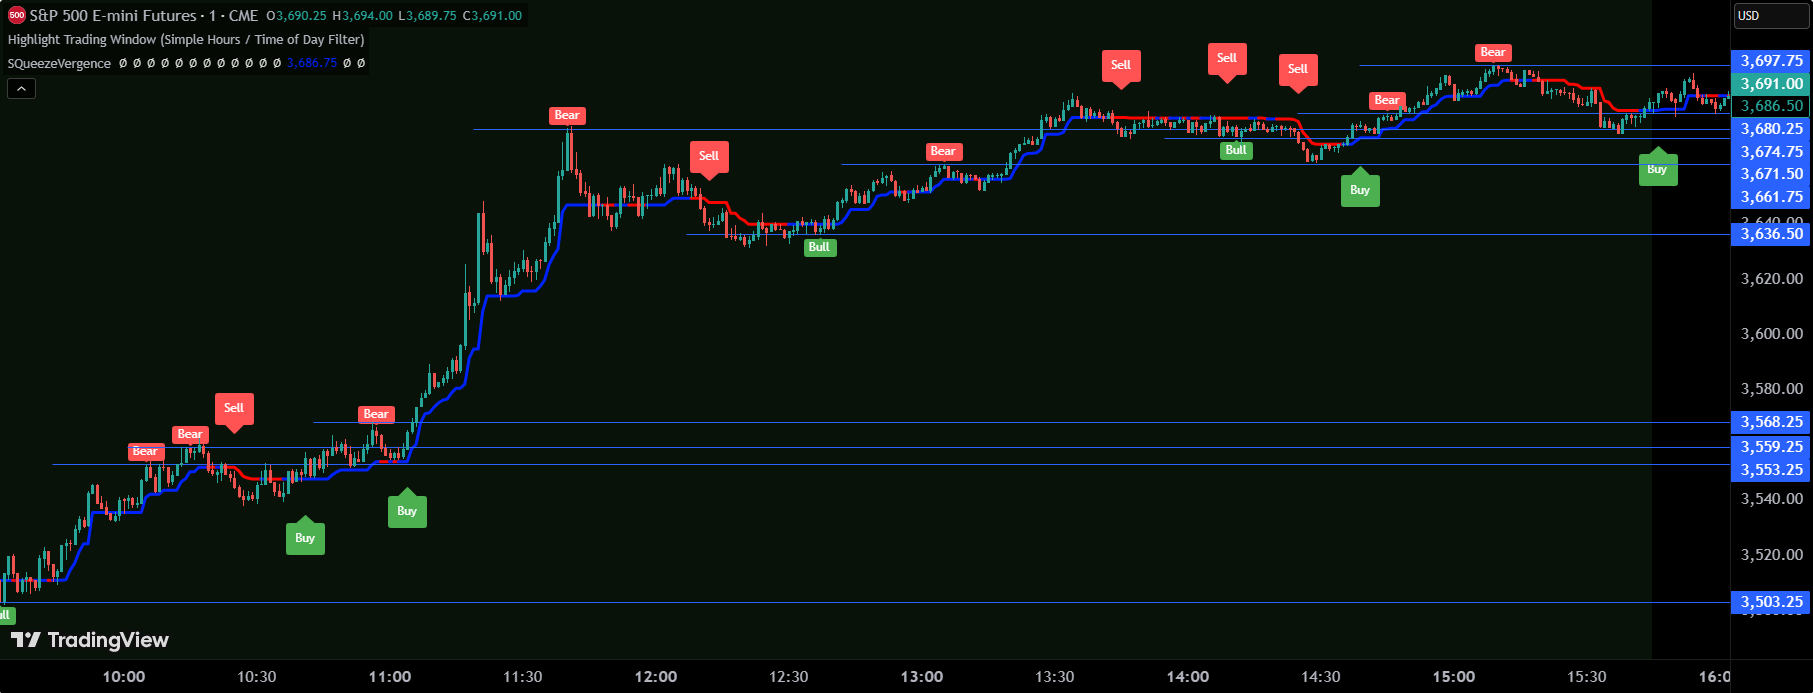
This is my SQueezeVergence indicator. It fires Buy and Sell signals based on squeeze momentum and trend. **It also creates Bull and Bear signals based on MACD divergence which should only be used as areas of support and resistance being as these signals repaint based on a 5 candle look back of pivots.** All settings are editable for better use. The default settings are what I use on the 1 Minute chart of ES to scalp. This is a simple indicator to help me get alerts on when I need to scalp. The divergence signals work well for areas of significance. I like to watch for breaks of these levels along with support and resistance. I hope this helps.
这是我的 SQueezeVergence 指标。它基于“挤压”动量和趋势来触发买入和卖出信号。它还会根据 MACD 背离生成看涨(Bull)和看跌(Bear)信号,但这些信号仅应作为支撑位和阻力位区域来参考,因为它们会根据过去 5 根K线的高低点进行重绘(repaint)。 所有设置均可编辑,以便更好地使用。默认设置是我在 ES(标普500期货)1分钟图表上用于短线交易(scalping)的参数。这是一个简单的指标,帮助我在需要做短线交易时获得提醒。背离信号在识别重要价格区域方面表现良好,我喜欢观察这些关键位的突破情况,并结合支撑与阻力位进行判断。希望这个指标对你有帮助。
//@version=5
indicator(title='My SQueeze Vergence', shorttitle='MySQueezeVergence', overlay=true, timeframe="", timeframe_gaps=true)
import Fontiramisu/fontilab/7 as fontilab

UseTM = input(true, title="Use TM Filter")

// ] ------------------ MACD ---------------- [
// Getting inputs
fast_length = input(title="Fast Length", defval=12, group="MACD 30 9")
slow_length = input(title="Slow Length", defval=26, group="MACD 30 9")
src = input(title="Source", defval=close, group="MACD 30 9")
signal_length = input.int(title="Signal Smoothing",  minval = 1, maxval = 50, defval = 9, group="MACD 30 9")
sma_source = input.string(title="Oscillator MA Type",  defval="EMA", options=["SMA", "EMA"], group="MACD 30 9")
sma_signal = input.string(title="Signal Line MA Type", defval="EMA", options=["SMA", "EMA"], group="MACD 30 9")
// Plot colors
col_macd = input(#2962FF, "MACD Line  ", inline="MACD", group="MACD 30 9")
col_signal = input(#FF6D00, "Signal Line  ", inline="Signal", group="MACD 30 9")

// Calculating
fast_ma = sma_source == "SMA" ? ta.sma(src, fast_length) : ta.ema(src, fast_length)
slow_ma = sma_source == "SMA" ? ta.sma(src, slow_length) : ta.ema(src, slow_length)
macd = fast_ma - slow_ma
signal = sma_signal == "SMA" ? ta.sma(macd, signal_length) : ta.ema(macd, signal_length)
hist = macd - signal


//plot(hist, title="Histogram", style=plot.style_histogram, color=color.new(color.yellow,30))
//plot(hist, title="Line", color=color.aqua, linewidth=2, display=display.all)
//plot(macd, title="MACD", color=col_macd, display=display.none)
//plot(signal, title="Signal", color=col_signal, display=display.none)


// ] -------------- Divergence Handle -------------- [
showDiv = input.bool(title="Show Divergence", defval=true, group="div settings")
lbR = input(title="Pivot Lookback Right", defval=5, group="div settings")
lbL = input(title="Pivot Lookback Left", defval=5, group="div settings")
rangeUpper = input(title="Max of Lookback Range", defval=60, group="div settings")
rangeLower = input(title="Min of Lookback Range", defval=5, group="div settings")


plotBull = true //input(title="Plot Bullish", defval=true, group="div settings")
plotBullPot = true //input(title="Plot Bullish Potential", defval=true, group="div settings")
plotHiddenBull = false //input(title="Plot Hidden Bullish", defval=false, group="div settings")
plotHiddenBullPot = false //input(title="Plot Hidden Bullish", defval=false, group="div settings")
plotBear = true //input(title="Plot Bearish", defval=true, group="div settings")
plotBearPot = true //input(title="Plot Bearish Potential Potential", defval=true, group="div settings")
plotHiddenBear = false //input(title="Plot Hidden Bearish", defval=false, group="div settings")
plotHiddenBearPot = false //input(title="Plot Hidden Bearish Potential", defval=false, group="div settings")
bearColor = color.red
bearPotColor = color.new(color.red, 20)
bullColor = color.green
bullPotColor = color.new(color.green, 20)
hiddenBullColor = color.new(color.green, 80)
hiddenBearColor = color.new(color.red, 80)
textColor = color.white
textColorDivPot = color.new(color.white, 20)
noneColor = color.new(color.white, 100)

float osc = hist

// Get pivots.
[plFound, phFound, plFoundPot, phFoundPot] = fontilab.getOscPivots(osc, lbL, lbR)

// Div for curent ut.
[bullDiv, bullDivPot, hiddenBullDiv, hiddenBullDivPot, bearDiv, bearDivPot, hiddenBearDiv, hiddenBearDivPot] =
     fontilab.plotDivergences(osc, lbR, plFound, phFound, plFoundPot, phFoundPot, rangeLower, rangeUpper)

//------
// Regular Bullish
plot(
     false and showDiv and plotBullPot and plFound ? osc[lbR] : na,
     offset=-lbR,
     title="Regular Bullish",
     linewidth=2,
     color=(bullDiv ? bullColor : noneColor)
     )

plotshape(
     false and showDiv and plotBullPot and bullDivPot ? osc[1] : na,
     offset= -1,
     title="Regular Bullish Pot Label",
     text="B",
     style=shape.labelup,
     location=location.absolute,
     color=bullPotColor,
     textcolor=textColorDivPot
     )

plotshape(
     showDiv and plotBullPot and bullDiv ? osc[lbR] : na,
     offset=-lbR,
     title="Regular Bullish Label",
     text=" Bull ",
     style=shape.labelup,
     location=location.belowbar,
     color=bullColor,
     textcolor=textColor
     )


//------
// Hidden Bullish
plot(
     false and showDiv and plotHiddenBull and plFound ? osc[lbR] : na,
     offset=-lbR,
     title="Hidden Bullish",
     linewidth=2,
     color=(hiddenBullDiv ? hiddenBullColor : noneColor)
     )

plotshape(
     false and showDiv and plotHiddenBullPot and hiddenBullDivPot ? osc[1] : na,
     offset=-1,
     title="Hidden Bullish Pot Label",
     text="H",
     style=shape.labelup,
     location=location.absolute,
     color=bullPotColor,
     textcolor=textColorDivPot
     )

plotshape(
     false and showDiv and plotHiddenBull and hiddenBullDiv ? osc[lbR] : na,
     offset=-lbR,
     title="Hidden Bullish Label",
     text=" H Bull ",
     style=shape.labelup,
     location=location.absolute,
     color=bullColor,
     textcolor=textColor
     )

//------
// Regular Bearish
plot(
     false and showDiv and plotBearPot and phFound ? osc[lbR] : na,
     offset=-lbR,
     title="Regular Bearish",
     linewidth=2,
     color=(bearDiv ? bearColor : noneColor)
     )

plotshape(
     false and showDiv and plotBearPot and bearDivPot ? osc[1] : na,
     offset=-1,
     title="Regular Bearish Pot Label",
     text="B",
     style=shape.labeldown,
     location=location.absolute,
     color=bearPotColor,
     textcolor=textColorDivPot
     )

plotshape(
     showDiv and plotBearPot and bearDiv ? osc[lbR] : na,
     offset=-lbR,
     title="Regular Bearish Label",
     text=" Bear ",
     style=shape.labeldown,
     location=location.abovebar,
     color=bearColor,
     textcolor=textColor
     )


//-----
// Hidden Bearish
plot(
     false and showDiv and plotHiddenBear and phFound ? osc[lbR] : na,
     offset=-lbR,
     title="Hidden Bearish",
     linewidth=2,
     color=(hiddenBearDiv ? hiddenBearColor : noneColor)
     )

plotshape(
     false and showDiv and plotHiddenBearPot and hiddenBearDivPot ? osc[1] : na,
     offset=-1,
     title="Hidden Bearish Pot Label",
     text="H",
     style=shape.labeldown,
     location=location.absolute,
     color=bearPotColor,
     textcolor=textColorDivPot
     )

plotshape(
     false and showDiv and plotHiddenBear and hiddenBearDiv ? osc[lbR] : na,
     offset=-lbR,
     title="Hidden Bearish Label",
     text=" H Bear ",
     style=shape.labeldown,
     location=location.absolute,
     color=bearColor,
     textcolor=textColor
     )


//-----------------------------------------------------


length = input(20, title='BB Length')
mult = input(2.0, title='BB MultFactor')
lengthKC = input(20, title='KC Length')
multKC = input(1.5, title='KC MultFactor')

useTrueRange = input(true, title='Use TrueRange (KC)')

// Calculate BB
source = close
basis = ta.sma(source, length)
dev = multKC * ta.stdev(source, length)
upperBB = basis + dev
lowerBB = basis - dev

// Calculate KC
ma = ta.sma(source, lengthKC)
range_1 = useTrueRange ? ta.tr : high - low
rangema = ta.sma(range_1, lengthKC)
upperKC = ma + rangema * multKC
lowerKC = ma - rangema * multKC

sqzOn = lowerBB > lowerKC and upperBB < upperKC
sqzOff = lowerBB < lowerKC and upperBB > upperKC
noSqz = sqzOn == false and sqzOff == false

val = ta.linreg(source - math.avg(math.avg(ta.highest(high, lengthKC), ta.lowest(low, lengthKC)), ta.sma(close, lengthKC)), lengthKC, 0)

iff_1 = val > nz(val[1]) ? color.lime : color.green
iff_2 = val < nz(val[1]) ? color.red : color.maroon
bcolor = val > 0 ? iff_1 : iff_2
scolor = noSqz ? color.blue : sqzOn ? color.black : color.gray


//plot(val, color=bcolor, style=plot.style_histogram, linewidth=4)
//plot(0, color=scolor, style=plot.style_cross, linewidth=2)

period=input(20,"CCI period")
coeff=input(1,"ATR Multiplier")
AP=input(5,"ATR Period")
ATR=ta.sma(ta.tr,AP)
src1=input(close)
upT=low-ATR*coeff
downT=high+ATR*coeff
MagicTrend=0.0
MagicTrend := ta.cci(src1,period)>=0 ? (upT<nz(MagicTrend[1]) ? nz(MagicTrend[1]) : upT) : (downT>nz(MagicTrend[1]) ? nz(MagicTrend[1]) : downT)
color1= ta.cci(src1,period)>=0 ? #0022FC : #FC0400


plot(MagicTrend, color=color1, linewidth=3)
//--------------------------------------------------------------------

isFilterBuy = not UseTM or close > MagicTrend
isFilterSell = not UseTM or close < MagicTrend

isBuy = val > nz(val[1]) and val>0 and nz(val[1]) < 0 and close > open and isFilterBuy
isSell = val < nz(val[1]) and val<0 and nz(val[1]) > 0 and close < open and isFilterSell

plotshape(isBuy ? 1 : na, style=shape.labelup, location=location.belowbar, size=size.normal, color=color.green, text="Buy",textcolor=color.white)
plotshape(isSell  ? 1 : na, style=shape.labeldown, location=location.abovebar, size=size.normal, color=color.red, text="Sell",textcolor=color.white)

alertcondition(isBuy , "Buy Signal", "Buy Signal")
alertcondition(isSell , "Sell Signal", "Sell Signal")
这段 Pine Script 代码是用于 TradingView 的一个复杂技术分析指标脚本,名为 SQueezeVergence。它结合了多个经典技术指标(布林带、肯特纳通道、MACD、CCI、ATR)和发散信号检测(通过外部库),并引入了一个趋势过滤器(Magic Trend),最终生成买卖信号。
📌 总体功能概述
SQueezeVergence 是一个多因子融合指标,主要功能包括:
- Squeeze 判断:使用布林带(BB)和肯特纳通道(KC)判断市场是否处于“波动压缩”状态(即潜在突破前兆)。
- MACD 振荡器发散检测:识别价格与 MACD 直方图之间的看涨/看跌背离(Divergence)。
- 趋势过滤器 Magic Trend:基于 CCI 和 ATR 构建的趋势跟踪指标,用于过滤买卖信号。
- 自动生成买卖信号:当满足特定动量、价格行为和趋势条件时,显示“Buy”或“Sell”标签,并支持警报。
🔍 逐段解析
1. 脚本元信息
//@version=5
indicator(shorttitle='SQueezeVergence', title='SQueezeVergence', overlay=true, timeframe="", timeframe_gaps=true)
import Fontiramisu/fontilab/7 as fontilab - 使用 Pine Script v5。
- 指标名为
SQueezeVergence,显示在主图(overlay=true)。 - 引入外部库
fontilab(用于检测发散)。
2. 趋势过滤开关
UseTM = input(true, title="Use TM Filter")- 是否启用 Magic Trend 作为买卖信号的过滤器。
3. MACD 设置与计算
fast_length = input(12)
slow_length = input(26)
src = input(close)
signal_length = input(9)
sma_source = input.string("EMA", options=["SMA", "EMA"])
sma_signal = input.string("EMA", options=["SMA", "EMA"])- 标准 MACD 参数(12, 26, 9),支持选择均线类型(SMA/EMA)。
- 计算 MACD 线、信号线、直方图(
hist)。
macd = fast_ma - slow_ma
signal = sma_signal == "SMA" ? ta.sma(macd, signal_length) : ta.ema(macd, signal_length)
hist = macd - signalhist将作为振荡器用于发散检测。
✅ 注意:MACD 的直方图被用作动量指标来检测背离,而非直接绘图。
4. 发散(Divergence)设置与检测
showDiv = input.bool(true, "Show Divergence")
lbR = input(5, "Pivot Lookback Right")
lbL = input(5, "Pivot Lookback Left")
rangeUpper = input(60)
rangeLower = input(5)- 设置发散检测的参数:左右回溯周期、最大/最小查找范围。
使用外部库检测发散
[plFound, phFound, plFoundPot, phFoundPot] = fontilab.getOscPivots(osc, lbL, lbR)
[bullDiv, bullDivPot, hiddenBullDiv, ...] = fontilab.plotDivergences(...)
osc = hist:以 MACD 直方图为振荡器。getOscPivots():寻找局部高低点。plotDivergences():识别四种发散:- Regular Bullish Divergence(常规看涨背离):价格创新低,但指标未创新低。
- Hidden Bullish Divergence(隐藏看涨背离):价格未创新低,但指标创新低(趋势延续信号)。
- Regular Bearish Divergence(常规看跌背离):价格创新高,指标未创新高。
- Hidden Bearish Divergence(隐藏看跌背离):价格未创新高,指标创新高。
绘图部分(仅标注)
- 使用
plotshape在图上标记背离信号(如“B”、“Bear”等)。 - 当前代码中这些绘图大多被
false and ...禁用,实际上并未显示背离信号。
⚠️ 重要发现:尽管配置了发散检测逻辑,但由于
plot和plotshape前加了false and,背离信号在图表上不会显示。可能是开发者调试时关闭了。
5. Squeeze(布林带 + 肯特纳通道)
length = input(20, "BB Length")
mult = input(2.0, "BB MultFactor")
lengthKC = input(20, "KC Length")
multKC = input(1.5, "KC MultFactor")
useTrueRange = input(true, "Use TrueRange (KC)")- 布林带(Bollinger Bands):基于标准差。
- 肯特纳通道(Keltner Channel):基于 ATR 或 High-Low 范围。
计算通道
basis = ta.sma(source, length)
dev = multKC * ta.stdev(source, length)
upperBB = basis + dev
lowerBB = basis - dev

ma = ta.sma(source, lengthKC)
range_1 = useTrueRange ? ta.tr : high - low
rangema = ta.sma(range_1, lengthKC)
upperKC = ma + rangema * multKC
lowerKC = ma - rangema * multKC
Squeeze 状态判断
sqzOn = lowerBB > lowerKC and upperBB < upperKC  // BB 在 KC 内部 → 压缩
sqzOff = lowerBB < lowerKC and upperBB > upperKC // BB 在 KC 外部 → 扩张
noSqz = not sqzOn and not sqzOff // 中性状态- Squeeze On:市场波动率低,可能即将爆发。
- Squeeze Off:波动率上升,趋势开始。
- No Squeeze:中间状态。
动量线 val
val = ta.linreg(
    source - math.avg(
        math.avg(ta.highest(high, lengthKC), ta.lowest(low, lengthKC)),
        ta.sma(close, lengthKC)
    ),
    lengthKC, 0
)- 这是一个去中心化的动量指标,计算价格相对于“中间价”(高低中值 + 移动平均)的线性回归值。
- 反映价格偏离正常区间的动量强度。
颜色逻辑
bcolor = val > 0 ? (val > val[1] ? lime : green) : (val < val[1] ? red : maroon)
scolor = noSqz ? blue : sqzOn ? black : gray- 动量方向和强度着色。
⚠️ 注意:
val和scolor被注释掉了,未在图表上绘制。
6. Magic Trend(趋势过滤器)
period=input(20,"CCI period")
coeff=input(1,"ATR Multiplier")
AP=input(5,"ATR Period")
ATR=ta.sma(ta.tr,AP)
src1=input(close)
upT=low-ATR*coeff
downT=high+ATR*coeff
MagicTrend=0.0
MagicTrend := ta.cci(src1,period)>=0 ?
    (upT<nz(MagicTrend[1]) ? nz(MagicTrend[1]) : upT) :
    (downT>nz(MagicTrend[1]) ? nz(MagicTrend[1]) : downT)
color1= ta.cci(src1,period)>=0 ? #0022FC : #FC0400
工作原理:
- 基于 CCI 指标方向决定趋势。
- 上升趋势时:
MagicTrend = max(upT, MagicTrend[1]),形成上升支撑。 - 下降趋势时:
MagicTrend = min(downT, MagicTrend[1]),形成下降压力。 - 类似于 SuperTrend 或 Trend Multiplier 的变体。
绘图
plot(MagicTrend, color=color1, linewidth=3)- 蓝色线:上升趋势。
- 红色线:下降趋势。
7. 买卖信号生成
isFilterBuy = not UseTM or close > MagicTrend
isFilterSell = not UseTM or close < MagicTrend

isBuy = val > nz(val[1]) and val>0 and nz(val[1]) < 0 and close > open and isFilterBuy
isSell = val < nz(val[1]) and val<0 and nz(val[1]) > 0 and close < open and isFilterSell
买入条件 isBuy
val > val[1]:动量上升。val > 0且val[1] < 0:动量由负转正(零轴上穿)。close > open:阳线,确认买方主导。isFilterBuy:启用 TM 时,要求close > MagicTrend(处于上升趋势)。
卖出条件 isSell
val < val[1]:动量下降。val < 0且val[1] > 0:动量由正转负(零轴下穿)。close < open:阴线。isFilterSell:启用 TM 时,要求close < MagicTrend(处于下降趋势)。
信号显示与警报
plotshape(isBuy ? 1 : na, style=shape.labelup, location=belowbar, text="Buy")
plotshape(isSell ? 1 : na, style=shape.labeldown, location=abovebar, text="Sell")

alertcondition(isBuy, "Buy Signal", "Buy Signal")
alertcondition(isSell, "Sell Signal", "Sell Signal")- 在图表上显示“Buy”/“Sell”标签。
- 支持创建交易警报。
✅ 总结:这个指标的核心逻辑
| 模块 | 功能 |
|---|---|
| Squeeze Detection | 使用 BB 和 KC 判断市场是否处于低波动状态(潜在突破) |
Momentum (val) |
自定义动量指标,检测动量方向和零轴穿越 |
| Magic Trend | CCI + ATR 构建的趋势过滤器,避免逆势交易 |
| Divergence Detection | 利用 MACD 直方图检测背离(但当前未启用显示) |
| 买卖信号 | 动量翻转 + 蜡烛形态 + 趋势过滤 → 生成信号 |
⚠️ 潜在问题与改进建议
-
背离信号未显示:
- 所有
plot和plotshape前加了false and,导致背离不显示。 - ✅ 建议:去掉
false and以启用背离提示。
- 所有
-
动量指标
val未绘制:- 注释掉了
plot(val),用户无法直观看到动量变化。 - ✅ 建议:取消注释以增强可视化。
- 注释掉了
-
Magic Trend 可能滞后:
- 基于 ATR 和 CCI,在震荡市可能频繁切换方向。
- 可考虑加入过滤(如最小持仓周期)。
-
参数较多,需优化:
- 用户需理解多个参数含义,建议分组清晰。
📈 交易策略建议(基于此指标)
-
做多时机:
val从负转正,出现“Buy”标签。- 价格在 Magic Trend 上方(蓝色线)。
- 可结合 Squeeze 即将释放(BB 即将突破 KC)时使用。
-
做空时机:
val从正转负,出现“Sell”标签。- 价格在 Magic Trend 下方(红色线)。
-
过滤震荡:
sqzOn期间谨慎交易,等待突破。noSqz或sqzOff更适合趋势交易。
🏁 结论
这是一个高级复合型指标,融合了:
- 波动率压缩(Squeeze)
- 动量转折(val)
- 趋势过滤(Magic Trend)
- 背离检测(Divergence)
虽然部分功能(如背离)当前被禁用,但其核心买卖信号逻辑清晰,适合用于趋势启动初期的动量交易。
✅ 推荐用于:日线或4小时图,捕捉趋势反转或延续信号。
🔧 建议:启用背离显示,并结合成交量或其他确认工具使用。
========= End

 浙公网安备 33010602011771号