
Python3+profile性能分析
一、说明
我们简单地分析性能,可以通过运行前后的datatime.datatime.now()相减来确定运行两个时间中间的代码花费了多少时间。
但这种做法只能记录单次运行花费的时间、不能方便计算运行多次平均花费的时间,更不能深入分析整个程序各函数所花费的时间。
二、利用timeit分析语句/函数性能
示例代码如下:
import timeit


def test():
    """Stupid test function"""
    for i in range(10000):
        # print(i)
        continue

# 运行test函数10次,返回平均每次耗费的时间
# timeit.timeit(stmt='pass', setup='pass', timer=<default timer>, number=1000000, globals=None)
print("timeit directly:")
print(timeit.timeit(stmt="test()", setup="from __main__ import test", number=10))
# stmt参数也可以是直接的一条语句,下同
# print(timeit.timeit(stmt="'-'.join(str(n) for n in range(100))", setup="from __main__ import test", number=10))
# 运行test函数10次,返回各次所耗费时间组成的列表
# timeit.repeat(stmt='pass', setup='pass', timer=<default timer>, repeat=5, number=1000000, globals=None)
print("\nrepeat directly:")
print(timeit.repeat(stmt="test()", setup="from __main__ import test", number=10))

# 使用类的用处是对于同一条语句或函数,只写一次,就可以周时用来timeit和repeat
# class timeit.Timer(stmt='pass', setup='pass', timer=<timer function>, globals=None)
timeit_obj = timeit.Timer(stmt="test()", setup="from __main__ import test")
# timeit.Timer.timeit(number=1000000)
print("\ntimeit by class:")
print(timeit_obj.timeit(number=10))
# timeit.Timer.repeat(repeat=5, number=1000000)
print("\nrepeat by class:")
print(timeit_obj.repeat(number=10))
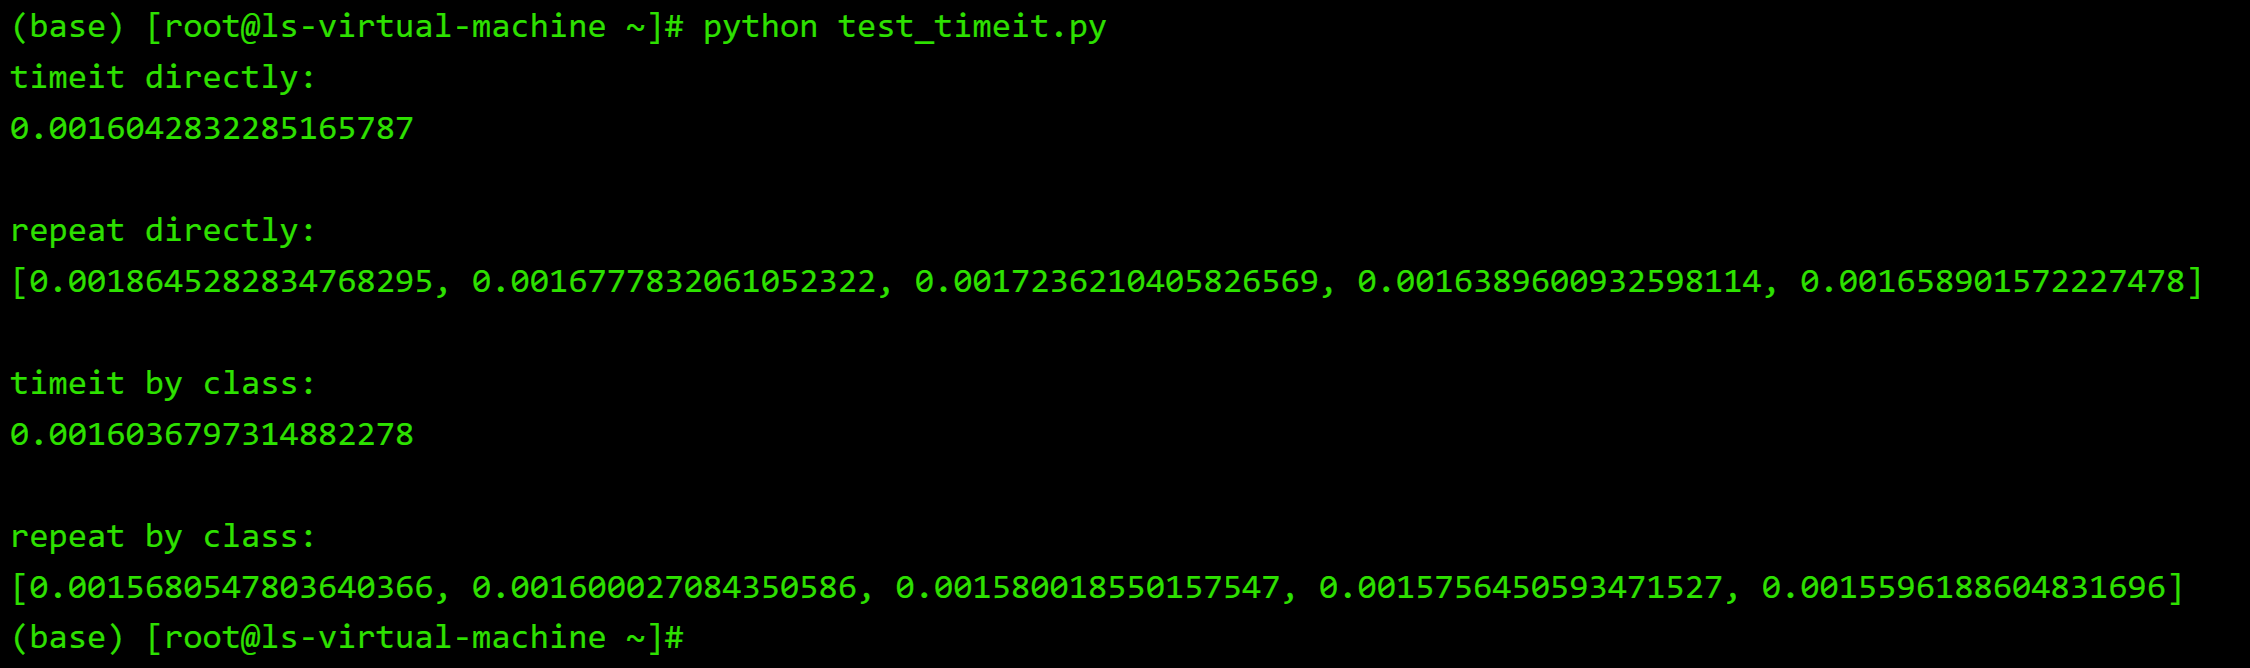
运行结果如下:
三、使用profile分析整个程序性能
示例代码如下:
import time
import cProfile, pstats, profile


def add(x, y):
    time.sleep(1)
    value = x + y
    return value


def sub(x, y):
    time.sleep(1.5)
    value = x - y
    return value


class TestProfile:
    def calc(self, x, y):
        time.sleep(1)
        add_result = add(x, y)
        sub_result = sub(x, y)
        print(f"{x} add {y} result is: {add_result}")
        print(f"{x} sub {y} result is: {sub_result}")


if __name__ == '__main__':
    obj = TestProfile()
    # 要分析的函数。
    # 原来调用该怎么写就写成相应的字符串形式就好了
    be_analysed_function = "obj.calc(1,2)"
    # 给此次监测命个名,随意起。
    analysed_tag_name = "test_analysed"
    # 使用c语言版的profile进行分析,好处是自身占用资源更少,对函数的耗时定位更准确
    cProfile.run(be_analysed_function, analysed_tag_name)
    # 使用python版的profile进行分析,格式都一样的。
    # profile.run(be_analysed_function, analysed_tag_name)

    # 对此次监测进行分析。
    s = pstats.Stats(analysed_tag_name)
    # 移除文件目录,减少打印输出
    # s.strip_dirs()
    # 排序。
    # "time"表示按函数总耗时排序,python3.7后可用枚举变量pstat.SortKey来取排序项
    s.sort_stats("time")
    # 打印统计结果
    # ncalls--函数被调用的次数
    # tottime--此函数在所有调用中共耗费的时间秒数(不包括其调用的子函数耗费的时间)。分析耗时主要看这个。
    # percall--此函数平均每次被调用耗时。分析耗时次要看这个
    # cumtime--执行此函数及其调用子函数所占用的时间。
    # percall--此函数平均每次调用每个子函数所用的时间。
    s.print_stats()
    # print_stats的结果并不显示谁调用的谁,比如是A调用的C还是B调用的C是不清楚的
    # 要打印出函数的调用者,可使用print_callers()
    # 结果中右边是被调用函数,左边是调用该函数的函数
    # s.print_callers()
运行结果如下图:

参考:
https://docs.python.org/3/library/profile.html#module-cProfile

 浙公网安备 33010602011771号